Aurora: Fire Incidents, Illinois (IL)
Where are fire incidents reported in Aurora, IL
Something went wrong! Please refresh the page.
| Fire incidents reported | |
|---|---|
| Sreet name | Count |
| NEW YORK ST | 214 |
| LAKE ST | 166 |
| FARNSWORTH AVE | 152 |
| GALENA BLVD | 138 |
| DOWNER PL | 92 |
| JACKSON ST | 82 |
| FIFTH AVE | 74 |
| BROADWAY ST | 70 |
| UNION ST | 70 |
| RIVER ST | 64 |
| LILAC LN | 62 |
| ILLINOIS AVE | 60 |
| HIGHLAND AVE | 58 |
| INDIAN TRAIL RD | 58 |
| LIBERTY ST | 58 |
| CALHOUN ST | 54 |
| LINCOLN AVE | 54 |
| LASALLE ST | 52 |
| MARYWOOD AVE | 52 |
| EOLA RD | 50 |
| NORTH AVE | 50 |
| BANGS ST | 48 |
| FOURTH ST | 48 |
| OGDEN AVE | 48 |
| RIDGEWAY AVE | 48 |
| BEST PL | 46 |
| PLUM ST | 46 |
| PRAIRIE ST | 46 |
| VILLAGE GREEN DR | 46 |
| FOX VALLEY CENTER DR | 44 |
| Other | 2,158 |
2002 - 2018 National Fire Incident Reporting System (NFIRS) incidents
- Incident types reported to NFIRS in Aurora, IL
- 29,86949.1%Rescue & EMS
- 9,60515.8%False Alarm
- 8,27713.6%Hazardous Condition
- 4,3467.1%Good Intent Call
- 4,3087.1%Fire
- 4,0736.7%Service Call
- 2470.4%Special Incident
- Fire incident types reported to NFIRS in Aurora, IL
- 1,93444.9%Structure Fires
- 1,08525.2%Outside Fires
- 91721.3%Mobile Property/Vehicle Fires
- 3728.6%Other
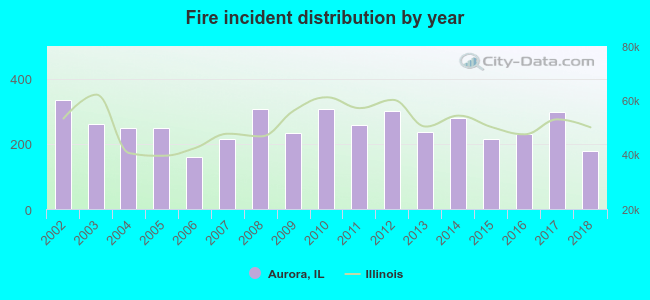 According to the data from the years 2002 - 2018 the average number of fire incidents per year is 253. The highest number of reported fires - 334 took place in 2002, and the least - 159 in 2006. The data has a declining trend.
The average number of yearly fire incidents per 10k residents in Aurora, IL compared to nearest cities:
(Note: Based on data for the last 3 years, including only cities with population 5,000 and above)
| Aurora: | 11.7 |
| Montgomery: | 37.0 |
| North Aurora: | 16.9 |
| Oswego: | 18.8 |
| Batavia: | 30.0 |
| Warrenville: | 33.7 |
| Naperville: | 16.1 |
| Sugar Grove: | 41.0 |
| Geneva: | 36.2 |
 The median response time based on all reported fire incidents is 5 minutes. This is comparable to the state median value.
The median response time in Aurora, IL compared to nearest cities:
(Note: Based on data for all years, including only cities with at least 500 fire incidents)
| Aurora: | 5 minutes |
| Montgomery: | 6 minutes |
| North Aurora: | 5 minutes |
| Oswego: | 6 minutes |
| Batavia: | 5 minutes |
| Warrenville: | 5 minutes |
| Naperville: | 5 minutes |
| Sugar Grove: | 7 minutes |
| Geneva: | 5 minutes |
 According to the reports from the years 2002 - 2018 the average number of fire-related yearly deaths is 1. The highest number of deaths - 6 took place in 2011, and the lowest - 0 in 2004. The data has a decreasing trend.
The average number of deaths per 1,000 fire incidents is 4. This indicator was the highest - 23 in 2011, and the lowest 0 in 2004. The trend for deaths per 1,000 fire incidents is decreasing. Compared to the state value the number of deaths per 1,000 fire incidents is much higher.
According to the reports from the years 2002 - 2018 the average number of fire-related yearly deaths is 1. The highest number of deaths - 6 took place in 2011, and the lowest - 0 in 2004. The data has a decreasing trend.
The average number of deaths per 1,000 fire incidents is 4. This indicator was the highest - 23 in 2011, and the lowest 0 in 2004. The trend for deaths per 1,000 fire incidents is decreasing. Compared to the state value the number of deaths per 1,000 fire incidents is much higher.Deaths per 1,000 incidents in Aurora, IL compared to nearest cities:
(Note: Based on data for all years, including only cities with at least 2,500 fire incidents)
| Aurora: | 4.4 |
| Naperville: | 1.0 |
| Plainfield: | 1.2 |
| Bolingbrook: | 1.0 |
| Joliet: | 2.2 |
| Addison: | 1.6 |
| Elgin: | 1.4 |
 According to the reports from the years 2002 - 2018 the average number of fire-related casualties per year is 4. The highest number of injuries - 17 took place in 2011, and the lowest - 0 in 2006. The data has a declining trend.
The average number of injuries per 1,000 fire incidents is 14. This indicator was the highest - 66 in 2011, and the lowest 0 in 2006. The trend for injuries per 1,000 incidents is growing. Compared to the state value the number of casualties per 1,000 fire incidents is higher.
According to the reports from the years 2002 - 2018 the average number of fire-related casualties per year is 4. The highest number of injuries - 17 took place in 2011, and the lowest - 0 in 2006. The data has a declining trend.
The average number of injuries per 1,000 fire incidents is 14. This indicator was the highest - 66 in 2011, and the lowest 0 in 2006. The trend for injuries per 1,000 incidents is growing. Compared to the state value the number of casualties per 1,000 fire incidents is higher.Casualties per 1,000 incidents in Aurora, IL compared to nearest cities:
(Note: Based on data for all years, including only cities with at least 500 fire incidents)
| Aurora: | 14.2 |
| Montgomery: | 20.3 |
| North Aurora: | 0.0 |
| Oswego: | 12.3 |
| Batavia: | 10.8 |
| Warrenville: | 33.4 |
| Naperville: | 23.5 |
| Sugar Grove: | 4.3 |
| Geneva: | 4.5 |
 34.5% incidents where reported in the morning and 65.5% in the evening. The most fires (15.9%) took place on Sunday, and the least (12.8%) on Wednesday.
 Based on the 4,308 fire incident reports from years 2002 - 2018 most fires (10.7%) took place during July, and the least (6.0%) in February.
 Out of all 60,789 cases reported during the years 2002 - 2018, the most belonged to the categories: Rescue & EMS (49.1%), False Alarm (15.8%), and Hazardous Condition (13.6%).
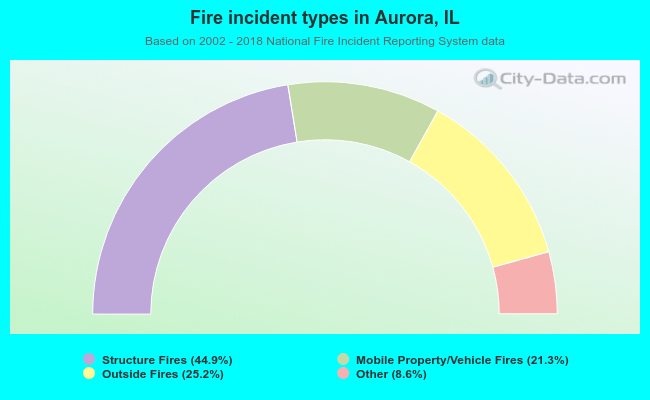 When looking into fire subcategories, the most reports belonged to: Structure Fires (44.9%), and Outside Fires (25.2%).