Crime rate in Sarasota, Florida (FL): murders, rapes, robberies, assaults, burglaries, thefts, auto thefts, arson, law enforcement employees, police officers, crime map
Crime rate in Sarasota, FL
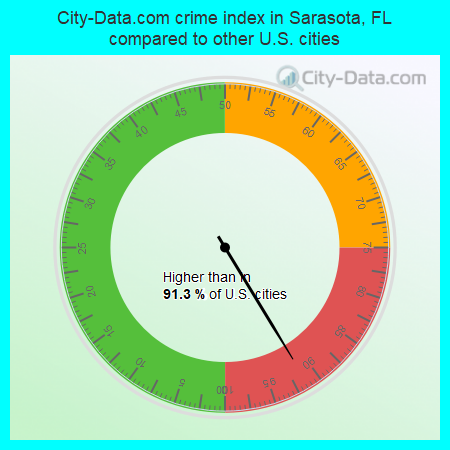
The 2022 crime rate in Sarasota, FL is 347 (City-Data.com crime index), which is 1.4 times greater than the U.S. average. It was higher than in 91.3% U.S. cities. The 2022 Sarasota crime rate rose by 18% compared to 2020. The number of homicides stood at 7 - an increase of 6 compared to 2020. In the last 5 years Sarasota has seen rise of violent crime and decreasing property crime.See how dangerous Sarasota, FL is compared to the nearest cities:
(Note: Higher means more crime)
(Note: Higher means more crime)
| Sarasota: | 346.7 |
| Longboat Key: | 58.2 |
| Bradenton: | 206.7 |
| Palmetto: | 275.9 |
| Bradenton Beach: | 127.8 |
| Holmes Beach: | 74.2 |
| Venice: | 86.4 |
| North Port: | 88.2 |
| St. Pete Beach: | 65.7 |
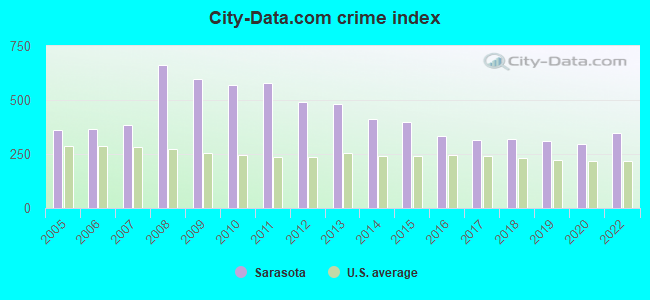
The City-Data.com crime index weighs serious crimes and violent crimes more heavily. Higher means more crime, U.S. average is 246.1. It adjusts for the number of visitors and daily workers commuting into cities.
- means the value is smaller than the state average.- means the value is about the same as the state average.
- means the value is bigger than the state average.
- means the value is much bigger than the state average.
According to our research of Florida and other state lists, there were 301 registered sex offenders living in Sarasota, Florida as of June 01, 2024.
The ratio of all residents to sex offenders in Sarasota is 187 to 1.
Violent crime rate in 2022
| Sarasota: | 371.1 |
| U.S. Average: | 219.8 |
Violent crime rate in 2020
| Sarasota: | 325.4 |
| U.S. Average: | 228.2 |
Violent crime rate in 2019
| Sarasota: | 307.0 |
| U.S. Average: | 219.9 |
Violent crime rate in 2018
| Sarasota: | 318.8 |
| U.S. Average: | 221.2 |
Violent crime rate in 2017
| Sarasota: | 306.7 |
| U.S. Average: | 226.2 |
Violent crime rate in 2016
| Sarasota: | 286.2 |
| U.S. Average: | 227.3 |
Violent crime rate in 2015
| Sarasota: | 365.3 |
| U.S. Average: | 219.3 |
Violent crime rate in 2014
| Sarasota: | 359.9 |
| U.S. Average: | 211.1 |
Violent crime rate in 2013
| Sarasota: | 429.8 |
| U.S. Average: | 214.2 |
Violent crime rate in 2012
| Sarasota: | 435.4 |
| U.S. Average: | 187.4 |
Violent crime rate in 2011
| Sarasota: | 536.8 |
| U.S. Average: | 187.1 |
Violent crime rate in 2010
| Sarasota: | 523.9 |
| U.S. Average: | 195.7 |
Violent crime rate in 2009
| Sarasota: | 562.1 |
| U.S. Average: | 208.9 |
Violent crime rate in 2008
| Sarasota: | 606.0 |
| U.S. Average: | 222.5 |
Violent crime rate in 2007
| Sarasota: | 358.4 |
| U.S. Average: | 229.1 |
Violent crime rate in 2006
| Sarasota: | 329.1 |
| U.S. Average: | 232.6 |
Violent crime rate in 2005
| Sarasota: | 315.2 |
| U.S. Average: | 227.0 |
Property crime rate in 2022
| Sarasota: | 252.8 |
| U.S. Average: | 166.5 |
Property crime rate in 2020
| Sarasota: | 216.2 |
| U.S. Average: | 169.6 |
Property crime rate in 2019
| Sarasota: | 248.9 |
| U.S. Average: | 179.7 |
Property crime rate in 2018
| Sarasota: | 264.0 |
| U.S. Average: | 190.2 |
Property crime rate in 2017
| Sarasota: | 261.2 |
| U.S. Average: | 206.4 |
Property crime rate in 2016
| Sarasota: | 303.7 |
| U.S. Average: | 216.6 |
Property crime rate in 2015
| Sarasota: | 347.0 |
| U.S. Average: | 221.5 |
Property crime rate in 2014
| Sarasota: | 391.3 |
| U.S. Average: | 230.8 |
Property crime rate in 2013
| Sarasota: | 447.2 |
| U.S. Average: | 250.4 |
Property crime rate in 2012
| Sarasota: | 491.0 |
| U.S. Average: | 267.3 |
Property crime rate in 2011
| Sarasota: | 527.1 |
| U.S. Average: | 273.5 |
Property crime rate in 2010
| Sarasota: | 571.2 |
| U.S. Average: | 276.4 |
Property crime rate in 2009
| Sarasota: | 553.7 |
| U.S. Average: | 285.6 |
Property crime rate in 2008
| Sarasota: | 626.1 |
| U.S. Average: | 302.2 |
Property crime rate in 2007
| Sarasota: | 362.6 |
| U.S. Average: | 309.2 |
Property crime rate in 2006
| Sarasota: | 363.5 |
| U.S. Average: | 317.3 |
Property crime rate in 2005
| Sarasota: | 350.6 |
| U.S. Average: | 322.3 |


Full-time law enforcement employees in 2021, including police officers: 230 (178 officers - 148 male; 30 female).
| Officers per 1,000 residents here: | 2.99 |
| Florida average: | 2.33 |
Full-time law enforcement employees in 2020, including police officers: 224 (175 officers - 150 male; 25 female).
| Officers per 1,000 residents here: | 2.97 |
| Florida average: | 2.26 |
Full-time law enforcement employees in 2019, including police officers: 235 (175 officers - 148 male; 27 female).
| Officers per 1,000 residents here: | 2.99 |
| Florida average: | 2.40 |
Full-time law enforcement employees in 2017, including police officers: 208 (159 officers - 131 male; 28 female).
| Officers per 1,000 residents here: | 2.77 |
| Florida average: | 2.41 |
Full-time law enforcement employees in 2016, including police officers: 209 (163 officers - 134 male; 29 female).
| Officers per 1,000 residents here: | 2.92 |
| Florida average: | 2.36 |
Full-time law enforcement employees in 2015, including police officers: 197 (156 officers - 134 male; 22 female).
| Officers per 1,000 residents here: | 2.85 |
| Florida average: | 2.39 |
Full-time law enforcement employees in 2014, including police officers: 197 (156 officers - 134 male; 22 female).
| Officers per 1,000 residents here: | 2.91 |
| Florida average: | 2.29 |
Full-time law enforcement employees in 2012, including police officers: 214 (174 officers - 149 male; 25 female).
| Officers per 1,000 residents here: | 3.28 |
| Florida average: | 2.45 |
Full-time law enforcement employees in 2011, including police officers: 222 (172 officers - 150 male; 22 female).
| Officers per 1,000 residents here: | 3.27 |
| Florida average: | 2.35 |
Full-time law enforcement employees in 2010, including police officers: 227 (174 officers - 149 male; 25 female).
| Officers per 1,000 residents here: | 3.35 |
| Florida average: | 2.47 |
Full-time law enforcement employees in 2009, including police officers: 233 (176 officers - 152 male; 24 female).
| Officers per 1,000 residents here: | 3.36 |
| Florida average: | 2.50 |
Full-time law enforcement employees in 2008, including police officers: 230 (182 officers - 158 male; 24 female).
| Officers per 1,000 residents here: | 3.51 |
| Florida average: | 2.43 |
Full-time law enforcement employees in 2007, including police officers: 247 (192 officers - 165 male; 27 female).
| Officers per 1,000 residents here: | 3.62 |
| Florida average: | 2.45 |
Full-time law enforcement employees in 2006, including police officers: 259 (193 officers - 166 male; 27 female).
| Officers per 1,000 residents here: | 3.53 |
| Florida average: | 2.54 |
Full-time law enforcement employees in 2005, including police officers: 253 (187 officers - 161 male; 26 female).
| Officers per 1,000 residents here: | 3.43 |
| Florida average: | 2.40 |
Full-time law enforcement employees in 2004, including police officers: 254 (188 officers - 163 male; 25 female).
| Officers per 1,000 residents here: | 3.45 |
| Florida average: | 2.53 |
Full-time law enforcement employees in 2003, including police officers: 266 (197 officers - 171 male; 26 female).
| Officers per 1,000 residents here: | 3.63 |
| Florida average: | 2.55 |


