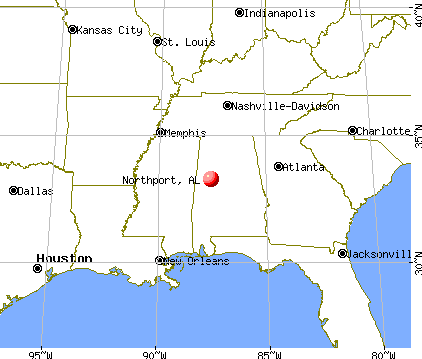
Northport, Alabama
Submit your own pictures of this city and show them to the world
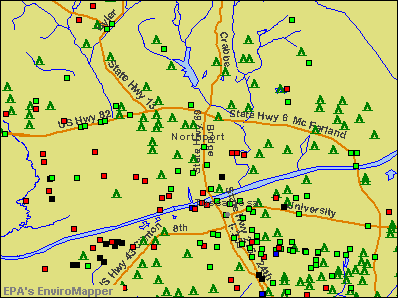
- OSM Map
- General Map
- Google Map
- MSN Map
Population change since 2000: +59.5%
| Males: 14,309 | |
| Females: 16,695 |
| Median resident age: | 33.8 years |
| Alabama median age: | 39.6 years |
Zip codes: 35401, 35406, 35473, 35475, 35476.
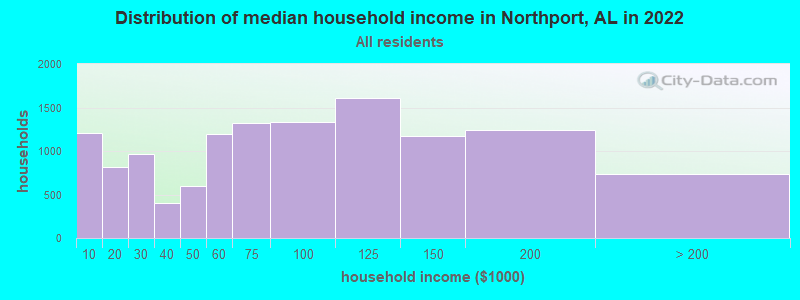
Northport Zip Code Map| Northport: | $71,643 |
| AL: | $59,674 |
Estimated per capita income in 2022: $35,269 (it was $20,163 in 2000)
Northport city income, earnings, and wages data
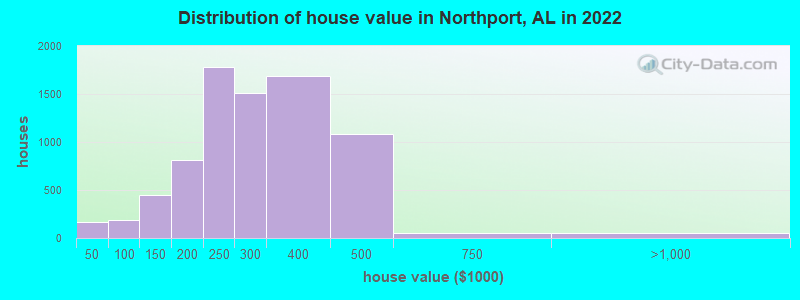
Estimated median house or condo value in 2022: $280,790 (it was $108,400 in 2000)
| Northport: | $280,790 |
| AL: | $200,900 |
Mean prices in 2022: all housing units: $274,542; detached houses: $302,362; townhouses or other attached units: $210,995; in 2-unit structures: $86,470; in 3-to-4-unit structures: $67,951; in 5-or-more-unit structures: $151,988; mobile homes: $75,047; occupied boats, rvs, vans, etc.: $32,477
Median gross rent in 2022: $907.
(4.7% for White Non-Hispanic residents, 40.1% for Black residents, 15.7% for Hispanic or Latino residents, 100.0% for other race residents, 5.3% for two or more races residents)
Detailed information about poverty and poor residents in Northport, AL

Compare current foreclosures in Northport, AL:
| Photo | Address | Area | Beds / Baths | Price | Details |
|---|---|---|---|---|---|

|
#1
Koffman Ranch Rd
Northport, AL 35475
|
1,372 sq. feet
|
2 baths 3 beds |
$204,900
|
show details |

|
#2
Crosshill Ln
Northport, AL 35473
|
1,776 sq. feet
|
2 baths 3 beds |
show details | |

|
#3
Rolling Meadows Cir
Northport, AL 35473
|
3,692 sq. feet
|
3 baths 5 beds |
show details | |

|
#4
Elam Dr
Northport, AL 35475
|
3,328 sq. feet
|
2 baths 4 beds |
show details | |

|
#5
Sunrise Cir
Northport, AL 35473
|
1,150 sq. feet
|
2 baths 3 beds |
show details | |

|
#6
Sleepy Valley Rd
Northport, AL 35475
|
3,222 sq. feet
|
2 baths 5 beds |
show details | |

|
#7
Clearbrook Dr
Northport, AL 35473
|
1,604 sq. feet
|
1 baths 3 beds |
show details | |

|
#8
Smithfield Cir
Northport, AL 35473
|
1,447 sq. feet
|
1 baths 3 beds |
show details | |

|
#9
44th Ave
Northport, AL 35476
|
1,418 sq. feet
|
1 baths 3 beds |
show details | |

|
#10
Blackstone Ln
Northport, AL 35473
|
1,470 sq. feet
|
1 baths 3 beds |
show details |
| Photo | Address | Area | Beds / Baths | Price | Details |
|---|---|---|---|---|---|

|
#11
Shady Ln
Northport, AL 35475
|
1,683 sq. feet
|
1 baths 3 beds |
show details | |

|
#12
Stewart Parc Dr
Northport, AL 35473
|
1,397 sq. feet
|
1 baths 3 beds |
show details | |

|
#13
Troy Trimm Rd
Northport, AL 35475
|
1,524 sq. feet
|
1 baths 3 beds |
show details | |

|
#14
Grandbrook Dr
Northport, AL 35473
|
1,752 sq. feet
|
1 baths 3 beds |
show details | |

|
#15
Wisteria Ln
Northport, AL 35473
|
1,790 sq. feet
|
1 baths 3 beds |
show details | |

|
#16
Ross Cir
Northport, AL 35475
|
1,420 sq. feet
|
1 baths 3 beds |
show details | |

|
#17
Northside Rd
Northport, AL 35475
|
2,127 sq. feet
|
1 baths 3 beds |
show details | |

|
#18
Stormy Ln
Northport, AL 35473
|
1,624 sq. feet
|
1 baths 3 beds |
show details | |

|
#19
Belle Meade Way
Northport, AL 35475
|
2,113 sq. feet
|
2 baths 3 beds |
show details | |

|
#20
Deerfield Dr Apt 2
Northport, AL 35473
|
8,008 sq. feet
|
1 baths - beds |
show details |
| Photo | Address | Area | Beds / Baths | Price | Details |
|---|---|---|---|---|---|

|
#21
Dalewood St
Northport, AL 35475
|
1,351 sq. feet
|
1 baths 3 beds |
show details | |

|
#22
Cambridge Dr
Northport, AL 35473
|
1,506 sq. feet
|
1 baths 3 beds |
show details | |

|
#23
Edgeworth Dr E
Northport, AL 35473
|
1,792 sq. feet
|
1 baths 3 beds |
show details | |

|
#24
Autumn Leaves Trl
Northport, AL 35473
|
1,933 sq. feet
|
2 baths 4 beds |
show details | |

|
#25
Elam Dr
Northport, AL 35475
|
3,887 sq. feet
|
2 baths 4 beds |
show details | |

|
#26
Mayberry Landing Dr
Northport, AL 35473
|
1,825 sq. feet
|
1 baths 3 beds |
show details | |

|
#27
Northwind Cir
Northport, AL 35475
|
1,413 sq. feet
|
1 baths 3 beds |
show details | |

|
#28
Mayfield Way
Northport, AL 35476
|
1,221 sq. feet
|
1 baths 3 beds |
show details | |

|
#29
Tom Montgomery Rd
Northport, AL 35473
|
1,894 sq. feet
|
1 baths 3 beds |
show details | |

|
#30
37th Ave
Northport, AL 35476
|
1,285 sq. feet
|
1 baths 3 beds |
show details |
| Photo | Address | Area | Beds / Baths | Price | Details |
|---|---|---|---|---|---|

|
#31
Edgebrook St
Northport, AL 35475
|
1,487 sq. feet
|
1 baths 3 beds |
show details | |

|
#32
Allums Ave
Northport, AL 35473
|
1,230 sq. feet
|
1 baths 3 beds |
show details | |

|
#33
Knoll Rd
Northport, AL 35475
|
2,754 sq. feet
|
2 baths 4 beds |
show details | |

|
#34
Saint James Ct
Northport, AL 35475
|
2,272 sq. feet
|
2 baths 4 beds |
show details | |

|
#35
Union Chapel Rd
Northport, AL 35473
|
1,818 sq. feet
|
1 baths 3 beds |
show details | |

|
#36
Concord Pl
Northport, AL 35473
|
1,428 sq. feet
|
1 baths 3 beds |
show details | |

|
#37
Blackstone Ln
Northport, AL 35473
|
1,430 sq. feet
|
1 baths 3 beds |
show details | |

|
#38
Buckhead Dr
Northport, AL 35473
|
1,708 sq. feet
|
1 baths 3 beds |
show details | |

|
#39
Cambridge Dr
Northport, AL 35473
|
1,414 sq. feet
|
1 baths 3 beds |
show details | |

|
#40
Sunrise Cir
Northport, AL 35473
|
1,206 sq. feet
|
1 baths 3 beds |
show details |
| Photo | Address | Area | Beds / Baths | Price | Details |
|---|---|---|---|---|---|

|
#41
Hibiscus Ln
Northport, AL 35473
|
1,878 sq. feet
|
1 baths 3 beds |
show details | |

|
#42
Chestertown Trce
Northport, AL 35475
|
1,598 sq. feet
|
1 baths 3 beds |
show details | |

|
#43
Lauren St
Northport, AL 35475
|
1,713 sq. feet
|
1 baths 3 beds |
show details | |

|
#44
Madison Cir
Northport, AL 35475
|
1,390 sq. feet
|
1 baths 3 beds |
show details | |

|
#45
N River Ln
Northport, AL 35475
|
1,318 sq. feet
|
1 baths 3 beds |
show details | |

|
#46
Eagle Cove Ln
Northport, AL 35473
|
2,590 sq. feet
|
2 baths 3 beds |
show details | |

|
#47
Harper Rd
Northport, AL 35473
|
1,680 sq. feet
|
2 baths 4 beds |
show details | |

|
#48
Glenfair Cir
Northport, AL 35475
|
2,639 sq. feet
|
2 baths 4 beds |
show details | |

|
#49
Grandbrook Dr
Northport, AL 35473
|
2,037 sq. feet
|
2 baths 4 beds |
show details | |

|
Check over 1 million property listings on Foreclosure.com!
|
browse all offers | |||


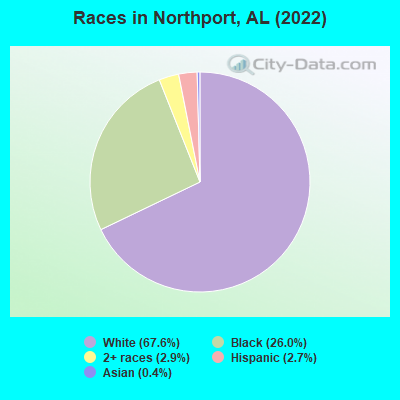
- 21,21667.6%White alone
- 8,17226.0%Black alone
- 9182.9%Two or more races
- 8592.7%Hispanic
- 1360.4%Asian alone
- 240.08%Native Hawaiian and Other
Pacific Islander alone - 100.03%American Indian alone
According to our research of Alabama and other state lists, there were 29 registered sex offenders living in Northport, Alabama as of May 21, 2024.
The ratio of all residents to sex offenders in Northport is 850 to 1.
The ratio of registered sex offenders to all residents in this city is lower than the state average.
Type |
2009 |
2010 |
2011 |
2012 |
2013 |
2014 |
2015 |
2016 |
2017 |
2018 |
2019 |
2020 |
2021 |
2022 |
|---|---|---|---|---|---|---|---|---|---|---|---|---|---|---|
| Murders (per 100,000) | 2 (8.5) | 2 (8.6) | 3 (12.8) | 2 (8.4) | 0 (0.0) | 0 (0.0) | 1 (4.0) | 1 (4.0) | 0 (0.0) | 1 (3.9) | 0 (0.0) | 0 (0.0) | 2 (7.6) | 0 (0.0) |
| Rapes (per 100,000) | 7 (29.8) | 8 (34.3) | 8 (34.1) | 3 (12.6) | 20 (82.3) | 13 (52.5) | 19 (75.9) | 16 (63.9) | 5 (19.7) | 19 (74.9) | 8 (30.7) | 7 (26.5) | 10 (38.0) | 5 (16.2) |
| Robberies (per 100,000) | 29 (123.4) | 41 (175.7) | 32 (136.5) | 24 (101.1) | 32 (131.6) | 30 (121.1) | 25 (99.9) | 22 (87.8) | 14 (55.3) | 20 (78.9) | 9 (34.6) | 14 (53.1) | 8 (30.4) | 7 (22.7) |
| Assaults (per 100,000) | 92 (391.5) | 120 (514.4) | 110 (469.2) | 106 (446.5) | 62 (255.1) | 47 (189.8) | 52 (207.7) | 43 (171.7) | 28 (110.5) | 49 (193.3) | 33 (126.7) | 37 (140.3) | 75 (285.1) | 98 (317.1) |
| Burglaries (per 100,000) | 272 (1,158) | 273 (1,170) | 243 (1,037) | 222 (935.1) | 162 (666.4) | 218 (880.3) | 167 (667.1) | 128 (511.1) | 82 (323.6) | 123 (485.1) | 71 (272.6) | 39 (147.9) | 67 (254.7) | 70 (226.5) |
| Thefts (per 100,000) | 856 (3,643) | 649 (2,782) | 579 (2,470) | 565 (2,380) | 525 (2,160) | 745 (3,008) | 715 (2,856) | 732 (2,923) | 556 (2,194) | 610 (2,406) | 352 (1,352) | 321 (1,217) | 347 (1,319) | 403 (1,304) |
| Auto thefts (per 100,000) | 60 (255.3) | 48 (205.7) | 64 (273.0) | 34 (143.2) | 41 (168.7) | 29 (117.1) | 28 (111.9) | 18 (71.9) | 17 (67.1) | 39 (153.8) | 17 (65.3) | 36 (136.5) | 38 (144.4) | 35 (113.3) |
| Arson (per 100,000) | 0 (0.0) | 1 (4.3) | 3 (12.8) | 2 (8.4) | 3 (12.3) | 5 (20.2) | 4 (16.0) | 4 (16.0) | 2 (7.9) | 4 (15.8) | 0 (0.0) | 0 (0.0) | 0 (0.0) | 3 (9.7) |
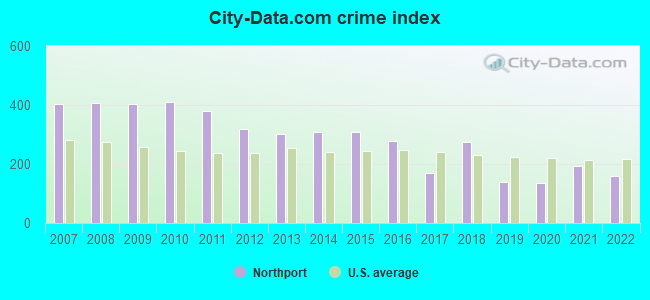
| City-Data.com crime index | 403.4 | 409.8 | 380.9 | 318.7 | 302.9 | 307.6 | 310.1 | 278.2 | 170.3 | 272.7 | 138.7 | 135.2 | 193.9 | 160.3 |
The City-Data.com crime index weighs serious crimes and violent crimes more heavily. Higher means more crime, U.S. average is 246.1. It adjusts for the number of visitors and daily workers commuting into cities.
Crime rate in Northport detailed stats: murders, rapes, robberies, assaults, burglaries, thefts, arson
Full-time law enforcement employees in 2021, including police officers: 68 (51 officers - 47 male; 4 female).
| Officers per 1,000 residents here: | 1.94 |
| Alabama average: | 2.40 |
 Recent articles from our blog. Our writers, many of them Ph.D. graduates or candidates, create easy-to-read articles on a wide variety of topics.


 | Huntsville/Madison Development News (6689 replies) |
| July 1, 2023 City Estimates are out (4 replies) |
| UPDATED: New and Upcoming Projects. (3767 replies) |
| 2020 City/County Census results (92 replies) |
| Mobile Area Populations (74 replies) |
| Birmingham Census 2020 Results (58 replies) |
Latest news from Northport, AL collected exclusively by city-data.com from local newspapers, TV, and radio stations
Ancestries: American (21.5%), English (10.8%), German (3.3%), Scotch-Irish (3.2%), Irish (2.1%), European (1.6%).
Current Local Time: CST time zone
Incorporated in 1871
Elevation: 200 feet
Land area: 14.6 square miles.
Population density: 2,119 people per square mile (low).
914 residents are foreign born (1.6% Latin America, 0.5% Europe, 0.4% Asia).
| This city: | 2.9% |
| Alabama: | 3.5% |
Median real estate property taxes paid for housing units with mortgages in 2022: $881 (0.3%)
Median real estate property taxes paid for housing units with no mortgage in 2022: $872 (0.3%)
Nearest city with pop. 50,000+: Tuscaloosa, AL  (4.7 miles , pop. 77,906).
Nearest city with pop. 200,000+: Birmingham, AL (48.8 miles , pop. 242,820).
Nearest city with pop. 1,000,000+: Houston, TX (518.8 miles , pop. 1,953,631).
Nearest cities:
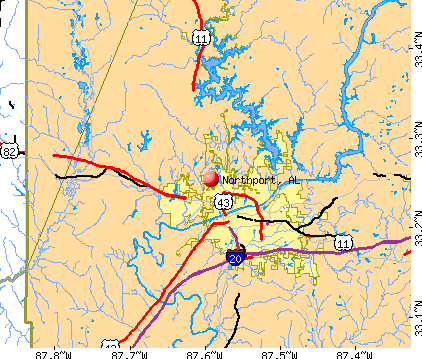
), ), ), ), ), ), )Latitude: 33.25 N, Longitude: 87.59 W
Daytime population change due to commuting: -2,465 (-7.8%)
Workers who live and work in this city: 3,111 (20.5%)
Area code commonly used in this area: 205
Northport, Alabama accommodation & food services, waste management - Economy and Business Data
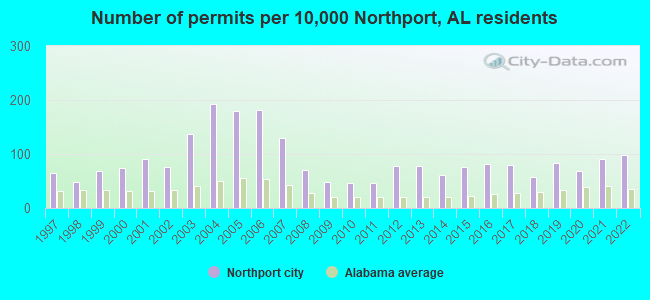
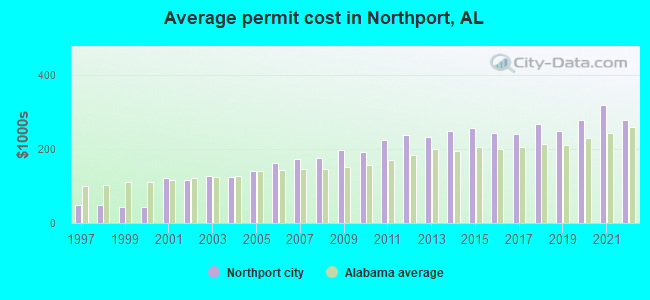
Single-family new house construction building permits:
- 2022: 190 buildings, average cost: $278,200
- 2021: 175 buildings, average cost: $318,000
- 2020: 135 buildings, average cost: $278,200
- 2019: 164 buildings, average cost: $249,300
- 2018: 112 buildings, average cost: $267,100
- 2017: 153 buildings, average cost: $241,200
- 2016: 160 buildings, average cost: $241,600
- 2015: 147 buildings, average cost: $257,000
- 2014: 118 buildings, average cost: $248,500
- 2013: 152 buildings, average cost: $230,900
- 2012: 151 buildings, average cost: $236,300
- 2011: 91 buildings, average cost: $223,800
- 2010: 91 buildings, average cost: $191,300
- 2009: 95 buildings, average cost: $198,100
- 2008: 137 buildings, average cost: $175,600
- 2007: 250 buildings, average cost: $172,600
- 2006: 354 buildings, average cost: $162,600
- 2005: 348 buildings, average cost: $140,800
- 2004: 374 buildings, average cost: $125,300
- 2003: 266 buildings, average cost: $126,100
- 2002: 148 buildings, average cost: $115,900
- 2001: 174 buildings, average cost: $119,800
- 2000: 146 buildings, average cost: $42,000
- 1999: 134 buildings, average cost: $42,700
- 1998: 93 buildings, average cost: $49,300
- 1997: 125 buildings, average cost: $48,700
| Here: | 1.9% |
| Alabama: | 2.6% |
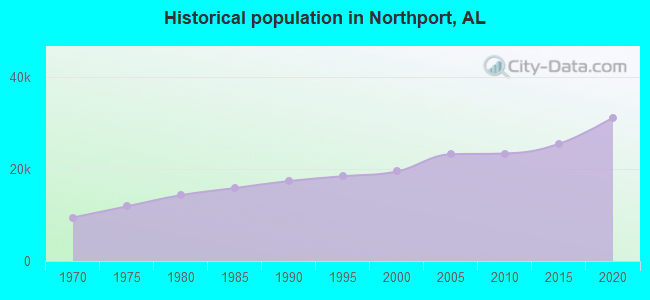
Population change in the 1990s: +1,910 (+10.9%).

- Health care (16.4%)
- Educational services (14.5%)
- Construction (5.4%)
- Accommodation & food services (5.2%)
- Professional, scientific, technical services (5.0%)
- Plastics & rubber products (3.6%)
- Public administration (3.3%)
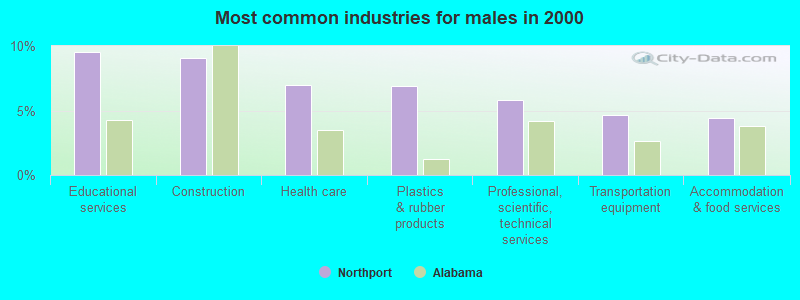
- Educational services (9.6%)
- Construction (9.1%)
- Health care (7.0%)
- Plastics & rubber products (6.9%)
- Professional, scientific, technical services (5.8%)
- Transportation equipment (4.6%)
- Accommodation & food services (4.4%)
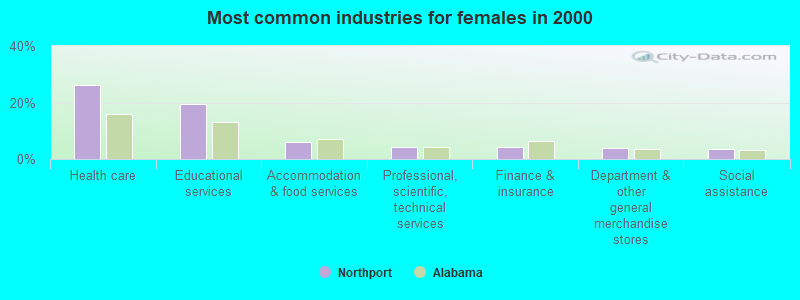
- Health care (26.0%)
- Educational services (19.6%)
- Accommodation & food services (6.0%)
- Professional, scientific, technical services (4.2%)
- Finance & insurance (4.1%)
- Department & other general merchandise stores (3.8%)
- Social assistance (3.4%)
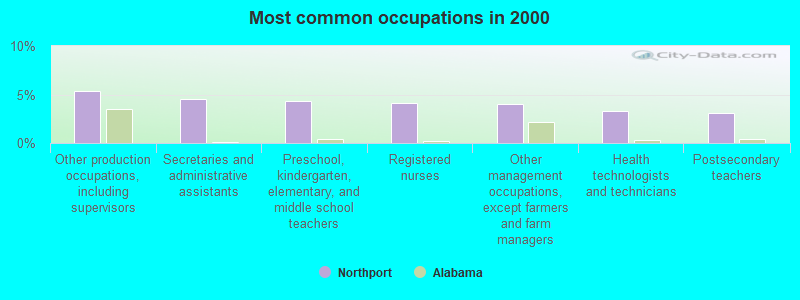
- Other production occupations, including supervisors (5.3%)
- Secretaries and administrative assistants (4.5%)
- Preschool, kindergarten, elementary, and middle school teachers (4.4%)
- Registered nurses (4.1%)
- Other management occupations, except farmers and farm managers (4.0%)
- Health technologists and technicians (3.3%)
- Postsecondary teachers (3.1%)

- Other production occupations, including supervisors (8.9%)
- Other management occupations, except farmers and farm managers (5.0%)
- Driver/sales workers and truck drivers (4.2%)
- Engineers (3.8%)
- Other sales and related occupations, including supervisors (3.8%)
- Sales representatives, services, wholesale and manufacturing (3.7%)
- Computer specialists (3.1%)
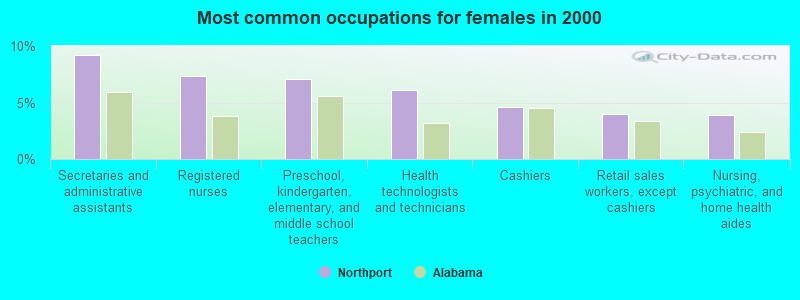
- Secretaries and administrative assistants (9.2%)
- Registered nurses (7.3%)
- Preschool, kindergarten, elementary, and middle school teachers (7.0%)
- Health technologists and technicians (6.1%)
- Cashiers (4.6%)
- Retail sales workers, except cashiers (4.0%)
- Nursing, psychiatric, and home health aides (3.9%)
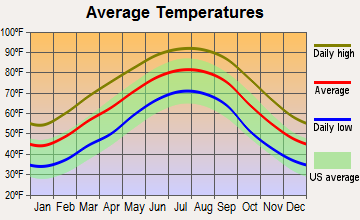
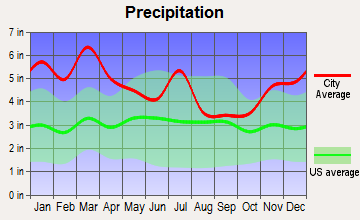
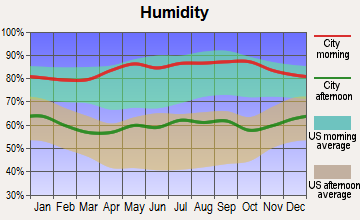
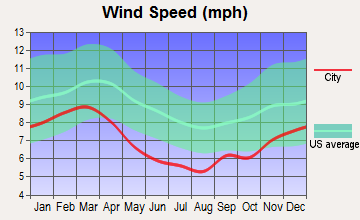
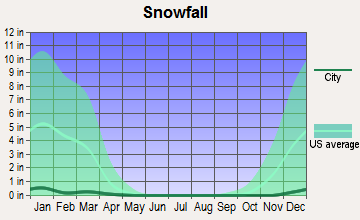
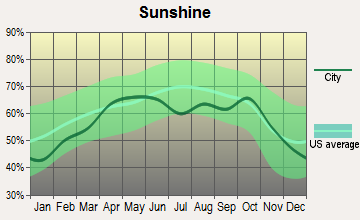
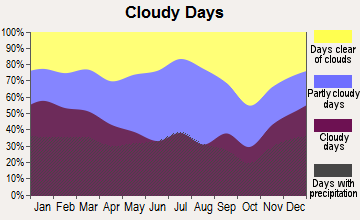
Average climate in Northport, Alabama
Based on data reported by over 4,000 weather stations
|
|

(lower is better)
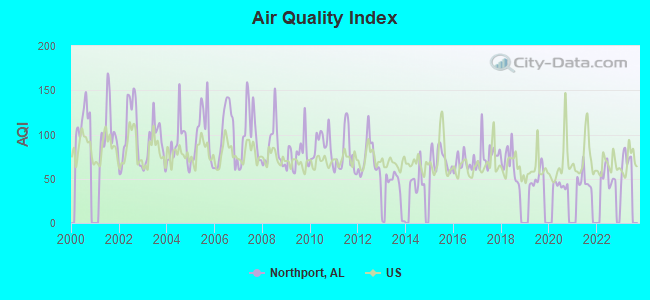
Air Quality Index (AQI) level in 2022 was 53.7. This is better than average.
| City: | 53.7 |
| U.S.: | 72.6 |
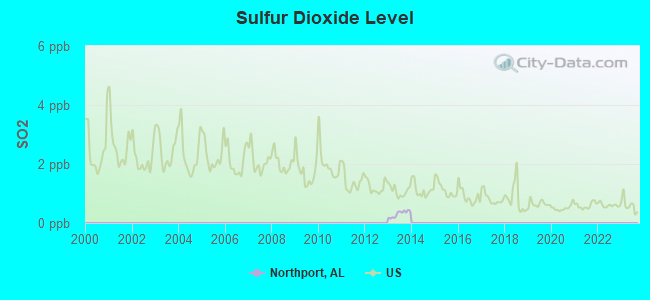
Sulfur Dioxide (SO2) [ppb] level in 2013 was 0.310. This is significantly better than average. Closest monitor was 4.0 miles away from the city center.
| City: | 0.310 |
| U.S.: | 1.515 |
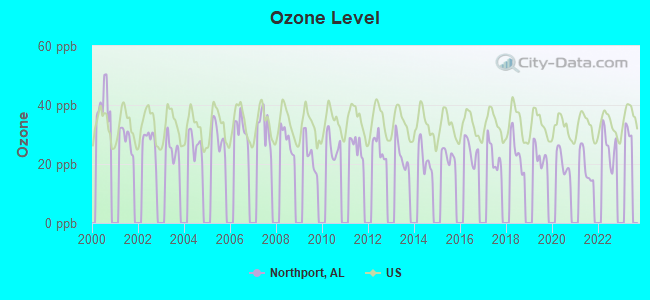
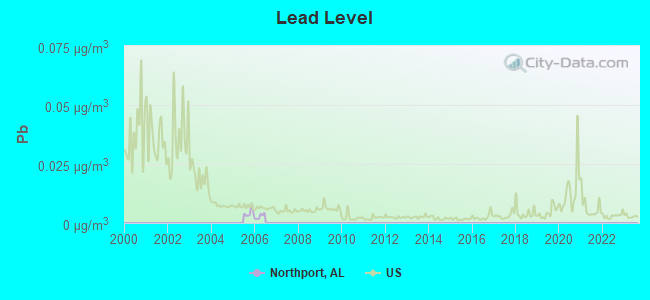
Ozone [ppb] level in 2022 was 26.2. This is better than average. Closest monitor was 8.3 miles away from the city center.
| City: | 26.2 |
| U.S.: | 33.3 |
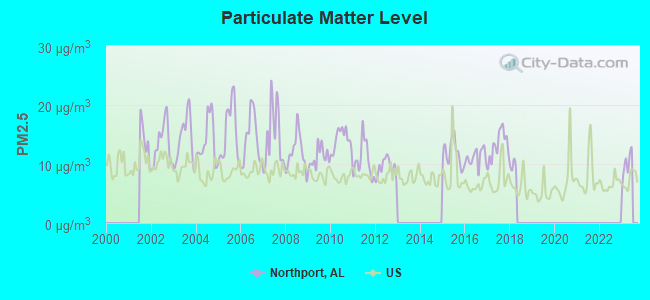
Particulate Matter (PM2.5) [µg/m3] level in 2017 was 13.2. This is significantly worse than average. Closest monitor was 7.7 miles away from the city center.
| City: | 13.2 |
| U.S.: | 8.1 |
Tornado activity:
Northport-area historical tornado activity is near Alabama state average. It is 112% greater than the overall U.S. average.
On 3/3/1966, a category F5 (max. wind speeds 261-318 mph) tornado 12.8 miles away from the Northport city center killed 58 people and injured 518 people and caused between $5,000,000 and $50,000,000 in damages.
On 4/8/1998, a category F5 tornado 18.1 miles away from the city center killed 32 people and injured 259 people and caused $200 million in damages.
Earthquake activity:
Northport-area historical earthquake activity is significantly above Alabama state average. It is 149% greater than the overall U.S. average.On 1/18/1999 at 07:00:53, a magnitude 4.8 (4.8 MB, 4.0 LG, Depth: 0.6 mi, Class: Light, Intensity: IV - V) earthquake occurred 22.1 miles away from Northport center
On 6/24/1975 at 11:11:36, a magnitude 4.5 (4.5 MB) earthquake occurred 35.2 miles away from the city center
On 4/29/2003 at 08:59:39, a magnitude 4.9 (4.4 MB, 4.6 MW, 4.9 LG) earthquake occurred 141.7 miles away from Northport center
On 10/24/1997 at 08:35:17, a magnitude 4.9 (4.8 MB, 4.2 MS, 4.9 LG, Depth: 6.2 mi) earthquake occurred 148.6 miles away from the city center
On 11/7/2004 at 11:20:21, a magnitude 4.3 (4.3 MW, Depth: 3.1 mi) earthquake occurred 46.3 miles away from the city center
On 4/29/2003 at 08:59:39, a magnitude 4.6 (4.6 MW, Depth: 12.3 mi) earthquake occurred 141.6 miles away from Northport center
Magnitude types: regional Lg-wave magnitude (LG), body-wave magnitude (MB), surface-wave magnitude (MS), moment magnitude (MW)
Natural disasters:
The number of natural disasters in Tuscaloosa County (23) is greater than the US average (15).Major Disasters (Presidential) Declared: 16
Emergencies Declared: 5
Causes of natural disasters: Storms: 12, Floods: 10, Tornadoes: 10, Hurricanes: 5, Winds: 4, Drought: 1, Snowfall: 1, Winter Storm: 1, Other: 1 (Note: some incidents may be assigned to more than one category).

Hospitals and medical centers in Northport:
- NORTHPORT MEDICAL CENTER (2700 HOSPITAL DRIVE)
- SOUTHERNCARE TUSCALOOSA (3835 WATERMELON RD)
- FOREST MANOR INC (2215 32ND STREET)
- GLEN HAVEN HEALTH AND REHABILITATION, LLC (2201 32ND STREET)
- HUNTER CREEK HEALTH AND REHABILITATION, LLC (600 34TH ST)
- S D ALLEN INTERMEDIATE CARE (6901 5TH ST OLD COLUMBUS HWY)
- NORTHPORT DIALYSIS (2401 HOSPITAL DRIVE)
- RRC NORTHRIDGE (4400 WATERMELON ROAD)
College/University in Northport:
Colleges/universities with over 2000 students nearest to Northport:
- The University of Alabama (about 4 miles; Tuscaloosa, AL; Full-time enrollment: 30,931)
- Shelton State Community College (about 10 miles; Tuscaloosa, AL; FT enrollment: 4,106)
- Lawson State Community College-Birmingham Campus (about 43 miles; Birmingham, AL; FT enrollment: 2,695)
- University of Montevallo (about 44 miles; Montevallo, AL; FT enrollment: 2,826)
- Bevill State Community College (about 45 miles; Jasper, AL; FT enrollment: 2,970)
- Virginia College-Birmingham (about 48 miles; Birmingham, AL; FT enrollment: 8,167)
- University of Alabama at Birmingham (about 49 miles; Birmingham, AL; FT enrollment: 14,853)
Public high schools in Northport:
- NORTHSIDE HIGH SCH (Students: 429, Location: 19230 NORTHSIDE PARKWAY, Grades: 9-12)
- TUSCALOOSA CO HIGH SCH (Students: 1, Location: 12500 WILDCAT DR, Grades: 9-12)
- SPRAYBERRY REG ED CTR (Location: 1324 RICE MINE RD, Grades: PK-12)
Biggest public elementary/middle schools in Northport:
- WALKER ELEM SCH (Students: 663, Location: 13051 NORTHSIDE RD, Grades: KG-5)
- ECHOLS MIDDLE SCH (Students: 564, Location: 2701 ECHOLS AVE, Grades: 6-8)
- NORTHPORT ELEMENTARY SCHOOL (Students: 461, Location: 13695 FRANKIE THOMAS TRACE, Grades: PK-2)
- HUNTINGTON PLACE ELEM SCH (Students: 453, Location: 11601 HUNTINGTON PL, Grades: KG-5)
- FAUCETT-VESTAVIA ELEM SCH (Students: 450, Location: 1150 VESTAVIA CIRCLE, Grades: KG-5)
- MATTHEWS ELEM SCH (Students: 420, Location: 1225 RICE MINE ROAD, Grades: KG-5)
- COLLINS-RIVERSIDE MIDDLE SCH (Students: 385, Location: 1400 3RD ST, Grades: 6-8)
- NORTHSIDE MIDDLE SCH (Students: 349, Location: 19130 NORTHSIDE PARKWAY, Grades: 6-8)
- CRESTMONT ELEM SCH (Students: 319, Location: 2400 34TH AVE, Grades: PK-5)
- FLATWOODS ELEM SCH (Students: 312, Location: 3800 66TH AVE, Grades: PK-5)
User-submitted facts and corrections:
- Add to churches: Indian Lake Baptist Church
Points of interest:
Notable locations in Northport: Wildcat Stadium (A), Northport Sewage Treatment Plant (B), Alabama State Docks Tuscaloosa-Northport Terminal (C), Camp Tuscoba (D), Georgine Clarke Building (E), City of Northport George Rose Fire Station (F), West Circle Community Center (G), Northport Library (H), Northport Community Center (I), Kentuck Museum (J), Northport Heritage Museum (K), Northport Fire Rescue Station 1 (L), Northport Fire Rescue Station 3 (M), Northport Fire Rescue Station 2 (N), Northport Fire Rescue Station 4 (O). Display/hide their locations on the map
Shopping Centers: Northwood Shopping Center (1), Northgate Shopping Center (2), Northbrook Plaza Shopping Center (3), Northport Corners Shopping Center (4), Northcreek Plaza Shopping Center (5), Essex Square Marketplace Shopping Center (6), Buford Plaza Shopping Center (7). Display/hide their locations on the map
Churches in Northport include: Rices Valley Church (A), Jennings Chapel United Methodist Church (B), Porters Saint Paul Christian Methodist Episcopal Church (C), Mount Galilee Baptist Church (D), Morning Star Church (E), Solid Rock Primitive Baptist Church (F), Pinehaven Church (G), Northwood Hills Baptist Church (H), Northport First United Methodist Church (I). Display/hide their locations on the map
Cemeteries: Shirley Cemetery (1), Williamson Cemetery (2), Taylor Cemetery (3), Sunset Memorial Garden (4), Rices Hill Cemetery (5), Jennings Chapel Cemetery (6), Flatwoods Cemetery (7). Display/hide their locations on the map
Reservoirs: William Bacon Oliver Lake (A), Camp Tuscoba Lake (B), Indian Lake (C), Partlow Lake Upper (D), Partlow Lake Lower (E), Northwood Lake (F). Display/hide their locations on the map
Creek: Twomile Creek (A). Display/hide its location on the map
Parks in Northport include: Northport Historic District (1), Kentuck Park (2), Northport Main Street Park (3), Northwood Lake Park (4). Display/hide their locations on the map
Tourist attractions: Kentuck Art Center & Museum (503 Main Avenue) (1), Clements House (Museums; 1802 20th Avenue) (2), Playhouse Too (Amusement & Theme Parks; 935 McFarland Boulevard) (3), Cruise2Enjoy (15220 Westwind Drive) (4). Display/hide their approximate locations on the map
Hotels: Econo Lodge Inn & Suites (1930 McFarland Boulevard) (1), Budget Inn (2600 McFarland Boulevard) (2), Best Western Catalina Inn (2015 McFarland Boulevard) (3). Display/hide their approximate locations on the map
Court: Northport City - Municipal Court (1910 Lurleen B Wallace Boulevard) (1). Display/hide its approximate location on the map
Birthplace of: Frank Lary - Baseball player, Al Lary - Baseball player.
Drinking water stations with addresses in Northport and their reported violations in the past:
VERNON WATER WORKS (Address: 800 ENERGY CENTER BOULEVARD APT 2314 , Population served: 4,500, Groundwater):Past monitoring violations:
- One minor monitoring violation
Drinking water stations with addresses in Northport that have no violations reported:
| This city: | 2.4 people |
| Alabama: | 2.5 people |
| This city: | 64.3% |
| Whole state: | 67.8% |
| This city: | 4.5% |
| Whole state: | 4.7% |
Likely homosexual households (counted as self-reported same-sex unmarried-partner households)
- Lesbian couples: 0.3% of all households
- Gay men: 0.2% of all households
People in group quarters in Northport in 2000:
- 465 people in nursing homes
- 28 people in hospitals/wards and hospices for chronically ill
- 28 people in other hospitals or wards for chronically ill
- 28 people in other noninstitutional group quarters
- 7 people in other nonhousehold living situations
Banks with most branches in Northport (2011 data):
- Wells Fargo Bank, National Association: Northport Branch at 2200 Mcfarland Boulevard, branch established on 1985/12/05. Info updated 2011/04/05: Bank assets: $1,161,490.0 mil, Deposits: $905,653.0 mil, headquarters in Sioux Falls, SD, positive income, 6395 total offices, Holding Company: Wells Fargo & Company
- First State Bank of the South, Inc.: Northport Branch at 5520 Mcfarland Boulevard, branch established on 2008/01/31. Info updated 2011/02/24: Bank assets: $97.1 mil, Deposits: $80.6 mil, headquarters in Sulligent, AL, positive income, 5 total offices, Holding Company: First State Holding Corp.
- Bryant Bank: Northport Branch at 2001 Lurleen Wallace Boulevard, branch established on 2008/01/18. Info updated 2011/02/24: Bank assets: $951.1 mil, Deposits: $781.0 mil, headquarters in Tuscaloosa, AL, positive income, Commercial Lending Specialization, 13 total offices
- Capstone Bank: Northport Branch at 2000 Lurleen B. Wallace Boulevard, branch established on 2010/03/22. Info updated 2011/03/21: Bank assets: $382.0 mil, Deposits: $327.4 mil, headquarters in Tuscaloosa, AL, positive income, Commercial Lending Specialization, 8 total offices, Holding Company: Capstone Bancshares, Inc.
- PNC Bank, National Association: Northport Branch at 3076 Mcfarland Boulevard, branch established on 1956/03/19. Info updated 2012/03/20: Bank assets: $263,309.6 mil, Deposits: $197,343.0 mil, headquarters in Wilmington, DE, positive income, Commercial Lending Specialization, 3085 total offices, Holding Company: Pnc Financial Services Group, Inc., The
- Compass Bank: Northport Branch at 1400 Mcfarland Boulevard, branch established on 1992/12/07. Info updated 2011/02/24: Bank assets: $63,107.0 mil, Deposits: $46,232.4 mil, headquarters in Birmingham, AL, negative income in the last year, Commercial Lending Specialization, 720 total offices, Holding Company: Banco Bilbao Vizcaya Argentaria, S.A.
- Regions Bank: Northport Branch at 2001 Lurlene Wallace Boulevard, branch established on 1968/07/22. Info updated 2011/02/24: Bank assets: $123,368.2 mil, Deposits: $98,301.3 mil, headquarters in Birmingham, AL, positive income, Commercial Lending Specialization, 1778 total offices, Holding Company: Regions Financial Corporation
- Woodforest National Bank: Northport Branch at 5710 Mcfarland Blvd, branch established on 2009/05/16. Info updated 2011/05/10: Bank assets: $3,488.9 mil, Deposits: $3,097.6 mil, headquarters in Houston, TX, positive income, Commercial Lending Specialization, 766 total offices, Holding Company: Woodforest Financial Group Employee Stock Ownership Plan (With 401(K) Provisions)
- Branch Banking and Trust Company: Northport Branch at 120 Mcfarland Blvd, branch established on 2001/04/30. Info updated 2010/03/29: Bank assets: $168,867.6 mil, Deposits: $127,549.5 mil, headquarters in Winston Salem, NC, positive income, Commercial Lending Specialization, 1793 total offices, Holding Company: Bb&T Corporation
- 4 other banks with 4 local branches
For population 15 years and over in Northport:
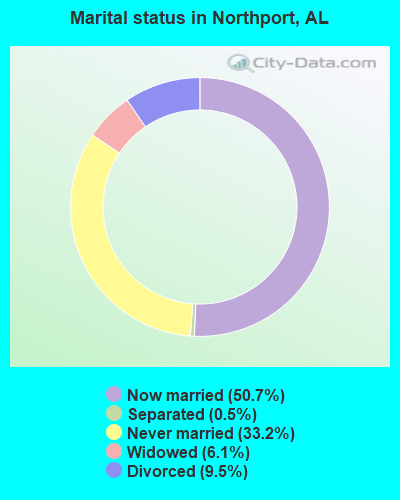
- Never married: 33.2%
- Now married: 50.7%
- Separated: 0.5%
- Widowed: 6.1%
- Divorced: 9.5%
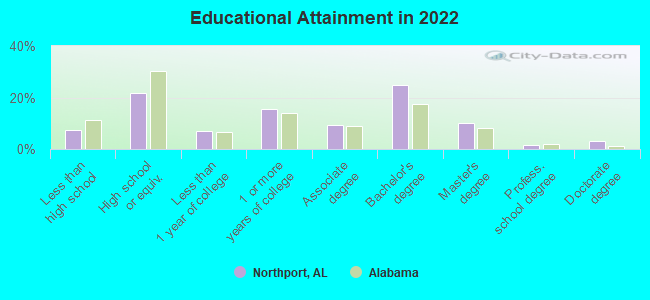
For population 25 years and over in Northport:
- High school or higher: 92.2%
- Bachelor's degree or higher: 36.2%
- Graduate or professional degree: 13.3%
- Unemployed: 4.8%
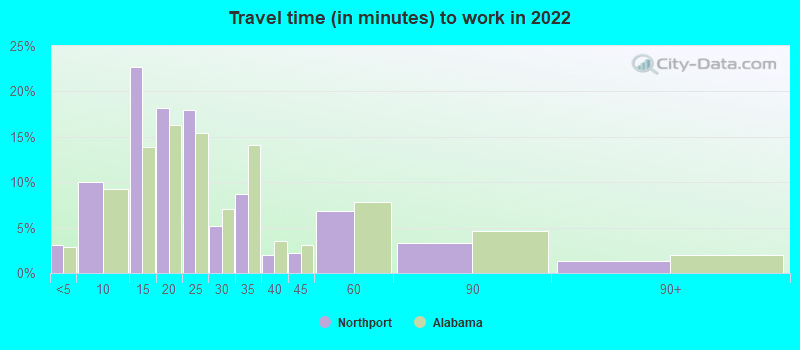
- Mean travel time to work (commute): 20.6 minutes
| Here: | 10.8 |
| Alabama average: | 11.5 |
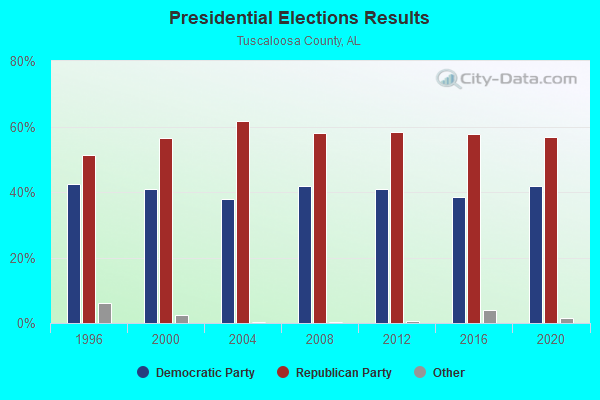
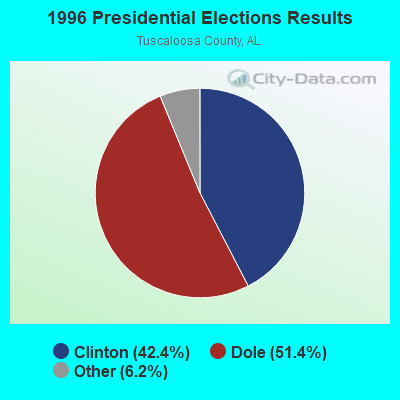
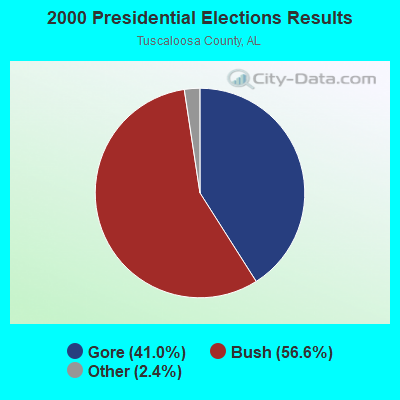
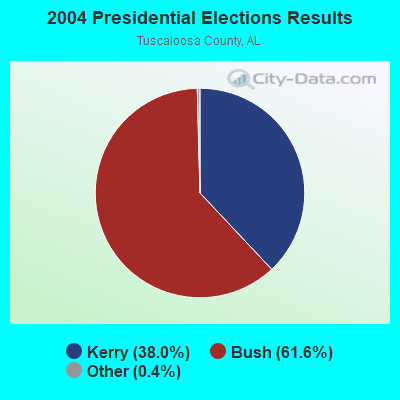
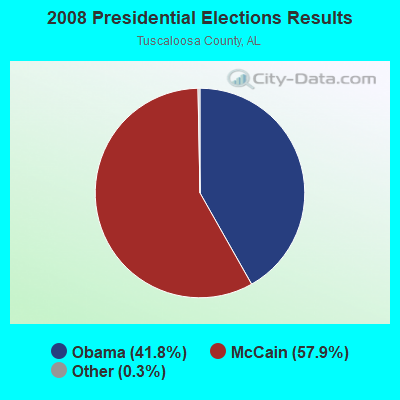
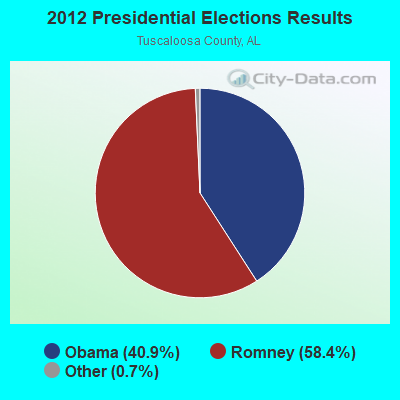
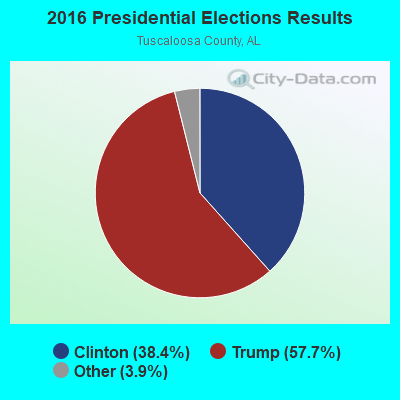
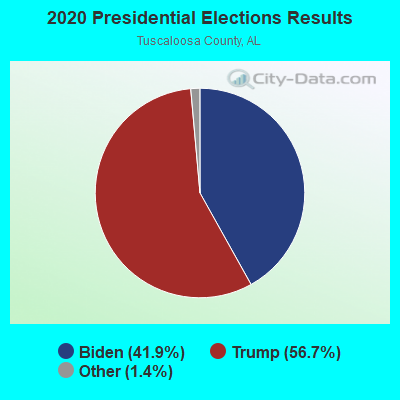
Graphs represent county-level data. Detailed 2008 Election Results
Religion statistics for Northport, AL (based on Tuscaloosa County data)
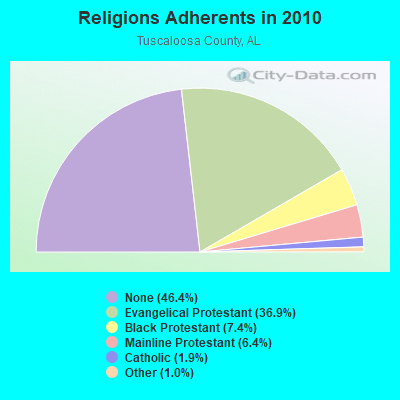
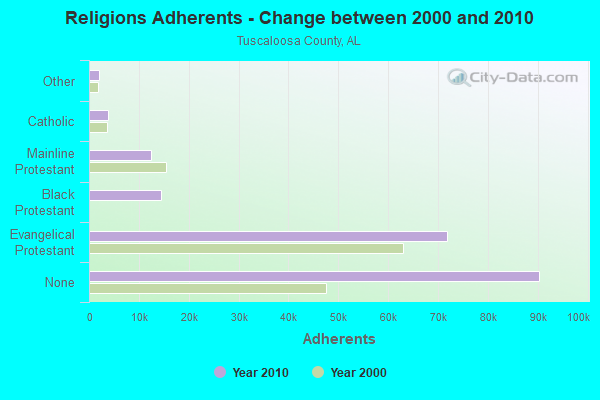
| Religion | Adherents | Congregations |
|---|---|---|
| Evangelical Protestant | 71,803 | 208 |
| Black Protestant | 14,428 | 45 |
| Mainline Protestant | 12,415 | 47 |
| Catholic | 3,729 | 2 |
| Other | 1,940 | 9 |
| None | 90,341 | - |
Food Environment Statistics:
| This county: | 2.03 / 10,000 pop. |
| State: | 1.89 / 10,000 pop. |
| This county: | 0.23 / 10,000 pop. |
| Alabama: | 0.20 / 10,000 pop. |
| This county: | 0.56 / 10,000 pop. |
| State: | 0.65 / 10,000 pop. |
| Tuscaloosa County: | 5.70 / 10,000 pop. |
| Alabama: | 6.32 / 10,000 pop. |
| Here: | 5.47 / 10,000 pop. |
| State: | 5.75 / 10,000 pop. |
| This county: | 10.7% |
| Alabama: | 11.8% |
| Tuscaloosa County: | 32.2% |
| Alabama: | 31.7% |
| Tuscaloosa County: | 10.8% |
| Alabama: | 13.5% |
Health and Nutrition:
| Northport: | 49.0% |
| Alabama: | 49.0% |
| Here: | 46.0% |
| Alabama: | 45.7% |
| Northport: | 28.8 |
| Alabama: | 28.9 |
| Northport: | 19.9% |
| State: | 20.7% |
| This city: | 11.0% |
| Alabama: | 11.0% |
| Northport: | 6.8 |
| State: | 6.8 |
| This city: | 33.8% |
| State: | 34.4% |
| Northport: | 55.7% |
| State: | 55.2% |
| Here: | 79.6% |
| Alabama: | 79.3% |
More about Health and Nutrition of Northport, AL Residents
| Local government employment and payroll (March 2022) | |||||
| Function | Full-time employees | Monthly full-time payroll | Average yearly full-time wage | Part-time employees | Monthly part-time payroll |
|---|---|---|---|---|---|
| Firefighters | 73 | $413,177 | $67,920 | 0 | $0 |
| Solid Waste Management | 53 | $177,937 | $40,288 | 0 | $0 |
| Police Protection - Officers | 53 | $307,369 | $69,593 | 5 | $7,072 |
| Water Supply | 27 | $114,705 | $50,980 | 0 | $0 |
| Police - Other | 18 | $82,960 | $55,307 | 3 | $487 |
| Streets and Highways | 14 | $65,834 | $56,429 | 1 | $1,202 |
| Other Government Administration | 13 | $83,640 | $77,206 | 10 | $5,750 |
| Sewerage | 12 | $48,067 | $48,067 | 0 | $0 |
| Financial Administration | 9 | $52,439 | $69,919 | 0 | $0 |
| Other and Unallocable | 5 | $21,025 | $50,460 | 0 | $0 |
| Fire - Other | 1 | $3,346 | $40,152 | 0 | $0 |
| Totals for Government | 278 | $1,370,498 | $59,158 | 19 | $14,511 |
Northport government finances - Expenditure in 2021 (per resident):
- Construction - Regular Highways: $8,202,000 ($264.55)
Water Utilities: $854,000 ($27.54)
- Current Operations - Police Protection: $7,261,000 ($234.20)
Local Fire Protection: $5,933,000 ($191.36)
Regular Highways: $5,041,000 ($162.59)
Water Utilities: $3,925,000 ($126.60)
Sewerage: $3,000,000 ($96.76)
Financial Administration: $2,460,000 ($79.34)
General - Other: $1,824,000 ($58.83)
Central Staff Services: $1,690,000 ($54.51)
Solid Waste Management: $1,246,000 ($40.19)
Judicial and Legal Services: $1,100,000 ($35.48)
- General - Interest on Debt: $829,000 ($26.74)
- Other Capital Outlay - Police Protection: $939,000 ($30.29)
Local Fire Protection: $767,000 ($24.74)
Financial Administration: $114,000 ($3.68)
- Water Utilities - Interest on Debt: $809,000 ($26.09)
Northport government finances - Revenue in 2021 (per resident):
- Charges - Sewerage: $4,234,000 ($136.56)
Solid Waste Management: $1,475,000 ($47.57)
Other: $226,000 ($7.29)
- Local Intergovernmental - General Local Government Support: $3,257,000 ($105.05)
Other: $143,000 ($4.61)
- Miscellaneous - Fines and Forfeits: $983,000 ($31.71)
General Revenue - Other: $377,000 ($12.16)
Rents: $58,000 ($1.87)
Interest Earnings: $5,000 ($0.16)
Special Assessments: $1,000 ($0.03)
- Revenue - Water Utilities: $6,278,000 ($202.49)
- State Intergovernmental - Highways: $770,000 ($24.84)
General Local Government Support: $274,000 ($8.84)
Other: $96,000 ($3.10)
- Tax - General Sales and Gross Receipts: $11,523,000 ($371.66)
Occupation and Business License - Other: $5,977,000 ($192.78)
Property: $3,795,000 ($122.40)
Other License: $759,000 ($24.48)
Other: $551,000 ($17.77)
Tobacco Products Sales: $347,000 ($11.19)
Alcoholic Beverage Sales: $146,000 ($4.71)
Northport government finances - Debt in 2021 (per resident):
- Long Term Debt - Beginning Outstanding - Unspecified Public Purpose: $19,157,000 ($617.89)
Retired Unspecified Public Purpose: $10,692,000 ($344.86)
Outstanding Unspecified Public Purpose: $8,465,000 ($273.03)
Northport government finances - Cash and Securities in 2021 (per resident):
- Other Funds - Cash and Securities: $9,601,000 ($309.67)
- Sinking Funds - Cash and Securities: $493,000 ($15.90)
| Businesses in Northport, AL | ||||
| Name | Count | Name | Count | |
|---|---|---|---|---|
| AT&T | 3 | Lowe's | 1 | |
| Advance Auto Parts | 1 | McDonald's | 3 | |
| Applebee's | 1 | New Balance | 1 | |
| Arby's | 1 | Nike | 1 | |
| AutoZone | 1 | Office Depot | 1 | |
| Best Western | 1 | Papa John's Pizza | 1 | |
| Burger King | 1 | Payless | 1 | |
| CVS | 2 | Pizza Hut | 1 | |
| Chick-Fil-A | 1 | Popeyes | 1 | |
| Curves | 1 | Publix Super Markets | 1 | |
| Dairy Queen | 1 | RadioShack | 1 | |
| Domino's Pizza | 1 | Rite Aid | 1 | |
| Econo Lodge | 1 | SONIC Drive-In | 2 | |
| FedEx | 2 | Subway | 3 | |
| GNC | 1 | T-Mobile | 2 | |
| GameStop | 1 | Taco Bell | 1 | |
| H&R Block | 1 | The Athlete's Foot | 1 | |
| Hardee's | 2 | U-Haul | 2 | |
| KFC | 1 | UPS | 5 | |
| Kmart | 1 | Waffle House | 1 | |
| La-Z-Boy | 1 | Walgreens | 1 | |
| Lane Furniture | 1 | Walmart | 1 | |
Strongest AM radio stations in Northport:
- WSPZ (1150 AM; 5 kW; TUSCALOOSA, AL; Owner: RADIO SOUTH, INC)
- WWPG (1280 AM; 5 kW; TUSCALOOSA, AL; Owner: LAWSON OF TUSCALOOSA, INC.)
- WTSK (790 AM; 5 kW; TUSCALOOSA, AL; Owner: APEX BROADCASTING INC.)
- WACT (1420 AM; 5 kW; TUSCALOOSA, AL; Owner: CAPSTAR TX LIMITED PARTNERSHIP)
- WJOX (690 AM; 50 kW; BIRMINGHAM, AL; Owner: CITADEL BROADCASTING COMPANY)
- WTBC (1230 AM; 1 kW; TUSCALOOSA, AL; Owner: JOHN SISTY ENTERPRISES, INC.)
- WAPI (1070 AM; 50 kW; BIRMINGHAM, AL; Owner: CITADEL BROADCASTING COMPANY)
- WDJC (850 AM; 50 kW; BIRMINGHAM, AL; Owner: KIMTRON, INC.)
- WCPC (940 AM; 50 kW; HOUSTON, MS; Owner: WCPC BROADCASTING CO., INC.)
- WNSI (810 AM; 50 kW; JACKSONVILLE, AL; Owner: UNITED BROADCASTING NETWORK, INC.)
- WSJC (810 AM; 50 kW; MAGEE, MS; Owner: FAMILY TALK RADIO)
- WKNG (1060 AM; daytime; 50 kW; TALLAPOOSA, GA; Owner: WKNG, INC.)
- WLOR (1550 AM; 50 kW; HUNTSVILLE, AL; Owner: BCA RADIO, LLC)
Strongest FM radio stations in Northport:
- WBHJ (95.7 FM; TUSCALOOSA, AL; Owner: CXR HOLDINGS, INC.)
- WDXB (102.5 FM; JASPER, AL; Owner: CAPSTAR TX LIMITED PARTNERSHIP)
- WTXT (98.1 FM; FAYETTE, AL; Owner: CAPSTAR TX LIMITED PARTNERSHIP)
- WTUG-FM (92.9 FM; TUSCALOOSA, AL; Owner: APEX BROADCASTING INC.)
- WRTR (105.5 FM; TUSCALOOSA, AL; Owner: CAPSTAR TX LIMITED PARTNERSHIP)
- WVUA-FM (90.7 FM; TUSCALOOSA, AL; Owner: BD OF TRUSTEES, THE UNIVERSITY OF AL)
- W300AE (107.9 FM; TUSCALOOSA, AL; Owner: GLEN IRIS BAPTIST SCHOOL)
- W247AN (97.3 FM; TUSCALOOSA, AL; Owner: WILLIAM PAXTON ROGERS)
- WANZ (100.7 FM; NORTHPORT, AL; Owner: APEX BRAODCASTING INC.)
- WBEI (101.7 FM; REFORM, AL; Owner: APEX BROADCASTING INC.)
- WUAL-FM (91.5 FM; TUSCALOOSA, AL; Owner: UNIVERSITY OF ALABAMA)
- WZBQ (94.1 FM; CARROLLTON, AL; Owner: CAPSTAR TX LIMITED PARTNERSHIP)
- WQZZ (104.3 FM; EUTAW, AL; Owner: JIM LAWSON COMMUNICATIONS, INC.)
- WODL (97.3 FM; HOMEWOOD, AL; Owner: CXR HOLDINGS, INC.)
- WDGM (99.1 FM; GREENSBORO, AL; Owner: WARRIOR BROADCASTING INC.)
- WALN (89.3 FM; CARROLLTON, AL; Owner: AMERICAN FAMILY ASSOCIATION)
- WBHK (98.7 FM; WARRIOR, AL; Owner: CXR HOLDINGS, INC.)
- WZZK-FM (104.7 FM; BIRMINGHAM, AL; Owner: CXR HOLDINGS, INC.)
- WMJJ (96.5 FM; BIRMINGHAM, AL; Owner: CAPSTAR TX LIMITED PARTNERSHIP)
- WYSF (94.5 FM; BIRMINGHAM, AL; Owner: CITADEL BROADCASTING COMPANY)
TV broadcast stations around Northport:
- WCFT-TV (Channel 33; TUSCALOOSA, AL; Owner: TV ALABAMA, INCORPORATED)
- WDBB (Channel 17; BESSEMER, AL; Owner: WDBB-TV, INC.)
- WVUA-CA (Channel 7; TUSCALOOSA/NORTHPORT, AL; Owner: THE BOARD OF TRUSTEES OF THE UNIVERSITY OF ALABAMA)
- WLDM (Channel 23; TUSCALOOSA, AL; Owner: CHANNEL 23, LLC)
- W46BU (Channel 46; TUSCALOOSA, AL; Owner: TRINITY BROADCASTING NETWORK)
- WABM (Channel 68; BIRMINGHAM, AL; Owner: BIRMINGHAM (WABM-TV) LICENSEE, INC.)
- WDVZ-CA (Channel 3; GREENSBORO, AL; Owner: TTI, INC.)
- National Bridge Inventory (NBI) Statistics
- 45Number of bridges
- 761ft / 232mTotal length
- $125,590,000Total costs
- 397,175Total average daily traffic
- 23,057Total average daily truck traffic
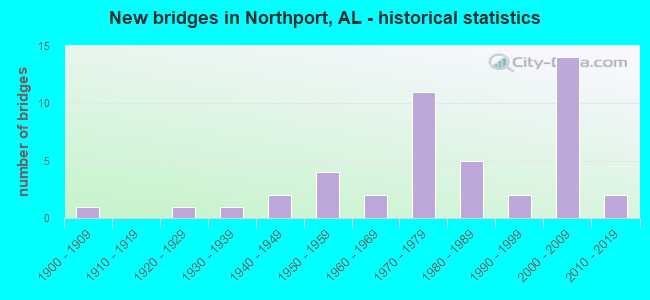
- New bridges - historical statistics
- 11900-1909
- 11920-1929
- 11930-1939
- 21940-1949
- 41950-1959
- 21960-1969
- 111970-1979
- 51980-1989
- 21990-1999
- 142000-2009
- 22010-2019
FCC Registered Antenna Towers: 296 (See the full list of FCC Registered Antenna Towers)
FCC Registered Commercial Land Mobile Towers: 1 (See the full list of FCC Registered Commercial Land Mobile Towers in Northport, AL)
FCC Registered Private Land Mobile Towers: 1 (See the full list of FCC Registered Private Land Mobile Towers)
FCC Registered Broadcast Land Mobile Towers: 21 (See the full list of FCC Registered Broadcast Land Mobile Towers)
FCC Registered Microwave Towers: 28 (See the full list of FCC Registered Microwave Towers in this town)
FCC Registered Amateur Radio Licenses: 255 (See the full list of FCC Registered Amateur Radio Licenses in Northport)
FAA Registered Aircraft: 19 (See the full list of FAA Registered Aircraft in Northport)
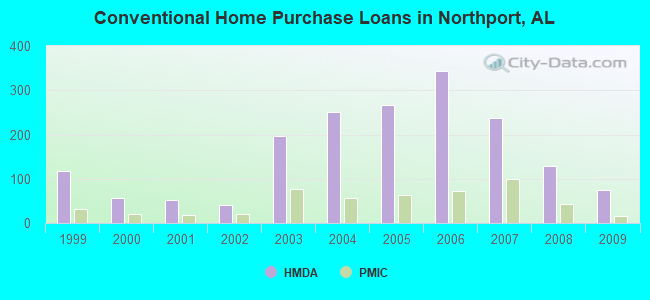
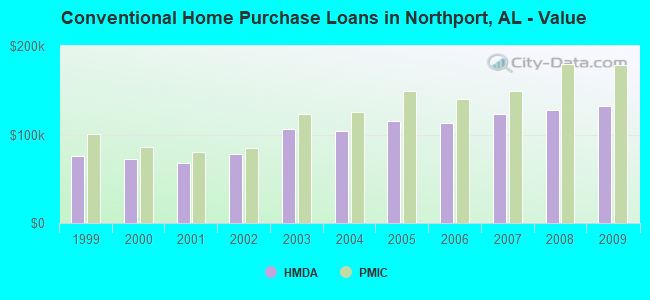
| Home Mortgage Disclosure Act Aggregated Statistics For Year 2009 (Based on 5 partial tracts) | ||||||||||||||
| A) FHA, FSA/RHS & VA Home Purchase Loans | B) Conventional Home Purchase Loans | C) Refinancings | D) Home Improvement Loans | E) Loans on Dwellings For 5+ Families | F) Non-occupant Loans on < 5 Family Dwellings (A B C & D) | G) Loans On Manufactured Home Dwelling (A B C & D) | ||||||||
|---|---|---|---|---|---|---|---|---|---|---|---|---|---|---|
| Number | Average Value | Number | Average Value | Number | Average Value | Number | Average Value | Number | Average Value | Number | Average Value | Number | Average Value | |
| LOANS ORIGINATED | 94 | $133,459 | 74 | $131,813 | 307 | $139,484 | 11 | $57,638 | 1 | $878,950 | 44 | $111,783 | 5 | $37,418 |
| APPLICATIONS APPROVED, NOT ACCEPTED | 3 | $167,733 | 1 | $142,220 | 14 | $156,328 | 3 | $40,853 | 0 | $0 | 1 | $78,200 | 1 | $41,660 |
| APPLICATIONS DENIED | 5 | $183,942 | 8 | $168,929 | 87 | $146,134 | 8 | $65,409 | 1 | $66,130 | 3 | $63,167 | 3 | $76,687 |
| APPLICATIONS WITHDRAWN | 4 | $151,978 | 9 | $125,753 | 74 | $152,215 | 1 | $63,670 | 0 | $0 | 5 | $91,284 | 0 | $0 |
| FILES CLOSED FOR INCOMPLETENESS | 0 | $0 | 2 | $137,325 | 13 | $150,904 | 0 | $0 | 0 | $0 | 1 | $88,580 | 0 | $0 |
Detailed HMDA statistics for the following Tracts: 0102.02 , 0102.04, 0103.01, 0104.03, 0104.04
| Private Mortgage Insurance Companies Aggregated Statistics For Year 2009 (Based on 5 partial tracts) | ||||||
| A) Conventional Home Purchase Loans | B) Refinancings | C) Non-occupant Loans on < 5 Family Dwellings (A & B) | ||||
|---|---|---|---|---|---|---|
| Number | Average Value | Number | Average Value | Number | Average Value | |
| LOANS ORIGINATED | 16 | $178,099 | 20 | $179,864 | 1 | $82,690 |
| APPLICATIONS APPROVED, NOT ACCEPTED | 4 | $215,350 | 5 | $171,600 | 1 | $69,230 |
| APPLICATIONS DENIED | 2 | $131,980 | 2 | $124,540 | 0 | $0 |
| APPLICATIONS WITHDRAWN | 1 | $126,920 | 0 | $0 | 0 | $0 |
| FILES CLOSED FOR INCOMPLETENESS | 0 | $0 | 1 | $109,610 | 1 | $109,610 |
Detailed PMIC statistics for the following Tracts: 0102.02 , 0102.04, 0103.01, 0104.03, 0104.04
2003 - 2018 National Fire Incident Reporting System (NFIRS) incidents
- Fire incident types reported to NFIRS in Northport, AL
- 76845.0%Outside Fires
- 51129.9%Structure Fires
- 24714.5%Mobile Property/Vehicle Fires
- 18210.7%Other
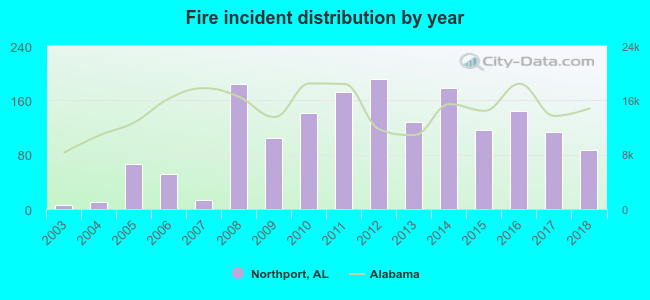 According to the data from the years 2003 - 2018 the average number of fire incidents per year is 107. The highest number of fires - 191 took place in 2012, and the least - 6 in 2003. The data has an increasing trend.
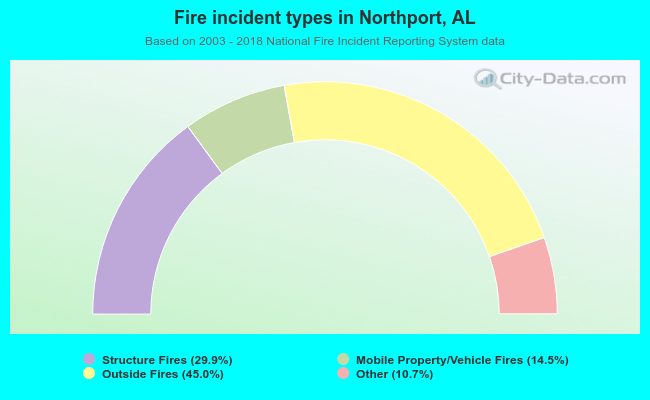 When looking into fire subcategories, the most reports belonged to: Outside Fires (45.0%), and Structure Fires (29.9%).
Fire-safe hotels and motels in Northport, Alabama:
- Econo Lodge Inn & Suites, 1930 Mcfarland Blvd, Northport, Alabama 35476 , Phone: (205) 330-0345, Fax: (205) 330-0345
- Bestwestern Catalina Inn, 2015 Mcfarland Blvd, Northport, Alabama 35476 , Phone: (205) 339-5200, Fax: (205) 330-1335
| Most common first names in Northport, AL among deceased individuals | ||
| Name | Count | Lived (average) |
|---|---|---|
| James | 324 | 71.9 years |
| Mary | 213 | 79.4 years |
| William | 187 | 72.6 years |
| John | 162 | 75.0 years |
| Robert | 114 | 71.9 years |
| Willie | 106 | 74.7 years |
| Annie | 97 | 83.1 years |
| George | 70 | 74.0 years |
| Thomas | 61 | 73.3 years |
| Jessie | 58 | 75.6 years |
| Most common last names in Northport, AL among deceased individuals | ||
| Last name | Count | Lived (average) |
|---|---|---|
| Jones | 116 | 78.0 years |
| Smith | 97 | 75.7 years |
| Brown | 91 | 73.5 years |
| Wilson | 66 | 75.1 years |
| Williams | 66 | 71.6 years |
| Johnson | 64 | 77.1 years |
| Montgomery | 59 | 78.3 years |
| Hamner | 56 | 77.2 years |
| Davis | 56 | 73.2 years |
| Taylor | 53 | 78.7 years |
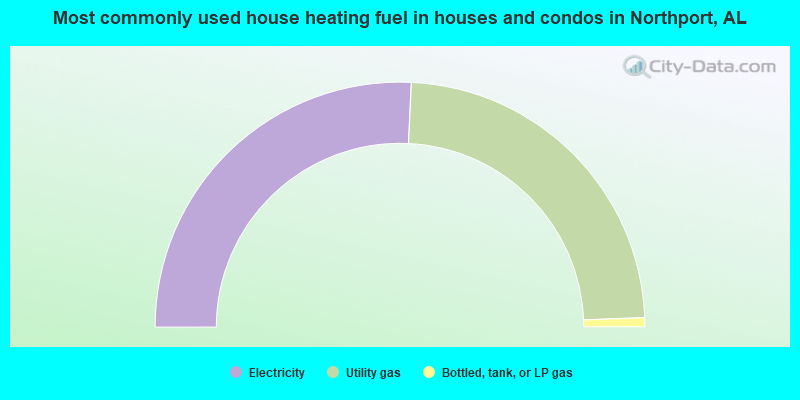
- 51.5%Electricity
- 47.3%Utility gas
- 1.2%Bottled, tank, or LP gas
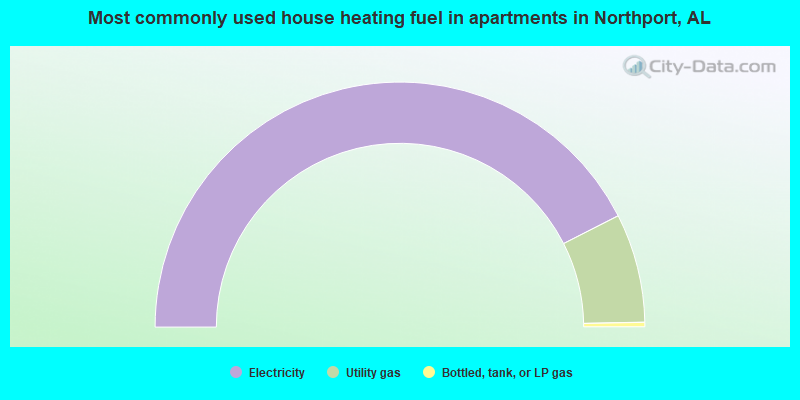
- 85.1%Electricity
- 14.4%Utility gas
- 0.6%Bottled, tank, or LP gas
Northport compared to Alabama state average:
- Unemployed percentage significantly below state average.
- Median age significantly below state average.
- Length of stay since moving in above state average.
- Institutionalized population percentage above state average.
- Number of college students above state average.
- Percentage of population with a bachelor's degree or higher above state average.
Northport on our top lists:
- #14 on the list of "Top 101 cities with the most people driving a car to work alone (population 5,000+)"
- #75 on the list of "Top 101 cities with the most full-time firefighters per 1000 residents (population 5,000+)"
- #81 on the list of "Top 101 cities with the largest positive percentage difference between never married females and males (15+ years) (with at least 1,000 females never married)"
- #15 on the list of "Top 101 counties with the lowest Ozone (1-hour) air pollution readings in 2012 (ppm)"
- #16 on the list of "Top 101 counties with the worst general health status score of residents (1-5), 3 years of data"
- #18 on the list of "Top 101 counties with the lowest percentage of residents that visited a dentist within the past year"
- #23 on the list of "Top 101 counties with the lowest percentage of residents relocating from foreign countries between 2010 and 2011"
- #29 on the list of "Top 101 counties with the lowest percentage of residents that smoked 100+ cigarettes in their lives"

|
|
Total of 51 patent applications in 2008-2024.