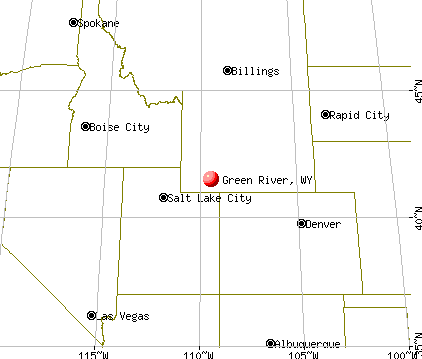
Green River, Wyoming
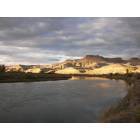
Green River: sunset at Scott's bottom recreation area
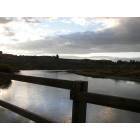
Green River: leaving Scott's bottom recreation area as the sun sets

Green River: The best time to make a wish. Being able to acutaly drive under a rainbow.
Green River: reflections at scott's bottom recreation area
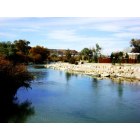
Green River: the Green River as it enters town
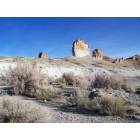
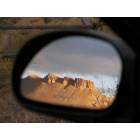
Green River: butte formations at western edge of town
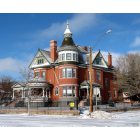
Green River: I found this Beautiful old building across from the Rail Road Bridge in Green River, Wyoming. I really wish I knew more about it
Green River: Green river Expadition Island.
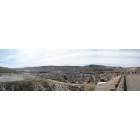
Green River: Green River Panoramic view
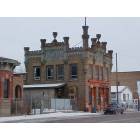
Green River: Liquor Castle Built 1888
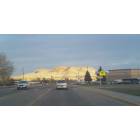
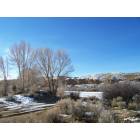
Green River: Picture of my drive home
- add
your


Submit your own pictures of this city and show them to the world
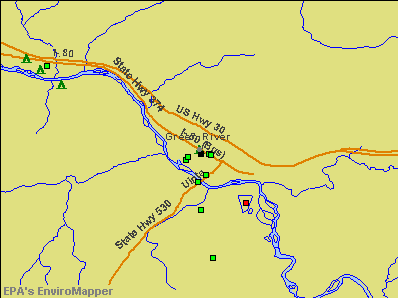
- OSM Map
- General Map
- Google Map
- MSN Map
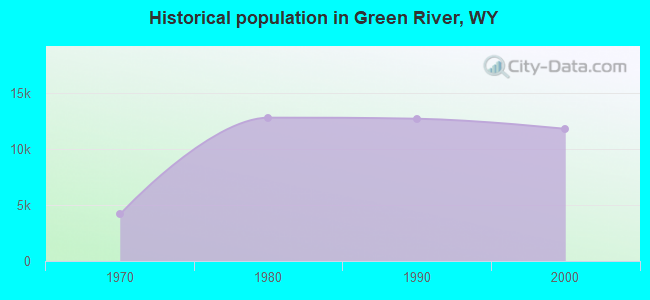
Population change since 2000: -2.3%
| Males: 5,833 | |
| Females: 5,702 |
| Median resident age: | 38.4 years |
| Wyoming median age: | 39.1 years |
Zip codes: 82935.
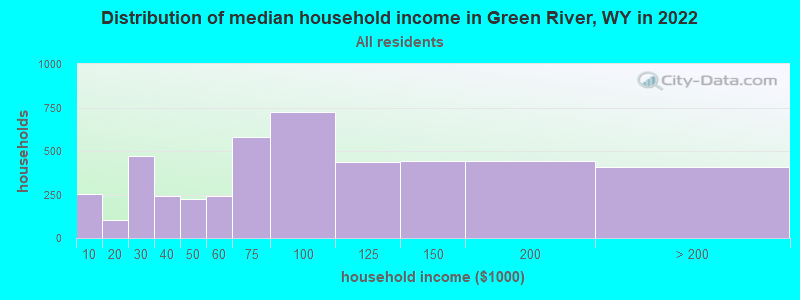
| Green River: | $80,672 |
| WY: | $70,042 |
Estimated per capita income in 2022: $38,586 (it was $20,398 in 2000)
Green River city income, earnings, and wages data
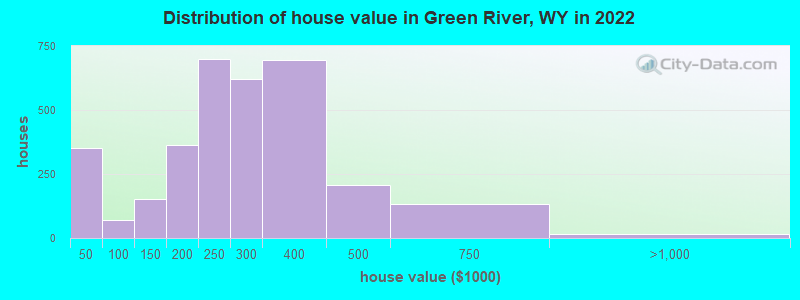
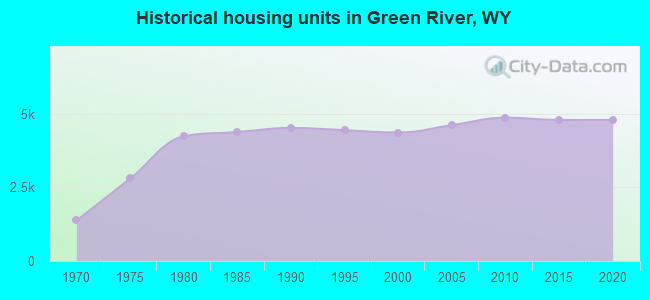
Estimated median house or condo value in 2022: $264,900 (it was $98,500 in 2000)
| Green River: | $264,900 |
| WY: | $292,300 |
Mean prices in 2022: all housing units: $300,018; detached houses: $338,167; townhouses or other attached units: $305,144; mobile homes: $31,767
Median gross rent in 2022: $885.
(6.3% for White Non-Hispanic residents, 13.0% for Hispanic or Latino residents, 56.3% for other race residents, 4.7% for two or more races residents)
Detailed information about poverty and poor residents in Green River, WY
Compare current foreclosures near Green River, WY:
| Photo | Address | Area | Beds / Baths | Price | Details |
|---|---|---|---|---|---|

|
#1
Trail Dr
Green River, WY 82935
|
1,056 sq. feet
|
2 baths 3 beds |
show details | |

|
#2
E Teton Blvd
Green River, WY 82935
|
1,170 sq. feet
|
2 baths 2 beds |
show details | |

|
#3
Iowa Ave
Green River, WY 82935
|
1,680 sq. feet
|
2 baths 3 beds |
show details | |

|
#4
New York Ln
Green River, WY 82935
|
- sq. feet
|
2 baths 3 beds |
show details | |

|
#5
E Teton Blvd
Green River, WY 82935
|
2,360 sq. feet
|
3 baths 5 beds |
show details | |

|
#6
Maryland Dr
Green River, WY 82935
|
- sq. feet
|
- baths - beds |
show details | |

|
#7
Mountain Fuel Sta Unit 1
Green River, WY 82935
|
- sq. feet
|
- baths - beds |
show details | |

|
#8
Hoover Dr
Green River, WY 82935
|
- sq. feet
|
- baths - beds |
show details | |

|
#9
W 2nd North St
Green River, WY 82935
|
- sq. feet
|
- baths - beds |
show details | |

|
#10
Indian Hills Dr
Green River, WY 82935
|
- sq. feet
|
- baths - beds |
show details |
| Photo | Address | Area | Beds / Baths | Price | Details |
|---|---|---|---|---|---|

|
#11
Bramwell St
Green River, WY 82935
|
- sq. feet
|
- baths - beds |
show details | |

|
#12
Shoshone Ave Unit 10
Green River, WY 82935
|
- sq. feet
|
- baths - beds |
show details | |

|
#13
Lowell Ave
Rock Springs, WY 82901
|
2,792 sq. feet
|
3 baths 3 beds |
show details | |

|
#14
Koven Dr
Rock Springs, WY 82901
|
1,520 sq. feet
|
3 baths 3 beds |
show details | |

|
#15
Midway St
Rock Springs, WY 82901
|
2,016 sq. feet
|
2 baths 3 beds |
show details | |

|
#16
Springs Dr Lot 59
Rock Springs, WY 82901
|
- sq. feet
|
- baths - beds |
show details | |

|
#17
Yellowstone Rd Unit F
Rock Springs, WY 82901
|
- sq. feet
|
- baths - beds |
show details | |

|
#18
Swanson Dr Lot 83
Rock Springs, WY 82901
|
- sq. feet
|
- baths - beds |
show details | |

|
#19
Century Blvd Apt 302
Rock Springs, WY 82901
|
- sq. feet
|
- baths - beds |
show details | |

|
#20
Century Blvd Apt 205
Rock Springs, WY 82901
|
- sq. feet
|
- baths - beds |
show details |
| Photo | Address | Area | Beds / Baths | Price | Details |
|---|---|---|---|---|---|

|
#21
Elk St Lot 230
Rock Springs, WY 82901
|
- sq. feet
|
- baths - beds |
show details | |

|
#22
Purple Sage Rd Lot 128
Rock Springs, WY 82901
|
- sq. feet
|
- baths - beds |
show details | |

|
#23
C St
Rock Springs, WY 82901
|
- sq. feet
|
- baths - beds |
show details | |

|
#24
Madison Dr Apt 4d
Rock Springs, WY 82901
|
- sq. feet
|
- baths - beds |
show details | |

|
#25
W 2nd St Lot 1
Rock Springs, WY 82901
|
- sq. feet
|
- baths - beds |
show details | |

|
#26
Reagan Ave
Rock Springs, WY 82901
|
- sq. feet
|
- baths - beds |
show details | |

|
#27
Dewar Dr Apt 303
Rock Springs, WY 82901
|
- sq. feet
|
- baths - beds |
show details | |

|
#28
Purple Sage Rd Lot 150
Rock Springs, WY 82901
|
- sq. feet
|
- baths - beds |
show details | |

|
#29
Purple Sage Rd Lot 27
Rock Springs, WY 82901
|
- sq. feet
|
- baths - beds |
show details | |

|
#30
Purple Sage Rd Lot 30
Rock Springs, WY 82901
|
- sq. feet
|
- baths - beds |
show details |
| Photo | Address | Area | Beds / Baths | Price | Details |
|---|---|---|---|---|---|

|
#31
Reliance Rd, Unit A
Reliance, WY 82943
|
- sq. feet
|
- baths - beds |
show details | |

|
Check over 1 million property listings on Foreclosure.com!
|
browse all offers | |||


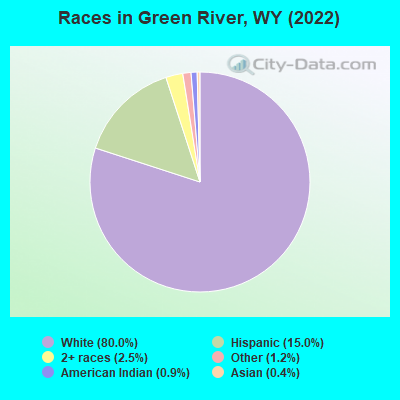
- 9,47780.0%White alone
- 1,77815.0%Hispanic
- 2932.5%Two or more races
- 1461.2%Other race alone
- 1100.9%American Indian alone
- 470.4%Asian alone
- 110.09%Native Hawaiian and Other
Pacific Islander alone
Races in Green River detailed stats: ancestries, foreign born residents, place of birth
According to our research of Wyoming and other state lists, there were 23 registered sex offenders living in Green River, Wyoming as of May 21, 2024.
The ratio of all residents to sex offenders in Green River is 549 to 1.
The ratio of registered sex offenders to all residents in this city is lower than the state average.
Type |
2009 |
2010 |
2011 |
2012 |
2013 |
2014 |
2015 |
2016 |
2017 |
2018 |
2019 |
2020 |
2021 |
2022 |
|---|---|---|---|---|---|---|---|---|---|---|---|---|---|---|
| Murders (per 100,000) | 0 (0.0) | 0 (0.0) | 0 (0.0) | 0 (0.0) | 0 (0.0) | 0 (0.0) | 0 (0.0) | 0 (0.0) | 0 (0.0) | 0 (0.0) | 0 (0.0) | 0 (0.0) | 0 (0.0) | 2 (17.5) |
| Rapes (per 100,000) | 1 (8.2) | 6 (47.9) | 3 (23.8) | 1 (7.8) | 7 (54.1) | 0 (0.0) | 5 (39.4) | 1 (8.0) | 0 (0.0) | 0 (0.0) | 0 (0.0) | 0 (0.0) | 11 (93.8) | 5 (43.7) |
| Robberies (per 100,000) | 5 (41.0) | 1 (8.0) | 0 (0.0) | 1 (7.8) | 1 (7.7) | 0 (0.0) | 1 (7.9) | 0 (0.0) | 0 (0.0) | 0 (0.0) | 0 (0.0) | 0 (0.0) | 1 (8.5) | 0 (0.0) |
| Assaults (per 100,000) | 76 (623.3) | 82 (655.2) | 74 (586.6) | 72 (562.3) | 48 (371.1) | 31 (241.5) | 52 (409.9) | 31 (248.5) | 20 (162.7) | 14 (116.4) | 22 (184.5) | 31 (265.2) | 21 (179.0) | 15 (131.2) |
| Burglaries (per 100,000) | 49 (401.8) | 36 (287.7) | 41 (325.0) | 39 (304.6) | 28 (216.5) | 23 (179.1) | 28 (220.7) | 24 (192.4) | 22 (179.0) | 22 (183.0) | 11 (92.2) | 15 (128.3) | 51 (434.8) | 8 (70.0) |
| Thefts (per 100,000) | 253 (2,075) | 202 (1,614) | 194 (1,538) | 151 (1,179) | 120 (927.9) | 125 (973.6) | 107 (843.4) | 90 (721.3) | 93 (756.8) | 78 (648.6) | 84 (704.3) | 61 (521.8) | 79 (673.5) | 78 (682.1) |
| Auto thefts (per 100,000) | 6 (49.2) | 8 (63.9) | 14 (111.0) | 8 (62.5) | 8 (61.9) | 14 (109.0) | 9 (70.9) | 5 (40.1) | 7 (57.0) | 2 (16.6) | 2 (16.8) | 1 (8.6) | 11 (93.8) | 5 (43.7) |
| Arson (per 100,000) | 0 (0.0) | 1 (8.0) | 1 (7.9) | 3 (23.4) | 1 (7.7) | 1 (7.8) | 1 (7.9) | 2 (16.0) | 0 (0.0) | 0 (0.0) | 0 (0.0) | 0 (0.0) | 2 (17.1) | 2 (17.5) |
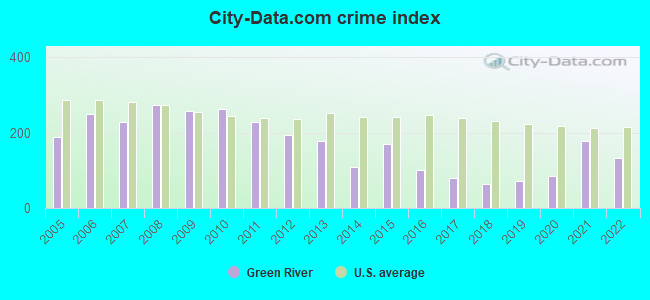
| City-Data.com crime index | 258.6 | 261.6 | 229.5 | 194.5 | 177.1 | 108.5 | 170.7 | 101.6 | 79.9 | 63.4 | 72.9 | 83.6 | 178.3 | 131.9 |
The City-Data.com crime index weighs serious crimes and violent crimes more heavily. Higher means more crime, U.S. average is 246.1. It adjusts for the number of visitors and daily workers commuting into cities.
Crime rate in Green River detailed stats: murders, rapes, robberies, assaults, burglaries, thefts, arson
Full-time law enforcement employees in 2021, including police officers: 31 (26 officers - 22 male; 4 female).
| Officers per 1,000 residents here: | 2.22 |
| Wyoming average: | 2.78 |
 Recent articles from our blog. Our writers, many of them Ph.D. graduates or candidates, create easy-to-read articles on a wide variety of topics.


 | Green River / Rock Springs Acceptance? (32 replies) |
| Camping in Green River Lakes (18 replies) |
| Green River Good Play To Live? (18 replies) |
| I am planning to move here (25 replies) |
| December Vacation Rock Springs and Green River (18 replies) |
| Good Town For Retirees (54 replies) |
Latest news from Green River, WY collected exclusively by city-data.com from local newspapers, TV, and radio stations
Ancestries: English (22.8%), American (14.2%), European (8.6%), German (8.0%), Italian (3.1%), Irish (2.6%).
Current Local Time: MST time zone
Incorporated in 1868
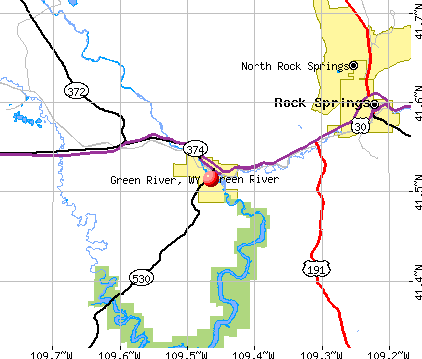
Elevation: 6109 feet
Land area: 13.7 square miles.
Population density: 842 people per square mile (low).
447 residents are foreign born (1.7% Latin America, 0.9% Europe, 0.9% Asia).
| This city: | 3.8% |
| Wyoming: | 3.4% |
Median real estate property taxes paid for housing units with mortgages in 2022: $1,688 (0.6%)
Median real estate property taxes paid for housing units with no mortgage in 2022: $1,277 (0.5%)
Nearest city with pop. 50,000+: Ogden, UT  (131.1 miles , pop. 77,226).
Nearest city with pop. 200,000+: Northeast Jefferson, CO (259.3 miles , pop. 450,166).
Nearest city with pop. 1,000,000+: Phoenix, AZ (570.6 miles , pop. 1,321,045).
Nearest cities:
), ), Latitude: 41.51 N, Longitude: 109.46 W
Daytime population change due to commuting: -2,561 (-21.6%)
Workers who live and work in this city: 2,027 (37.9%)
Area code: 307
Green River, Wyoming accommodation & food services, waste management - Economy and Business Data
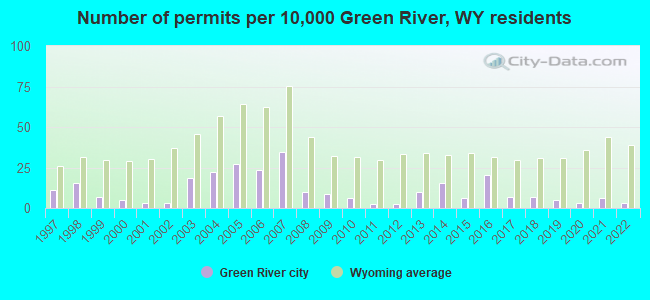
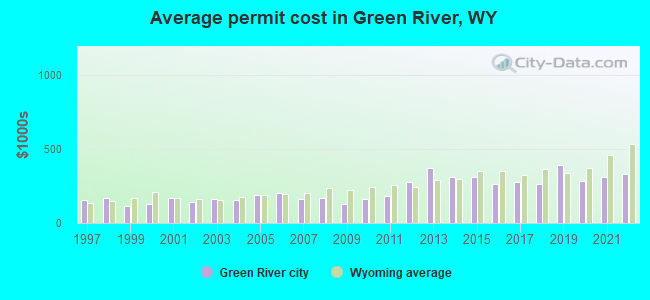
Single-family new house construction building permits:
- 2022: 4 buildings, average cost: $328,500
- 2021: 7 buildings, average cost: $311,800
- 2020: 4 buildings, average cost: $286,500
- 2019: 6 buildings, average cost: $391,400
- 2018: 8 buildings, average cost: $263,500
- 2017: 8 buildings, average cost: $279,100
- 2016: 24 buildings, average cost: $265,500
- 2015: 7 buildings, average cost: $311,500
- 2014: 18 buildings, average cost: $308,000
- 2013: 12 buildings, average cost: $374,700
- 2012: 3 buildings, average cost: $274,200
- 2011: 3 buildings, average cost: $185,300
- 2010: 7 buildings, average cost: $164,400
- 2009: 10 buildings, average cost: $126,700
- 2008: 12 buildings, average cost: $172,300
- 2007: 41 buildings, average cost: $164,600
- 2006: 28 buildings, average cost: $200,400
- 2005: 32 buildings, average cost: $189,600
- 2004: 26 buildings, average cost: $155,100
- 2003: 22 buildings, average cost: $159,100
- 2002: 4 buildings, average cost: $140,000
- 2001: 4 buildings, average cost: $167,500
- 2000: 6 buildings, average cost: $125,500
- 1999: 8 buildings, average cost: $115,500
- 1998: 18 buildings, average cost: $172,200
- 1997: 13 buildings, average cost: $155,100
| Here: | 2.9% |
| Wyoming: | 2.5% |
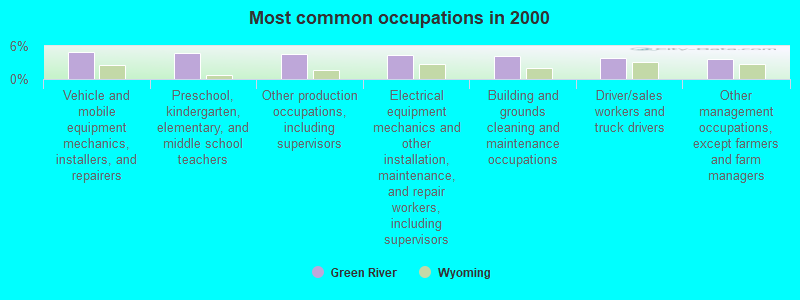
- Vehicle and mobile equipment mechanics, installers, and repairers (4.9%)
- Preschool, kindergarten, elementary, and middle school teachers (4.7%)
- Other production occupations, including supervisors (4.6%)
- Electrical equipment mechanics and other installation, maintenance, and repair workers, including supervisors (4.4%)
- Building and grounds cleaning and maintenance occupations (4.1%)
- Driver/sales workers and truck drivers (3.7%)
- Other management occupations, except farmers and farm managers (3.6%)
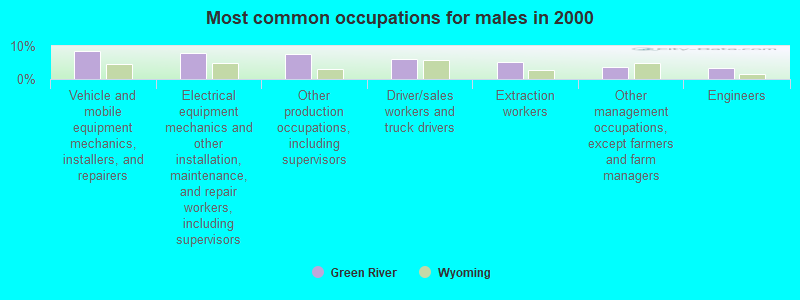
- Vehicle and mobile equipment mechanics, installers, and repairers (8.5%)
- Electrical equipment mechanics and other installation, maintenance, and repair workers, including supervisors (7.9%)
- Other production occupations, including supervisors (7.5%)
- Driver/sales workers and truck drivers (6.2%)
- Extraction workers (5.2%)
- Other management occupations, except farmers and farm managers (3.5%)
- Engineers (3.2%)
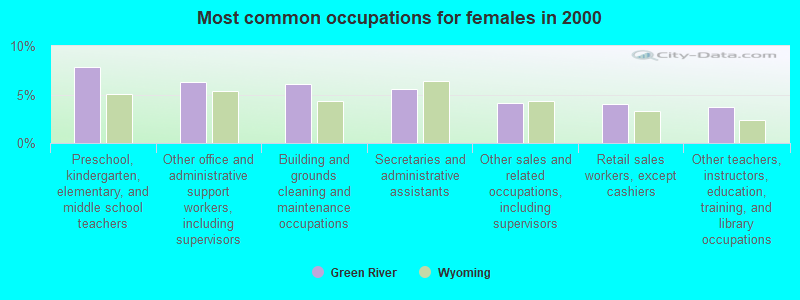
- Preschool, kindergarten, elementary, and middle school teachers (7.8%)
- Other office and administrative support workers, including supervisors (6.3%)
- Building and grounds cleaning and maintenance occupations (6.1%)
- Secretaries and administrative assistants (5.6%)
- Other sales and related occupations, including supervisors (4.2%)
- Retail sales workers, except cashiers (4.0%)
- Other teachers, instructors, education, training, and library occupations (3.7%)
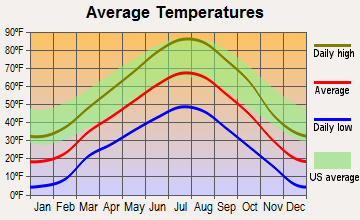
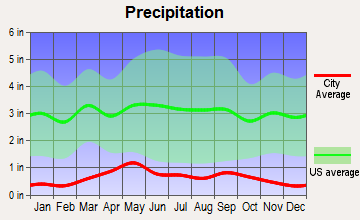
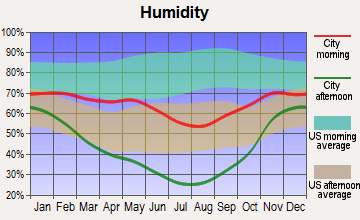
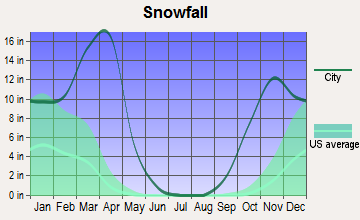
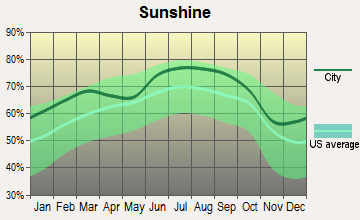
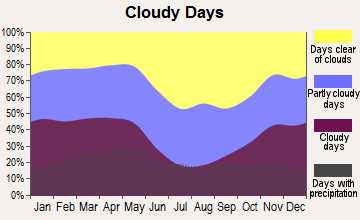
Average climate in Green River, Wyoming
Based on data reported by over 4,000 weather stations

|
|

(lower is better)
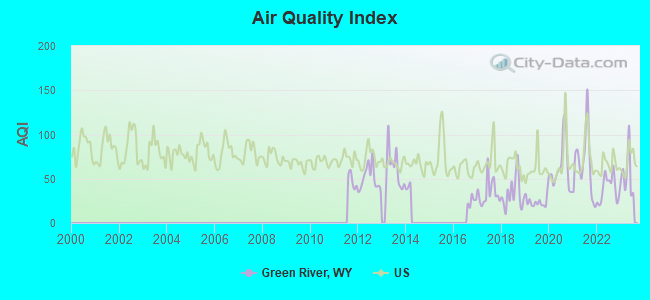
Air Quality Index (AQI) level in 2023 was 54.9. This is better than average.
| City: | 54.9 |
| U.S.: | 72.6 |
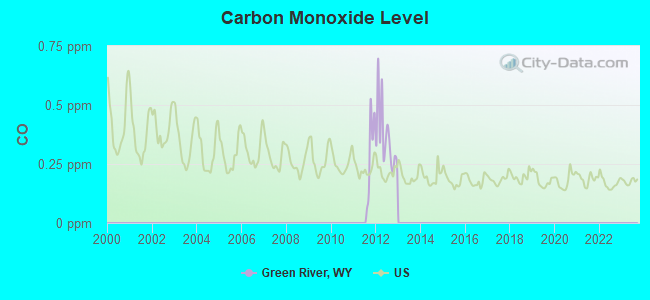
Carbon Monoxide (CO) [ppm] level in 2012 was 0.363. This is significantly worse than average. Closest monitor was 16.2 miles away from the city center.
| City: | 0.363 |
| U.S.: | 0.251 |
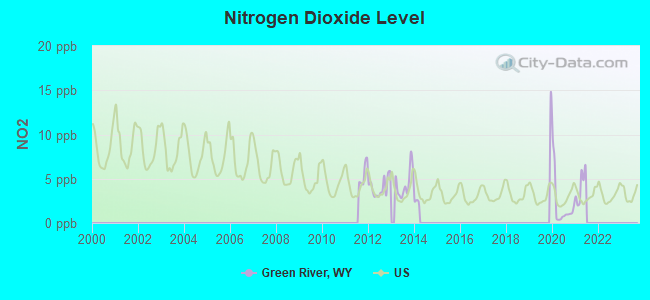
Nitrogen Dioxide (NO2) [ppb] level in 2020 was 2.09. This is significantly better than average. Closest monitor was 4.5 miles away from the city center.
| City: | 2.09 |
| U.S.: | 5.11 |
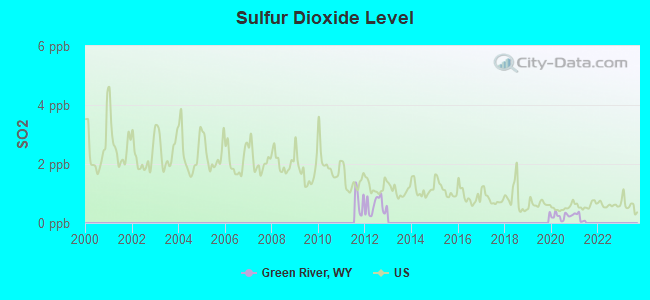
Sulfur Dioxide (SO2) [ppb] level in 2020 was 0.232. This is significantly better than average. Closest monitor was 4.5 miles away from the city center.
| City: | 0.232 |
| U.S.: | 1.515 |
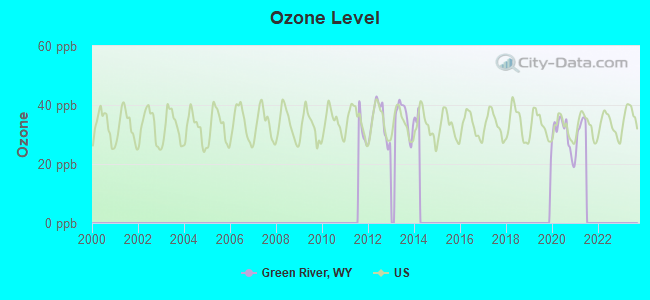
Ozone [ppb] level in 2020 was 30.0. This is about average. Closest monitor was 4.5 miles away from the city center.
| City: | 30.0 |
| U.S.: | 33.3 |
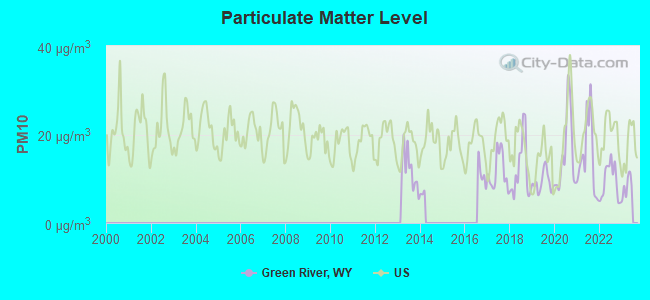
Particulate Matter (PM10) [µg/m3] level in 2022 was 9.46. This is significantly better than average. Closest monitor was 4.5 miles away from the city center.
| City: | 9.46 |
| U.S.: | 19.21 |
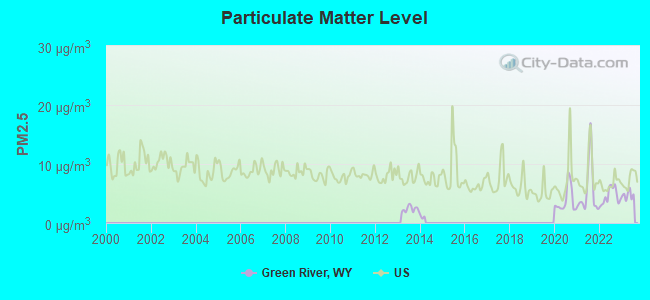
Particulate Matter (PM2.5) [µg/m3] level in 2023 was 4.75. This is significantly better than average. Closest monitor was 4.5 miles away from the city center.
| City: | 4.75 |
| U.S.: | 8.11 |
Earthquake activity:
Green River-area historical earthquake activity is significantly above Wyoming state average. It is 1433% greater than the overall U.S. average.On 8/18/1959 at 06:37:13, a magnitude 7.7 (7.7 UK, Class: Major, Intensity: VIII - XII) earthquake occurred 219.5 miles away from the city center, causing $26,000,000 total damage
On 10/28/1983 at 14:06:06, a magnitude 7.3 (6.2 MB, 7.3 MS, 7.0 MW) earthquake occurred 282.6 miles away from Green River center, causing 2 deaths (2 shaking deaths) and 3 injuries, causing $15,000,000 total damage
On 10/3/1915 at 06:52:48, a magnitude 7.6 (7.6 UK) earthquake occurred 425.1 miles away from the city center
On 3/28/1975 at 02:31:05, a magnitude 6.2 (6.1 MB, 6.0 MS, 6.2 ML, Class: Strong, Intensity: VII - IX) earthquake occurred 159.1 miles away from the city center
On 2/3/1994 at 09:05:04, a magnitude 5.8 (5.4 MB, 5.5 MS, 5.8 MW, 5.8 ML, Depth: 4.9 mi, Class: Moderate, Intensity: VI - VII) earthquake occurred 116.4 miles away from the city center
On 2/3/1995 at 15:26:10, a magnitude 5.3 (5.3 MB, 4.6 MS, Depth: 0.6 mi) earthquake occurred 9.1 miles away from Green River center
Magnitude types: body-wave magnitude (MB), local magnitude (ML), surface-wave magnitude (MS), moment magnitude (MW)
Natural disasters:
The number of natural disasters in Sweetwater County (3) is a lot smaller than the US average (15).Major Disasters (Presidential) Declared: 1
Emergencies Declared: 1
Causes of natural disasters: Drought: 1, Flood: 1, Landslide: 1, Storm: 1, Other: 1 (Note: some incidents may be assigned to more than one category).
Hospitals and medical centers in Green River:
Other hospitals and medical centers near Green River:
- YOUNG AT HEART SENIOR CITIZENS CENTER (Home Health Center, about 13 miles away; ROCK SPRINGS, WY)
- MEM HOSP OF SWEETWATER COUNTY/DIALYSIS (Dialysis Facility, about 14 miles away; ROCK SPRINGS, WY)
- MEMORIAL HOSPITAL SWEETWATER COUNTY Acute Care Hospitals (about 14 miles away; ROCK SPRINGS, WY)
- SWEETWATER COUNTY COMMUNITY NURSING SERVICE (Home Health Center, about 14 miles away; ROCK SPRINGS, WY)
- HOSPICE OF SWEETWATER COUNTY (Hospital, about 14 miles away; ROCK SPRINGS, WY)
- SAGE VIEW CARE CENTER (Nursing Home, about 14 miles away; ROCK SPRINGS, WY)
Airports located in Green River:
- Gtr Green River Intergalactic Spaceport Airport (48U) (Runways: 1, Local Ops: 175)
Colleges/universities with over 2000 students nearest to Green River:
- Western Wyoming Community College (about 13 miles; Rock Springs, WY; Full-time enrollment: 2,086)
- Utah State University (about 123 miles; Logan, UT; FT enrollment: 21,131)
- Weber State University (about 131 miles; Ogden, UT; FT enrollment: 17,655)
- University of Utah (about 135 miles; Salt Lake City, UT; FT enrollment: 28,454)
- Westminster College (about 136 miles; Salt Lake City, UT; FT enrollment: 2,870)
- Latter-day Saints Business College (about 137 miles; Salt Lake City, UT; FT enrollment: 2,059)
- Western Governors University (about 138 miles; Salt Lake City, UT; FT enrollment: 31,481)
Public high schools in Green River:
- GREEN RIVER HIGH SCHOOL (Students: 759, Location: 1615 HITCHING POST DRIVE, Grades: 9-12)
- EXPEDITION ACADEMY (Students: 53, Location: 351 MONROE AVE, Grades: 9-12)
Private high school in Green River:
Public elementary/middle schools in Green River:
- LINCOLN MIDDLE SCHOOL (Students: 433, Location: 350 MONROE AVE, Grades: 7-8)
- MONROE INTERMEDIATE SCHOOL (Students: 342, Location: 250 MONROE AVE, Grades: 5-6)
- TRUMAN ELEMENTARY (Students: 281, Location: 1055 WEST TETON BOULEVARD, Grades: KG-4)
- WASHINGTON ELEMENTARY (Students: 241, Location: 750 WEST 5TH NORTH, Grades: KG-4)
- HARRISON ELEMENTARY (Students: 221, Location: 1825 ALABAMA DRIVE, Grades: KG-4)
- JACKSON ELEMENTARY (Location: 2200 EAST TETON BOULEVARD, Grades: KG-4)
Library in Green River:
Points of interest:
Notable locations in Green River: Old Stage Station (A), Granger Volunteer Fire Department (B), Green River Fire Department (C), Castle Rock Ambulance Services (D). Display/hide their locations on the map
Shopping Centers: Hutton Heights Shopping Center (1), Flaming Gorge Shopping Center (2). Display/hide their locations on the map
Cemetery: Riverview Cemetery (1). Display/hide its location on the map
Creek: Bitter Creek (A). Display/hide its location on the map
Park in Green River: Island Park (1). Display/hide its location on the map
Tourist attraction: Sweetwater County Museum (3 East Flaming Gorge Way).
Hotels: Green River Super 8 Motel (280 W Flaming Gorge Way), Western Inn (890 West Flaming Gorge Way), Super 8 Green River WY (280 West Flaming Gorge), Walker's Motel (680 West Railroad Avenue), Super 8 Motel (280 West Flaming Gorge Way), Mustang Motel (550 East Flaming Gorge Way), Oak Tree Inn (1170 West Flaming Gorge Way), Sweet Dreams Inn (1420 Uinta Drive), Flaming Gorge Motel (316 East Flaming Gorge Way).
Courts: Sweetwater County - Circuit Court (Courthouse), Sweetwater County Government - Passport- Civil- Criminal- Clerk Of District Court- Pro (Courthouse), Sweetwater County Government - Clerk Of District Court- Child Support (Courthouse), Sweetwater County Wyoming - Clerk Of District Court- Green River Office- Child Sup (Courthouse), Green River Wyoming - City Court (50 East 2nd North Street).
Birthplace of: Amy Jo Martin - Business entrepreneur, Curt Gowdy - (born 1919), sports announcer, Justin Salas - Mixed martial artist.
Drinking water stations with addresses in Green River and their reported violations in the past:
PIONEER MOBILE HOME PARK (Population served: 1,500, Purch surface water):Past monitoring violations:FMC CORPORATION (Address: 580 Westvaco Road , Population served: 900, Surface water):
- Initial Tap Sampling for Pb and Cu - In JAN-01-2008, Contaminant: Lead and Copper Rule. Follow-up actions: St Violation/Reminder Notice (JAN-30-2008), St Compliance achieved (DEC-29-2008)
- Initial Tap Sampling for Pb and Cu - In JAN-01-2007, Contaminant: Lead and Copper Rule. Follow-up actions: St Violation/Reminder Notice (AUG-31-2007), St Compliance achieved (2 times from FEB-11-2008 to DEC-29-2008)
- 2 routine major monitoring violations
Past health violations:TATA CHEMICALS (SODA ASH) PARTNERS (Population served: 701, Surface water):Past monitoring violations:
- MCL, Monthly (TCR) - In AUG-2007, Contaminant: Coliform
- Single Turbidity Exceed (Enhanced SWTR) - In FEB-2014, Contaminant: IESWTR. Follow-up actions: St Violation/Reminder Notice (MAR-10-2014), St Compliance achieved (APR-03-2014)
Past health violations:OCI WYOMING, L.P. (Population served: 450, Surface water):Past monitoring violations:
- Treatment Technique (SWTR and GWR) - In JUL-2013. Follow-up actions: St Violation/Reminder Notice (JUL-31-2013), St Compliance achieved (SEP-10-2013)
- MCL, Average - Between OCT-2011 and DEC-2011, Contaminant: Total Haloacetic Acids (HAA5). Follow-up actions: Fed FAO issued (JUN-21-2012)
- MCL, Average - Between JUL-2011 and SEP-2011, Contaminant: Total Haloacetic Acids (HAA5). Follow-up actions: Fed FAO issued (JUN-21-2012)
- MCL, Average - Between APR-2011 and JUN-2011, Contaminant: Total Haloacetic Acids (HAA5). Follow-up actions: Fed FAO issued (JUN-21-2012)
- MCL, Average - Between JUL-2005 and SEP-2005, Contaminant: Total Haloacetic Acids (HAA5). Follow-up actions: St Public Notif requested (NOV-26-2005), St Violation/Reminder Notice (NOV-26-2005), St Compliance achieved (JUL-30-2007)
- Monitoring of Treatment (SWTR-Filter) - In MAR-2009. Follow-up actions: St Violation/Reminder Notice (APR-02-2009), St Compliance achieved (APR-03-2009), Fed FAO issued (JUN-21-2012)
Past monitoring violations:FMC GRANGER (Population served: 80, Surface water):
- One routine major monitoring violation
Past health violations:ROCK SPRINGS/GREEN RIVER JP (Address: #3 TELEPHONE CANON ROAD , Population served: 25, Surface water):Past monitoring violations:
- Treatment Technique (SWTR and GWR) - In AUG-2008. Follow-up actions: St Violation/Reminder Notice (SEP-08-2008), St Compliance achieved (MAR-19-2009), Fed FAO issued (MAY-10-2012)
- Treatment Technique (SWTR and GWR) - In AUG-2007. Follow-up actions: St Violation/Reminder Notice (SEP-11-2007), Fed FAO issued (DEC-28-2007), Fed Compliance achieved (FEB-01-2010)
- Treatment Technique (SWTR and GWR) - In JUL-2007. Follow-up actions: St Violation/Reminder Notice (SEP-11-2007), Fed FAO issued (DEC-28-2007), Fed Compliance achieved (FEB-01-2010)
- MCL, Acute (TCR) - In AUG-2005, Contaminant: Coliform. Follow-up actions: Fed FAO issued (DEC-28-2007), Fed Compliance achieved (FEB-01-2010)
- Monitoring and Reporting (DBP) - Between JAN-2011 and DEC-2011, Contaminant: Total Haloacetic Acids (HAA5). Follow-up actions: Fed FAO issued (MAY-10-2012)
- Monitoring and Reporting (DBP) - Between JAN-2011 and DEC-2011, Contaminant: TTHM. Follow-up actions: Fed FAO issued (MAY-10-2012)
- Monitoring of Treatment (SWTR-Filter) - In SEP-2007. Follow-up actions: St Violation/Reminder Notice (OCT-15-2007), Fed FAO issued (DEC-28-2007), Fed Compliance achieved (FEB-01-2010), Fed FAO issued (MAY-10-2012)
- Monitoring of Treatment (SWTR-Filter) - In AUG-2007. Follow-up actions: St Violation/Reminder Notice (SEP-11-2007), Fed FAO issued (DEC-28-2007), Fed Compliance achieved (FEB-01-2010)
- Monitoring of Treatment (SWTR-Filter) - In JUL-2007. Follow-up actions: St Violation/Reminder Notice (SEP-11-2007), Fed FAO issued (DEC-28-2007), Fed Compliance achieved (FEB-01-2010)
- One regular monitoring violation
Past monitoring violations:
- Monitoring, Turbidity (Enhanced SWTR) - In MAR-2005, Contaminant: IESWTR. Follow-up actions: St Violation/Reminder Notice (APR-13-2005), St Compliance achieved (APR-14-2005)
- Monthly Turbidity Exceed (Enhanced SWTR) - In MAR-2005, Contaminant: IESWTR. Follow-up actions: St Violation/Reminder Notice (APR-13-2005), St Public Notif requested (APR-13-2005), St Compliance achieved (APR-14-2005)
Drinking water stations with addresses in Green River that have no violations reported:
- GREEN RIVER, CITY OF (Population served: 10,500, Primary Water Source Type: Purch surface water)
- JAMESTOWN-RIO VISTA W & SEWER (Population served: 560, Primary Water Source Type: Surface water)
- DESERT TRAILS MHC (Population served: 500, Primary Water Source Type: Purch surface water)
- SOLVAY CHEMICALS, INC. (Population served: 415, Primary Water Source Type: Surface water)
- ROLLING GREEN COUNTRY CLUB (Population served: 100, Primary Water Source Type: Groundwater under infl of surface water)
- WILLIAMS FIELD SERVICES-OPAL (Population served: 41, Primary Water Source Type: Purch surface water)
| This city: | 2.7 people |
| Wyoming: | 2.4 people |
| This city: | 73.4% |
| Whole state: | 64.6% |
| This city: | 6.6% |
| Whole state: | 7.1% |
Likely homosexual households (counted as self-reported same-sex unmarried-partner households)
- Lesbian couples: 0.3% of all households
- Gay men: 0.1% of all households
3 people in group homes for juveniles (non-correctional) in 2010
55 people in nursing homes in 2000
44 people in local jails and other confinement facilities (including police lockups) in 2000
Banks with branches in Green River (2011 data):
- U.S. Bank National Association: Green River Branch at 285 Uinta Drive, branch established on 1935/06/10. Info updated 2012/01/30: Bank assets: $330,470.8 mil, Deposits: $236,091.5 mil, headquarters in Cincinnati, OH, positive income, 3121 total offices, Holding Company: U.S. Bancorp
- State Bank: at #30 Shoshone Avenue, branch established on 1997/08/18. Info updated 2007/07/03: Bank assets: $38.9 mil, Deposits: $34.1 mil, local headquarters, positive income, Commercial Lending Specialization, 2 total offices
- Bank of the West: Green River Branch at 10 Shoshone Avenue, branch established on 1982/06/10. Info updated 2009/11/16: Bank assets: $62,408.3 mil, Deposits: $43,995.2 mil, headquarters in San Francisco, CA, positive income, 647 total offices, Holding Company: Bnp Paribas
- Wells Fargo Bank, National Association: Green River Branch at 125 West Flaming Gorge Way, branch established on 1883/01/01. Info updated 2011/04/05: Bank assets: $1,161,490.0 mil, Deposits: $905,653.0 mil, headquarters in Sioux Falls, SD, positive income, 6395 total offices, Holding Company: Wells Fargo & Company
For population 15 years and over in Green River:
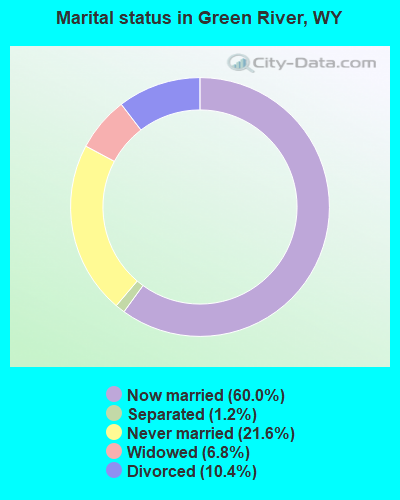
- Never married: 21.6%
- Now married: 60.0%
- Separated: 1.2%
- Widowed: 6.8%
- Divorced: 10.4%
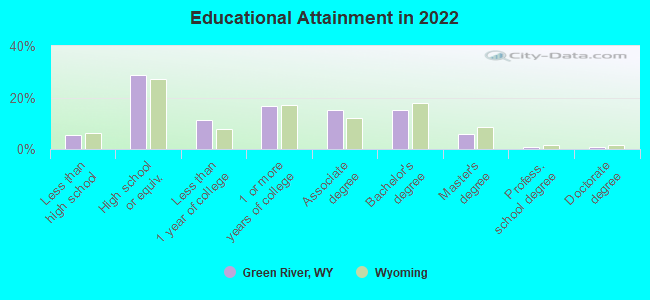
For population 25 years and over in Green River:
- High school or higher: 95.1%
- Bachelor's degree or higher: 22.3%
- Graduate or professional degree: 7.2%
- Unemployed: 5.3%
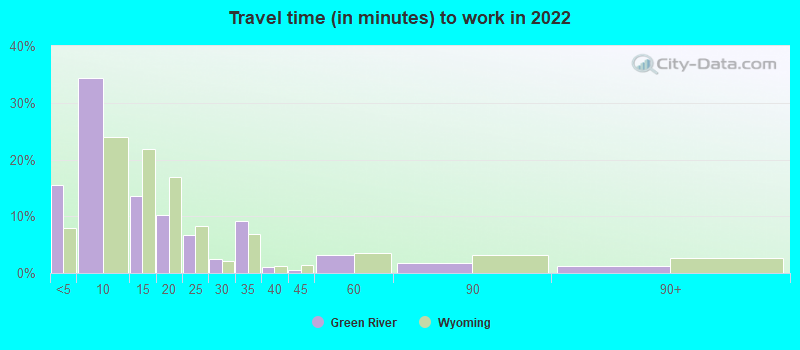
- Mean travel time to work (commute): 21.7 minutes
| Here: | 10.1 |
| Wyoming average: | 10.2 |
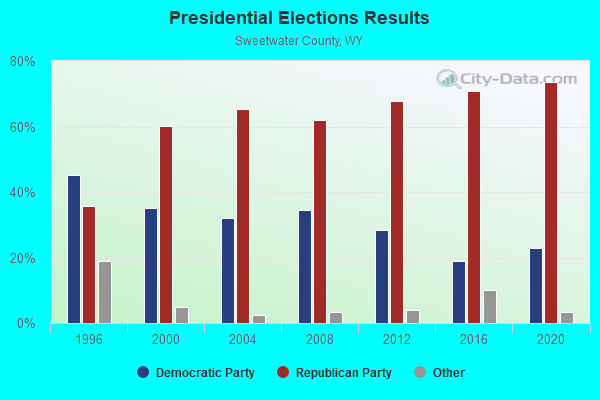
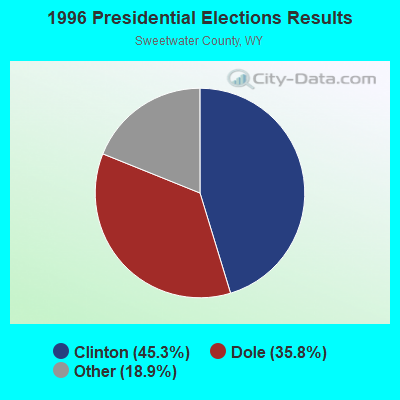
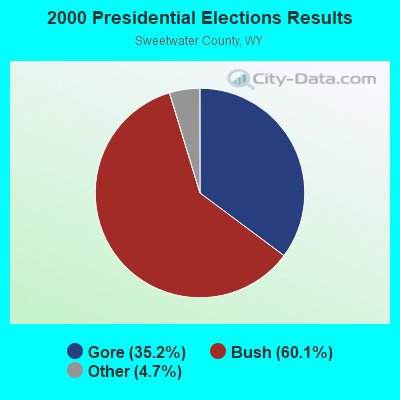
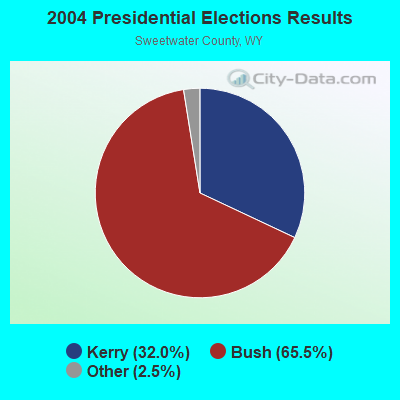
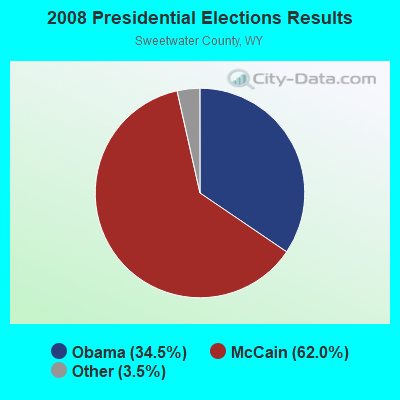
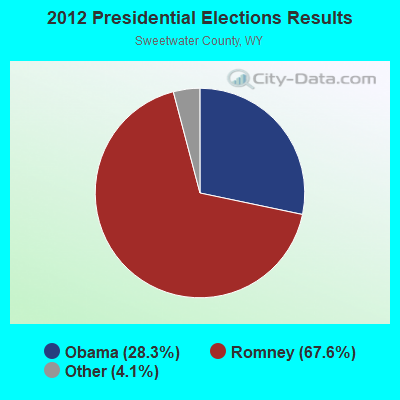
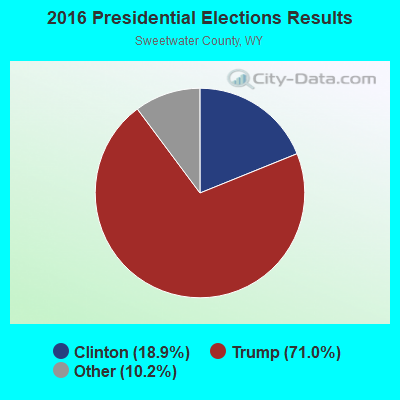
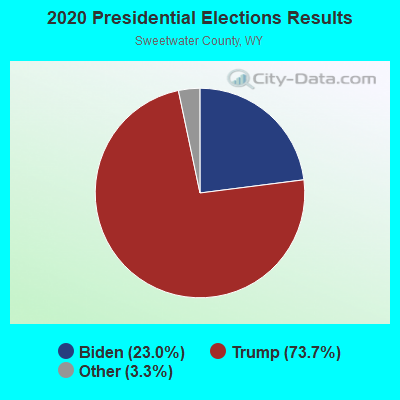
Graphs represent county-level data. Detailed 2008 Election Results
Religion statistics for Green River, WY (based on Sweetwater County data)
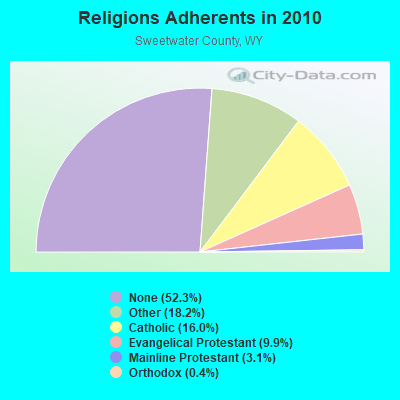
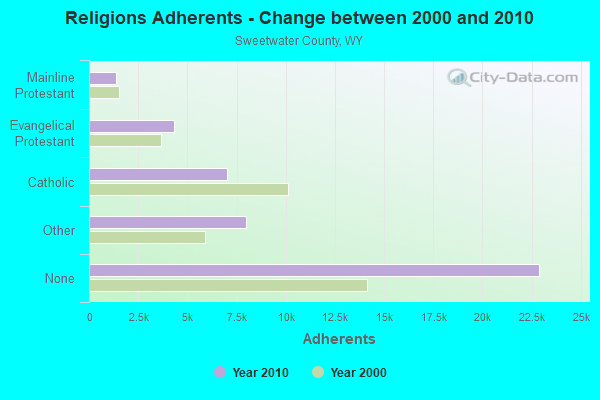
| Religion | Adherents | Congregations |
|---|---|---|
| Other | 7,993 | 17 |
| Catholic | 7,007 | 5 |
| Evangelical Protestant | 4,342 | 35 |
| Mainline Protestant | 1,368 | 8 |
| Orthodox | 195 | 1 |
| None | 22,901 | - |
Food Environment Statistics:
| Sweetwater County: | 1.52 / 10,000 pop. |
| Wyoming: | 2.10 / 10,000 pop. |
| This county: | 0.25 / 10,000 pop. |
| State: | 0.27 / 10,000 pop. |
| Sweetwater County: | 0.76 / 10,000 pop. |
| State: | 0.65 / 10,000 pop. |
| Sweetwater County: | 7.36 / 10,000 pop. |
| Wyoming: | 5.36 / 10,000 pop. |
| Sweetwater County: | 7.87 / 10,000 pop. |
| State: | 10.08 / 10,000 pop. |
| Here: | 6.1% |
| Wyoming: | 7.1% |
| Sweetwater County: | 28.7% |
| Wyoming: | 24.4% |
Health and Nutrition:
| Green River: | 49.4% |
| State: | 49.4% |
| Here: | 47.0% |
| State: | 46.6% |
| Green River: | 29.0 |
| Wyoming: | 28.8 |
| This city: | 22.2% |
| Wyoming: | 21.3% |
| Green River: | 10.2% |
| Wyoming: | 10.2% |
| Green River: | 6.8 |
| Wyoming: | 6.8 |
| This city: | 34.9% |
| Wyoming: | 34.7% |
| Green River: | 56.9% |
| Wyoming: | 56.6% |
| Green River: | 79.4% |
| Wyoming: | 78.4% |
More about Health and Nutrition of Green River, WY Residents
| Local government employment and payroll (March 2022) | |||||
| Function | Full-time employees | Monthly full-time payroll | Average yearly full-time wage | Part-time employees | Monthly part-time payroll |
|---|---|---|---|---|---|
| Police Protection - Officers | 25 | $157,820 | $75,754 | 0 | $0 |
| Parks and Recreation | 14 | $74,245 | $63,639 | 72 | $42,481 |
| Other and Unallocable | 14 | $79,974 | $68,549 | 0 | $0 |
| Other Government Administration | 11 | $59,714 | $65,143 | 7 | $7,500 |
| Sewerage | 6 | $42,614 | $85,228 | 1 | $1,888 |
| Streets and Highways | 6 | $34,717 | $69,434 | 0 | $0 |
| Police - Other | 5 | $25,185 | $60,444 | 17 | $9,471 |
| Financial Administration | 5 | $32,160 | $77,184 | 2 | $2,728 |
| Water Supply | 3 | $14,506 | $58,024 | 0 | $0 |
| Judicial and Legal | 3 | $18,184 | $72,736 | 1 | $1,623 |
| Fire - Other | 2 | $15,521 | $93,126 | 0 | $0 |
| Firefighters | 0 | $0 | 23 | $14,680 | |
| Totals for Government | 94 | $554,640 | $70,805 | 123 | $80,371 |
Green River government finances - Expenditure in 2021 (per resident):
- Construction - Water Utilities: $510,000 ($44.21)
Regular Highways: $317,000 ($27.48)
- Current Operations - Police Protection: $4,696,000 ($407.11)
Central Staff Services: $3,501,000 ($303.51)
Parks and Recreation: $3,331,000 ($288.77)
Water Utilities: $2,287,000 ($198.27)
Regular Highways: $1,189,000 ($103.08)
Sewerage: $1,178,000 ($102.12)
Local Fire Protection: $890,000 ($77.16)
Financial Administration: $771,000 ($66.84)
Housing and Community Development: $682,000 ($59.12)
Judicial and Legal Services: $450,000 ($39.01)
Health - Other: $392,000 ($33.98)
General Public Buildings: $333,000 ($28.87)
Miscellaneous Commercial Activities - Other: $192,000 ($16.64)
General - Other: $182,000 ($15.78)
Solid Waste Management: $116,000 ($10.06)
Air Transportation: $13,000 ($1.13)
- General - Interest on Debt: $33,000 ($2.86)
- Other Capital Outlay - Parks and Recreation: $155,000 ($13.44)
Police Protection: $64,000 ($5.55)
Water Utilities: $42,000 ($3.64)
Local Fire Protection: $29,000 ($2.51)
Sewerage: $26,000 ($2.25)
General Public Building: $15,000 ($1.30)
Green River government finances - Revenue in 2021 (per resident):
- Charges - Sewerage: $2,076,000 ($179.97)
Parks and Recreation: $333,000 ($28.87)
Other: $191,000 ($16.56)
Miscellaneous Commercial Activities: $16,000 ($1.39)
- Federal Intergovernmental - Other: $1,285,000 ($111.40)
- Local Intergovernmental - General Local Government Support: $3,913,000 ($339.23)
Other: $231,000 ($20.03)
- Miscellaneous - General Revenue - Other: $477,000 ($41.35)
Fines and Forfeits: $83,000 ($7.20)
Interest Earnings: $39,000 ($3.38)
- Revenue - Water Utilities: $2,849,000 ($246.99)
- State Intergovernmental - General Local Government Support: $5,706,000 ($494.67)
Other: $1,090,000 ($94.50)
Highways: $240,000 ($20.81)
- Tax - Property: $1,101,000 ($95.45)
Public Utilities Sales: $436,000 ($37.80)
Other License: $116,000 ($10.06)
Occupation and Business License - Other: $29,000 ($2.51)
Green River government finances - Debt in 2021 (per resident):
- Long Term Debt - Outstanding Unspecified Public Purpose: $1,333,000 ($115.56)
Beginning Outstanding - Unspecified Public Purpose: $835,000 ($72.39)
Issue, Unspecified Public Purpose: $547,000 ($47.42)
Retired Unspecified Public Purpose: $50,000 ($4.33)
Green River government finances - Cash and Securities in 2021 (per resident):
- Other Funds - Cash and Securities: $25,239,000 ($2188.04)
| Businesses in Green River, WY | ||||
| Name | Count | Name | Count | |
|---|---|---|---|---|
| Ace Hardware | 1 | Lane Furniture | 1 | |
| Curves | 1 | McDonald's | 1 | |
| FedEx | 2 | Super 8 | 1 | |
| H&R Block | 1 | U-Haul | 1 | |
| Kroger | 4 | UPS | 1 | |
Strongest AM radio stations in Green River:
- KUGR (1490 AM; 1 kW; GREEN RIVER, WY; Owner: WAGONWHEEL COMMUNICATION CORP.)
- KRKK (1360 AM; 5 kW; ROCK SPRINGS, WY; Owner: BIG THICKET B/CING CO. OF WY, INC.)
- KALL (700 AM; 50 kW; NORTH SALT LAKE CITY, UT; Owner: CITICASTERS LICENSES, L.P.)
- KIQN (1010 AM; 50 kW; TOOELE, UT)
- KSL (1160 AM; 50 kW; SALT LAKE CITY, UT; Owner: BONNEVILLE HOLDING COMPANY)
- KMER (950 AM; 5 kW; KEMMERER, WY; Owner: CHAPARRAL BROADCASTING, INC.)
- KTWO (1030 AM; 50 kW; CASPER, WY; Owner: CITICASTERS LICENSES, L.P.)
- KNZZ (1100 AM; 50 kW; GRAND JUNCTION, CO; Owner: M B C GRAND BROADCASTING, INC.)
- KVEL (920 AM; 5 kW; VERNAL, UT; Owner: ASHLEY COMMUNICATIONS, INC.)
- KLTT (670 AM; 50 kW; COMMERCE CITY, CO; Owner: KLZ RADIO, INC.)
- KKZN (760 AM; 50 kW; THORNTON, CO; Owner: JACOR BROADCASTING OF COLORADO, INC.)
- KUYO (830 AM; daytime; 25 kW; EVANSVILLE, WY; Owner: WYOMING CHRISTIAN BROADCASTING COMPANY)
- KTKK (630 AM; 10 kW; SANDY, UT; Owner: UNITED BROADCASTING COMPANY)
Strongest FM radio stations in Green River:
- K232CU (94.3 FM; GREEN RIVER, WY; Owner: WESTERN INSPIRATIONAL BROADCASTERS, INC)
- KUWZ (90.5 FM; ROCK SPRINGS, WY; Owner: UNIVERSITY OF WYOMING)
- KYCS (95.1 FM; ROCK SPRINGS, WY; Owner: FAITH BROADCASTING CORPORATION)
- KFRZ (92.1 FM; GREEN RIVER, WY; Owner: WAGONWHEEL COMMUNICATIONS CORP)
- KSIT (104.5 FM; ROCK SPRINGS, WY; Owner: BIG TICKET BROADCASTING COMPANY OF W)
- KQSW (96.5 FM; ROCK SPRINGS, WY; Owner: BIG THICKET BROADCASTING CO OF WY)
- K299AG (107.7 FM; ROCK SPRINGS, WY; Owner: WESTERN INSPIRATIONAL BROADCASTERS)
TV broadcast stations around Green River:
- K25EE (Channel 25; MOUNTAIN VIEW, ETC., UT; Owner: DAGGETT COUNTY TELEVISION DEPT.)
- K35CN (Channel 35; GREEN RIVER, WY; Owner: TRINITY BROADCASTING NETWORK)
- K22BK (Channel 22; ROCK SPRINGS, ETC., WY; Owner: CENTRAL WYOMING COLLEGE)
- KGWR-TV (Channel 13; ROCK SPRINGS, WY; Owner: CHELSEY BROADCASTING COMPANY OF CASPER, LLC)
- K18ER (Channel 18; ROCK SPRINGS, WY; Owner: LOFLIN CHILDREN'S TRUST - TWO)
- K20FA (Channel 20; ROCK SPRINGS, WY; Owner: LOFLIN CHILDREN'S TRUST - TWO)
- K30EQ (Channel 30; ROCK SPRINGS, WY; Owner: LOFLIN CHILDREN'S TRUST - TWO)
- K48FE (Channel 48; ROCK SPRINGS, WY; Owner: LOFLIN CHILDREN'S TRUST - ONE)
- K56FV (Channel 56; ROCK SPRINGS, WY; Owner: LOFLIN CHILDREN'S TRUST - ONE)
- K58EW (Channel 58; ROCK SPRINGS, WY; Owner: LOFLIN CHILDREN'S TRUST - ONE)
- K64EP (Channel 64; ROCK SPRINGS, WY; Owner: LOFLIN CHILDREN'S TRUST - ONE)
- K07PJ (Channel 7; DRY LAKE, ETC., WY; Owner: UPPER BEAR RIVER TV SERVICE)
- K09MJ (Channel 9; DRY LAKE, ETC., WY; Owner: UPPER BEAR RIVER TV SERVICE)
- K11MR (Channel 11; DRY LAKE, ETC., WY; Owner: UPPER BEAR RIVER TV SERVICE)
- National Bridge Inventory (NBI) Statistics
- 26Number of bridges
- 499ft / 152mTotal length
- $3,000Total costs
- 149,496Total average daily traffic
- 47,940Total average daily truck traffic
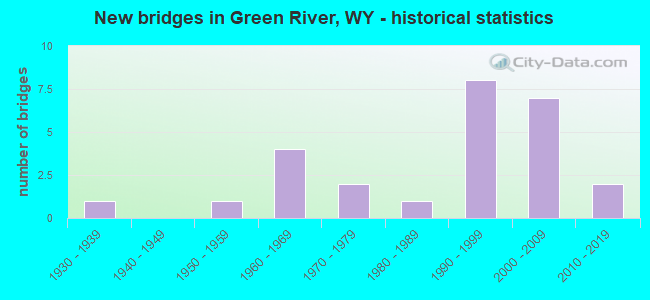
- New bridges - historical statistics
- 11930-1939
- 11950-1959
- 41960-1969
- 21970-1979
- 11980-1989
- 81990-1999
- 72000-2009
- 22010-2019
FCC Registered Antenna Towers: 52 (See the full list of FCC Registered Antenna Towers)
FCC Registered Commercial Land Mobile Towers: 1 (See the full list of FCC Registered Commercial Land Mobile Towers in Green River, WY)
FCC Registered Private Land Mobile Towers: 1 (See the full list of FCC Registered Private Land Mobile Towers)
FCC Registered Broadcast Land Mobile Towers: 42 (See the full list of FCC Registered Broadcast Land Mobile Towers)
FCC Registered Microwave Towers: 93 (See the full list of FCC Registered Microwave Towers in this town)
FCC Registered Paging Towers: 1 (See the full list of FCC Registered Paging Towers)
FCC Registered Amateur Radio Licenses: 71 (See the full list of FCC Registered Amateur Radio Licenses in Green River)
FAA Registered Aircraft: 14 (See the full list of FAA Registered Aircraft in Green River)
2002 - 2018 National Fire Incident Reporting System (NFIRS) incidents
- Fire incident types reported to NFIRS in Green River, WY
- 18835.5%Outside Fires
- 16130.4%Mobile Property/Vehicle Fires
- 16030.2%Structure Fires
- 203.8%Other
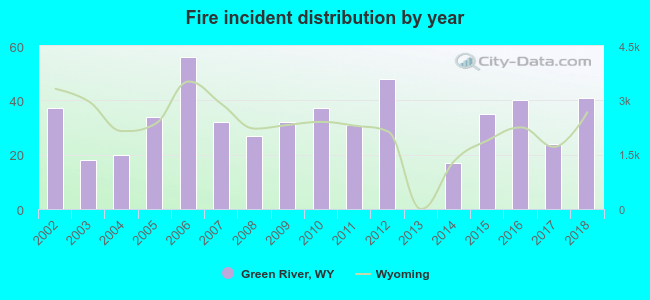 According to the data from the years 2002 - 2018 the average number of fire incidents per year is 31. The highest number of reported fires - 56 took place in 2006, and the least - 0 in 2013. The data has a rising trend.
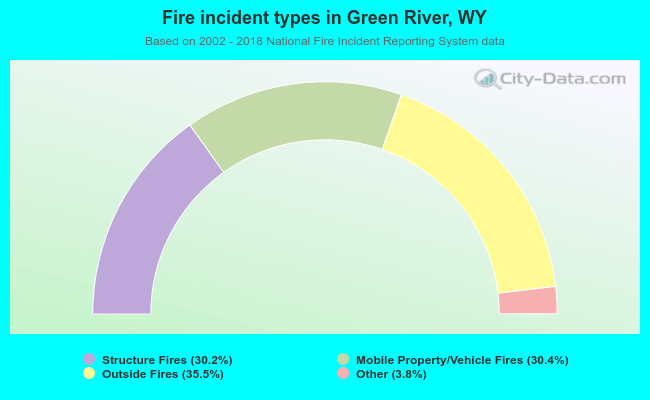 When looking into fire subcategories, the most reports belonged to: Outside Fires (35.5%), and Mobile Property/Vehicle Fires (30.4%).
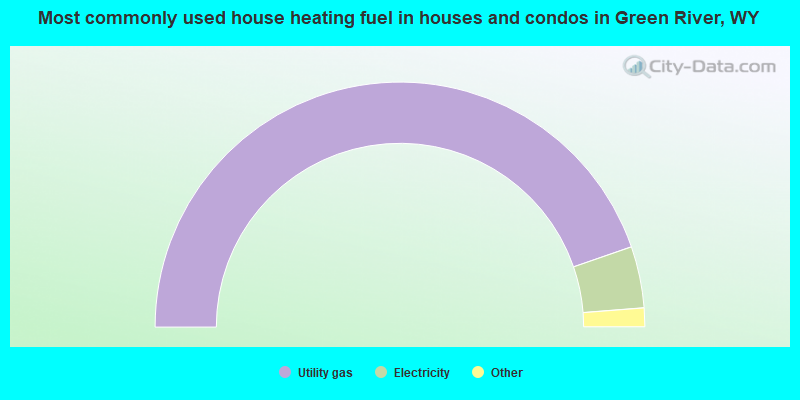
- 89.5%Utility gas
- 8.1%Electricity
- 1.1%Wood
- 0.7%Bottled, tank, or LP gas
- 0.6%Other fuel
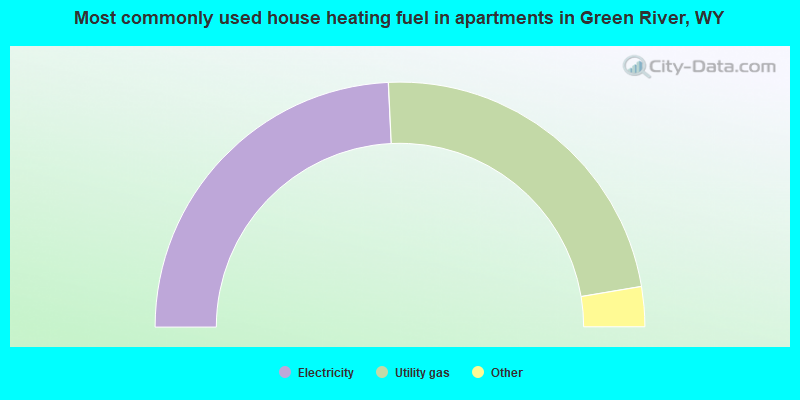
- 48.6%Electricity
- 46.3%Utility gas
- 2.6%Bottled, tank, or LP gas
- 1.5%Other fuel
- 1.0%No fuel used
Green River compared to Wyoming state average:
- Unemployed percentage below state average.
- Black race population percentage significantly below state average.
- Median age significantly below state average.
- Length of stay since moving in significantly above state average.
Green River on our top lists:
- #20 on the list of "Top 101 cities with largest percentage of males in industries: mining, quarrying, and oil and gas extraction (population 5,000+)"
- #21 on the list of "Top 101 cities with largest percentage of females in industries: mining, quarrying, and oil and gas extraction (population 5,000+)"
- #54 on the list of "Top 101 cities with the most local government spending on highway construction per resident (population 10,000+)"
- #57 on the list of "Top 101 cities with the most local government spending on current operations of parks and recreation per resident (population 10,000+)"
- #65 on the list of "Top 101 cities with the most full-time park and recreation workers per 1000 residents (population 5,000+)"
- #68 on the list of "Top 100 highest located cities (pop. 5,000+)"
- #4 on the list of "Top 101 counties with the lowest Nitrogen Dioxide air pollution readings in 2012 (ppm)"
- #39 on the list of "Top 101 counties with the highest percentage of residents that drank alcohol in the past 30 days"
- #39 on the list of "Top 101 counties with the highest percentage of residents that smoked 100+ cigarettes in their lives"
- #60 on the list of "Top 101 counties with the lowest percentage of residents that visited a dentist within the past year"
- #60 on the list of "Top 101 counties with the lowest Sulfur Oxides Annual air pollution readings in 2012 (µg/m3)"

|
|
Total of 31 patent applications in 2008-2024.