Estimated zip code population in 2022: 6,264 Zip code population in 2010: 6,349 Zip code population in 2000: 5,697
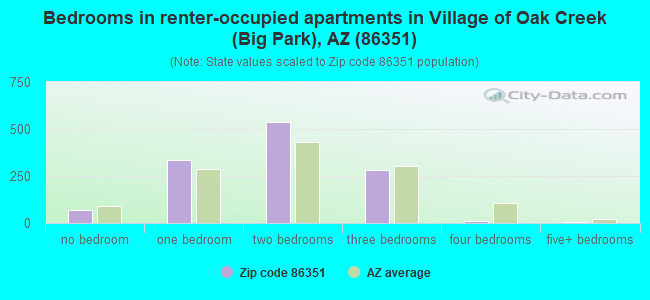
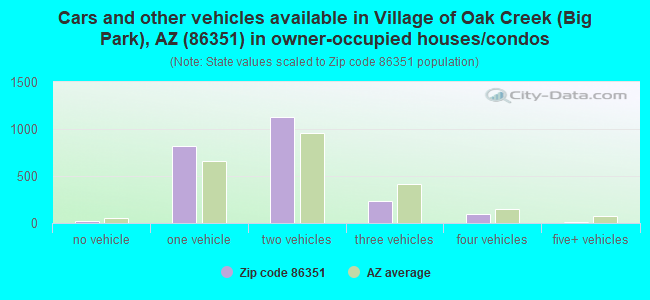
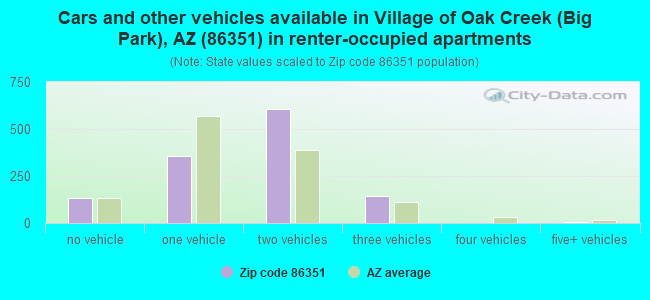
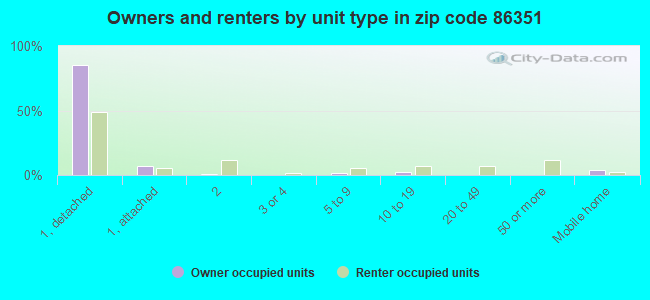
Houses and condos: 4,698 Renter-occupied apartments: 1,245
% of renters here:
35%
State:
33%
March 2022 cost of living index in zip code 86351: 98.3 (near average, U.S. average is 100)
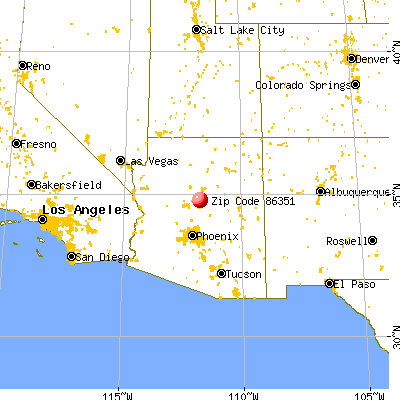
Land area: 40.0 sq. mi. Water area: 0.0 sq. mi.
Population density: 157 people per square mile
(very low).
OSM Map
General Map
Google Map
MSN Map
OSM Map
General Map
Google Map
MSN Map
OSM Map
General Map
Google Map
MSN Map
OSM Map
General Map
Google Map
MSN Map
Please wait while loading the map...
Real estate property taxes paid for housing units in 2022:
This zip code:
0.5% ($3,366)
Arizona:
0.4% ($1,786)
Median real estate property taxes paid for housing units with mortgages in 2022: $3,359 (0.4%) Median real estate property taxes paid for housing units with no mortgage in 2022: $3,367 (0.4%)
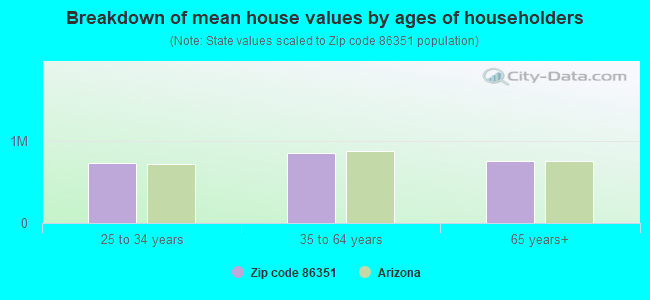
Estimated median house/condo value in 2022: $743,062
86351:
$743,062
Arizona:
$402,800
According to our research of Arizona and other state lists, there was 1 registered sex offender living in 86351 zip code as of June 01, 2024. The ratio of all residents to sex offenders in zip code 86351 is 6,473 to 1. The ratio of registered sex offenders to all residents in this zip code is much lower than the state average.
Median resident age:
This zip code:
67.0 years
Arizona median age:
38.8 years
Average household size:
This zip code:
1.7 people
Arizona:
2.5 people
Averages for the 2020 tax year for zip code 86351, filed in 2021:
Average Adjusted Gross Income (AGI) in 2020: $110,162 (Individual Income Tax Returns)
Here:
$110,162
State:
$73,499
Salary/wage: $63,575 (reported on 51.1% of returns)
Here:
$63,575
State:
$59,499
(% of AGI for various income ranges: 949.8% for AGIs below $25k, 3065.5% for AGIs $25k-50k, 4616.0% for AGIs $50k-75k, 5871.2% for AGIs $75k-100k, 9736.9% for AGIs $100k-200k, 61814.3% for AGIs over 200k)
Taxable interest for individuals: $3,197 (reported on 54.3% of returns)
This zip code:
$3,197
Arizona:
$2,325
(% of AGI for various income ranges: 56.5% for AGIs below $25k, 150.0% for AGIs $25k-50k, 248.5% for AGIs $50k-75k, 288.1% for AGIs $75k-100k, 555.8% for AGIs $100k-200k, 3250.0% for AGIs over 200k)
Ordinary dividends: $13,189 (reported on 45.3% of returns)
Here:
$13,189
State:
$8,711
(% of AGI for various income ranges: 151.1% for AGIs below $25k, 297.4% for AGIs $25k-50k, 638.5% for AGIs $50k-75k, 1045.0% for AGIs $75k-100k, 1901.2% for AGIs $100k-200k, 12982.9% for AGIs over 200k)
Net capital gain/loss in AGI: +$41,952 (reported on 43.4% of returns)
Here:
+$41,952
State:
+$31,332
(% of AGI for various income ranges: 154.2% for AGIs $25k-50k, 456.0% for AGIs $50k-75k, 958.8% for AGIs $75k-100k, 2532.7% for AGIs $100k-200k, 67334.3% for AGIs over 200k)
Profit/loss from business: +$19,223 (reported on 20.9% of returns)
Here:
+$19,223
State:
+$13,214
(% of AGI for various income ranges: 212.4% for AGIs below $25k, 379.0% for AGIs $25k-50k, 651.0% for AGIs $50k-75k, 750.6% for AGIs $75k-100k, 1505.0% for AGIs $100k-200k, 5610.0% for AGIs over 200k)
Taxable individual retirement arrangement distribution: $33,412 (reported on 28.3% of returns)
86351:
$33,412
Arizona:
$23,364
(% of AGI for various income ranges: 277.4% for AGIs below $25k, 365.8% for AGIs $25k-50k, 1076.0% for AGIs $50k-75k, 1962.5% for AGIs $75k-100k, 4122.7% for AGIs $100k-200k, 15688.6% for AGIs over 200k)
Self-employed (Keogh) retirement plans: $23,067 (reported on 1.0% of returns)
86351:
$23,067
Arizona:
$26,938
(% of AGI for various income ranges: 266.2% for AGIs $100k-200k)
Total itemized deductions: $40,825 (reported on 19.0% of returns)
Here:
$40,825
State:
$36,308
(% of AGI for various income ranges: 305.7% for AGIs below $25k, 475.5% for AGIs $25k-50k, 1043.0% for AGIs $50k-75k, 1450.0% for AGIs $75k-100k, 2446.2% for AGIs $100k-200k, 14915.7% for AGIs over 200k)
Charity contributions: $10,894 (reported on 16.7% of returns)
Here:
$10,894
State:
$11,955
(% of AGI for various income ranges: 14.3% for AGIs below $25k, 66.5% for AGIs $25k-50k, 85.0% for AGIs $50k-75k, 281.9% for AGIs $75k-100k, 579.2% for AGIs $100k-200k, 4665.7% for AGIs over 200k)
Taxes paid: $7,412 (reported on 19.0% of returns)
86351:
$7,412
State:
$6,820
(% of AGI for various income ranges: 60.4% for AGIs below $25k, 92.6% for AGIs $25k-50k, 200.0% for AGIs $50k-75k, 295.6% for AGIs $75k-100k, 568.1% for AGIs $100k-200k, 2082.9% for AGIs over 200k)
Earned income credit: $1,479 (reported on 6.1% of returns)
Here:
$1,479
State:
$2,383
(% of AGI for various income ranges: 42.8% for AGIs below $25k, 27.1% for AGIs $25k-50k)
Percentage of individuals using paid preparers for their 2020 taxes: 91.3%
Here:
91%
State:
93%
(% for various income ranges: 88.8% for AGIs below $25k, 92.9% for AGIs $25k-50k, 90.5% for AGIs $50k-75k, 88.9% for AGIs $75k-100k, 93.8% for AGIs $100k-200k, 93.8% for AGIs over 200k)
Averages for the 2012 tax year for zip code 86351, filed in 2013:
Average Adjusted Gross Income (AGI) in 2012: $72,002 (Individual Income Tax Returns)
Here:
$72,002
State:
$57,644
Salary/wage: $47,305 (reported on 57.3% of returns)
Here:
$47,305
State:
$47,932
(% of AGI for various income ranges: 55.7% for AGIs below $25k, 53.9% for AGIs $25k-50k, 38.6% for AGIs $50k-75k, 37.0% for AGIs $75k-100k, 35.1% for AGIs $100k-200k, 31.1% for AGIs over 200k)
Taxable interest for individuals: $3,107 (reported on 53.5% of returns)
This zip code:
$3,107
Arizona:
$2,064
(% of AGI for various income ranges: 4.5% for AGIs below $25k, 2.1% for AGIs $25k-50k, 2.5% for AGIs $50k-75k, 1.6% for AGIs $75k-100k, 1.9% for AGIs $100k-200k, 2.5% for AGIs over 200k)
Ordinary dividends: $9,185 (reported on 40.2% of returns)
Here:
$9,185
State:
$7,268
(% of AGI for various income ranges: 7.8% for AGIs below $25k, 5.2% for AGIs $25k-50k, 5.0% for AGIs $50k-75k, 4.6% for AGIs $75k-100k, 4.3% for AGIs $100k-200k, 5.6% for AGIs over 200k)
Net capital gain/loss in AGI: +$12,695 (reported on 39.2% of returns)
Here:
+$12,695
State:
+$15,530
(% of AGI for various income ranges: 0.4% for AGIs $25k-50k, 2.0% for AGIs $50k-75k, 1.6% for AGIs $75k-100k, 2.8% for AGIs $100k-200k, 18.1% for AGIs over 200k)
Profit/loss from business: +$12,400 (reported on 22.7% of returns)
Here:
+$12,400
State:
+$12,323
(% of AGI for various income ranges: 10.7% for AGIs below $25k, 5.8% for AGIs $25k-50k, 4.0% for AGIs $50k-75k, 3.6% for AGIs $75k-100k, 3.9% for AGIs $100k-200k, 2.2% for AGIs over 200k)
Taxable individual retirement arrangement distribution: $27,937 (reported on 27.6% of returns)
86351:
$27,937
Arizona:
$18,280
(% of AGI for various income ranges: 7.5% for AGIs below $25k, 7.5% for AGIs $25k-50k, 8.5% for AGIs $50k-75k, 10.6% for AGIs $75k-100k, 12.9% for AGIs $100k-200k, 11.5% for AGIs over 200k)
Self-employment retirement plans: $15,333 (reported on 1.0% of returns)
86351:
$15,333
Arizona:
$22,154
Total itemized deductions: $26,766 (24% of AGI, reported on 46.5% of returns)
Here:
$26,766
State:
$23,651
Here:
24.2% of AGI
State:
20.6% of AGI
(% of AGI for various income ranges: 31.4% for AGIs below $25k, 18.8% for AGIs $25k-50k, 17.1% for AGIs $50k-75k, 18.7% for AGIs $75k-100k, 16.1% for AGIs $100k-200k, 14.7% for AGIs over 200k)
Charity contributions: $4,084 (reported on 40.6% of returns)
Here:
$4,084
State:
$4,114
(% of AGI for various income ranges: 2.1% for AGIs below $25k, 1.9% for AGIs $25k-50k, 1.6% for AGIs $50k-75k, 1.9% for AGIs $75k-100k, 2.6% for AGIs $100k-200k, 2.7% for AGIs over 200k)
Taxes paid: $7,164 (reported on 46.2% of returns)
86351:
$7,164
State:
$6,509
(% of AGI for various income ranges: 5.5% for AGIs below $25k, 3.7% for AGIs $25k-50k, 3.8% for AGIs $50k-75k, 4.8% for AGIs $75k-100k, 4.4% for AGIs $100k-200k, 5.1% for AGIs over 200k)
Earned income credit: $1,746 (reported on 9.8% of returns)
Here:
$1,746
State:
$2,432
(% of AGI for various income ranges: 3.0% for AGIs below $25k, 0.6% for AGIs $25k-50k)
Percentage of individuals using paid preparers for their 2012 taxes: 59.4%
Here:
59%
State:
52%
(% for various income ranges: 48.5% for AGIs below $25k, 58.6% for AGIs $25k-50k, 66.7% for AGIs $50k-75k, 65.5% for AGIs $75k-100k, 65.9% for AGIs $100k-200k, 81.2% for AGIs over 200k)
Averages for the 2004 tax year for zip code 86351, filed in 2005:
Average Adjusted Gross Income (AGI) in 2004: $71,813 (Individual Income Tax Returns)
Here:
$71,813
State:
$50,097
Salary/wage: $39,239 (reported on 56.6% of returns)
Here:
$39,239
State:
$42,146
(% of AGI for various income ranges: 52.1% for AGIs $10k-25k, 46.0% for AGIs $25k-50k, 36.7% for AGIs $50k-75k, 39.1% for AGIs $75k-100k, 21.2% for AGIs over 100k)
Taxable interest for individuals: $4,133 (reported on 67.2% of returns)
This zip code:
$4,133
Arizona:
$2,374
(% of AGI for various income ranges: 6.3% for AGIs $10k-25k, 4.4% for AGIs $25k-50k, 4.5% for AGIs $50k-75k, 5.6% for AGIs $75k-100k, 2.6% for AGIs over 100k)
Taxable dividends: $5,949 (reported on 48.7% of returns)
Here:
$5,949
State:
$3,888
(% of AGI for various income ranges: 7.5% for AGIs $10k-25k, 4.6% for AGIs $25k-50k, 5.0% for AGIs $50k-75k, 3.7% for AGIs $75k-100k, 3.0% for AGIs over 100k)
Net capital gain/loss: +$16,379 (reported on 46.0% of returns)
Here:
+$16,379
State:
+$17,569
(% of AGI for various income ranges: 0.3% for AGIs $10k-25k, 1.8% for AGIs $25k-50k, 1.9% for AGIs $50k-75k, 5.3% for AGIs $75k-100k, 15.3% for AGIs over 100k)
Profit/loss from business: +$15,135 (reported on 24.2% of returns)
Here:
+$15,135
State:
+$11,088
(% of AGI for various income ranges: 6.0% for AGIs $10k-25k, 7.8% for AGIs $25k-50k, 4.1% for AGIs $50k-75k, 5.9% for AGIs $75k-100k, 5.0% for AGIs over 100k)
IRA payment deduction: $3,485 (reported on 3.9% of returns)
86351:
$3,485
Arizona:
$3,023
(% of AGI for various income ranges: 0.3% for AGIs $10k-25k, 0.4% for AGIs $25k-50k, 0.2% for AGIs $50k-75k, 0.3% for AGIs $75k-100k, 0.1% for AGIs over 100k)
Self-employed pension: $14,279 (reported on 1.6% of returns)
Here:
$14,279
Arizona:
$15,785
Total itemized deductions: $21,791 (19% of AGI, reported on 52.4% of returns)
Here:
$21,791
State:
$19,781
Here:
18.9% of AGI
State:
21.8% of AGI
(% of AGI for various income ranges: 32.6% for AGIs $10k-25k, 24.5% for AGIs $25k-50k, 21.8% for AGIs $50k-75k, 20.6% for AGIs $75k-100k, 9.6% for AGIs over 100k)
Charity contributions deductions: $3,108 (3% of AGI, reported on 47.0% of returns)
Here:
$3,108
State:
$3,389
Here:
2.5% of AGI
State:
3.5% of AGI
(% of AGI for various income ranges: 2.3% for AGIs $10k-25k, 2.2% for AGIs $25k-50k, 2.7% for AGIs $50k-75k, 2.6% for AGIs $75k-100k, 1.6% for AGIs over 100k)
Total tax: $12,951 (reported on 79.5% of returns)
86351:
$12,951
State:
$8,323
(% of AGI for various income ranges: 4.0% for AGIs $10k-25k, 7.4% for AGIs $25k-50k, 9.1% for AGIs $50k-75k, 10.6% for AGIs $75k-100k, 17.5% for AGIs over 100k)
Earned income credit: $1,314 (reported on 7.9% of returns)
Here:
$1,314
State:
$1,786
Percentage of individuals using paid preparers for their 2004 taxes: 66.9%
Here:
67%
State:
60%
(% for various income ranges: 57.7% for AGIs below $10k, 61.0% for AGIs $10k-25k, 69.1% for AGIs $25k-50k, 70.0% for AGIs $50k-75k, 65.9% for AGIs $75k-100k, 80.4% for AGIs over 100k)
Likely homosexual households (counted as self-reported same-sex unmarried-partner households)
Lesbian couples: 0.4% of all households
Gay men: 0.5% of all households
Household received Food Stamps/SNAP in the past 12 months: 133 Household did not receive Food Stamps/SNAP in the past 12 months: 3,421
Women who had a birth in the past 12 months: 12 (12 now married, 0 unmarried) Women who did not have a birth in the past 12 months: 604 (210 now married, 394 unmarried)
Housing units in zip code 86351 with a mortgage: 1,155 (59 second mortgage, 55 both second mortgage and home equity loan) Houses without a mortgage: 15
Median monthly owner costs for units with a mortgage: $1,813 Median monthly owner costs for units without a mortgage: $617
Residents with income below the poverty level in 2022:
This zip code:
10.3%
Whole state:
12.5%
Residents with income below 50% of the poverty level in 2022:
This zip code:
3.8%
Whole state:
6.0%
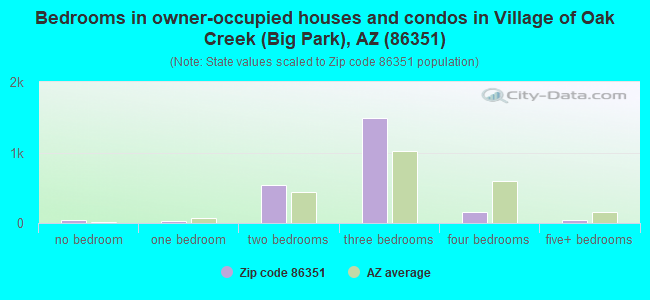
Median number of rooms in houses and condos:
Here:
5.8
State:
6.0
Median number of rooms in apartments:
Here:
4.4
State:
4.1
Notable locations in this zip code not listed on our city pages
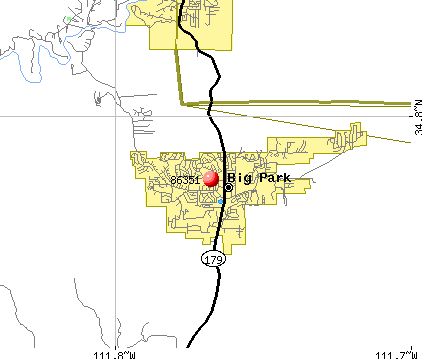
Notable locations in zip code 86351: Big Park Water Improvement District Wastewater Treatment Plant (A), Sedona Fire District Station 3 (B). Display/hide their locations on the map
Reservoirs: Beaverhead Tank Number One (A), Bell Canyon Tank (B), Speeds Tank (C), John Lee Tank (D), Stud Horse Tank (E), Corral Tank (F), Indian Tank (G), Corner Tank (H). Display/hide their locations on the map
136 married couples with children.
45 single-parent households (7 men, 38 women).
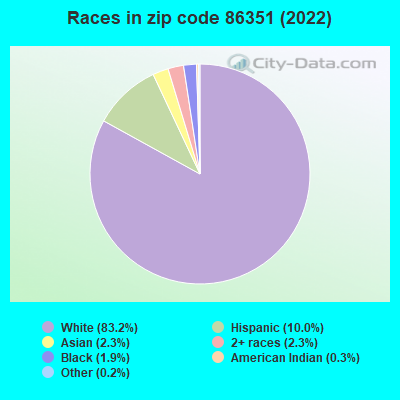
87.7% of residents of 86351 zip code speak English at home.
9.3% of residents speak Spanish at home (55% very well, 13% well, 31% not well).
2.1% of residents speak other Indo-European language at home (100% very well).
1.9% of residents speak Asian or Pacific Island language at home (76% very well, 24% not well).
0.6% of residents speak other language at home (100% very well).
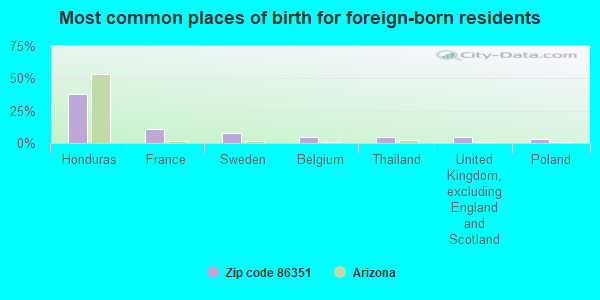
Foreign born population: 718 (11.5%) (47.2% of them are naturalized citizens)
This zip code:
11.5%
Whole state:
13.1%
38%Honduras
11%France
8%Sweden
5%Belgium
5%Thailand
4%United Kingdom, excluding England and Scotland
3%Poland
13%English
8%German
7%Scotch-Irish
6%American
6%Italian
5%Irish
4%Northern European
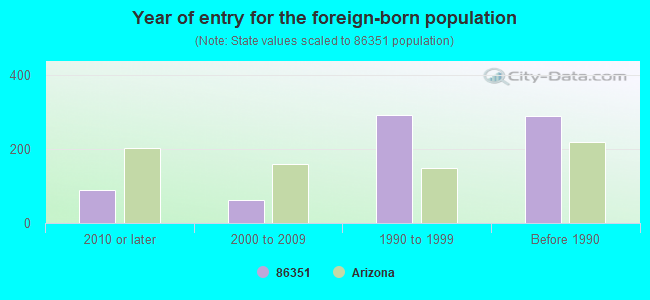
Year of entry for the foreign-born population
882010 or later
622000 to 2009
2921990 to 1999
290Before 1990
Facilities with environmental interests located in this zip code:
BIG PARK WATER IMPROVEMENT DISTRICT - WILD HORSE MESA DR (100 HUTSON LANE in SEDONA, AZ)
STATE MASTER (Arizona's Tracking Of The Environment) - AZURITE-9528, GROUND WATER PROGRAM, WASTE WATER PROGRAM, National Pollutant Discharge Elimination System Permit, WASTE National Pollutant Discharge Elimination System NON-MAJOR (Tracking pollutant discharge elimination systems) - permit National Pollutant Discharge Elimination System NON-MAJOR (Tracking pollutant discharge elimination systems) - permit Business SIC classification: SEWERAGE SYSTEMS Organizations: BIG PARK IMPROVEMENT DISTRICT (CONTACT/GENERAL)
, BIG PARK IMPROVEMENT DIST (CONTACT/OWNER)
Alternative names: BIG PARK IMPROVEMENT DIST, BIG PARK IMPROVEMENT DISTRICT, BIG PARK WATER IMPROVEMENT DISTRICT WASTE WATER TREATMENT PLANT, BIG PARK WATER IMPROVEMENT DISTRICT WWTP, WILD HORSE MESA DRIVE WWTP
BIG PARK COMMUNITY SCHOOL (25 W SADDLEHORN CT in SEDONA, AZ)
(National Center for Education Statistics) - STATE ID-130 Organizations: SEDONA-OAK CREEK JOINT UNIFIED DISTRICT (SCHOOL DISTRICT)
VERDE VALLEY ASSOC HH HAZ WASTE DAY (125 SLIDE ROCK RD in SEDONA, AZ)
(Resource Conservation and Recovery Act (tracking hazardous waste)) Organizations: SEDONA FIRE DISTRICT (CONTACT/OWNER)
Housing units lacking complete plumbing facilities: 1.4% Housing units lacking complete kitchen facilities: 2.3%
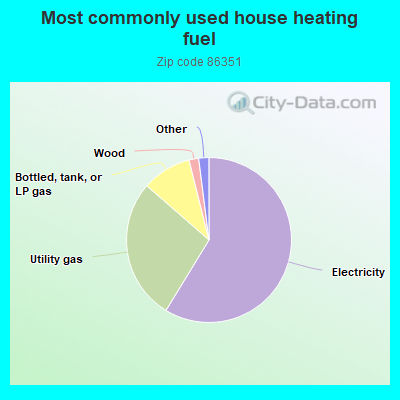
58.8%Electricity
27.7%Utility gas
9.7%Bottled, tank, or LP gas
1.9%Wood
0.8%Other fuel
0.6%Fuel oil, kerosene, etc.
Place of birth for U.S.-born residents:
This state: 690
Northeast: 1,080
Midwest: 1,684
South: 489
West: 1,524
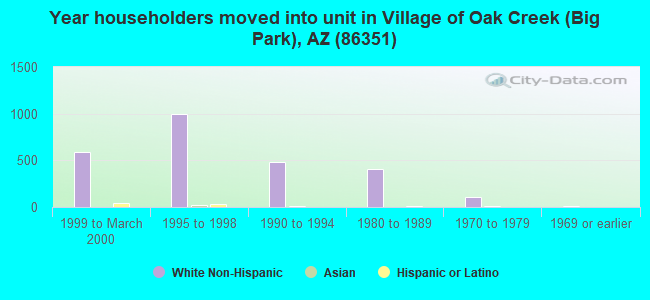
41% of the 86351 zip code residents lived in the same house 5 years ago. Out of people who lived in different houses, 30% lived in this county. Out of people who lived in different counties, 50% lived in Arizona.
89% of the 86351 zip code residents lived in the same house 1 year ago. Out of people who lived in different houses, 39% moved from this county. Out of people who lived in different houses, 11% moved from different county within same state. Out of people who lived in different houses, 55% moved from different state.
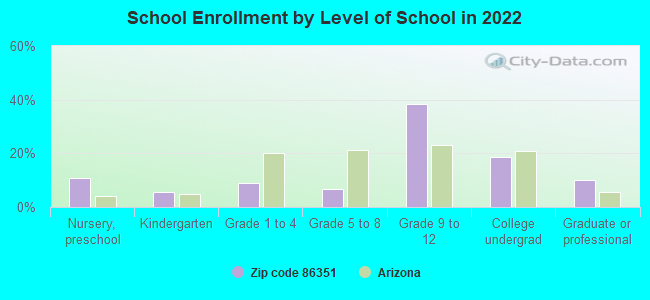
Private vs. public school enrollment:
Students in private schools in grades 1 to 8 (elementary and middle school):
Here:
0.0%
Arizona:
10.4%
Students in private schools in grades 9 to 12 (high school):
Here:
0.0%
Arizona:
8.8%
Students in private undergraduate colleges: 18
Here:
23.1%
Arizona:
13.1%
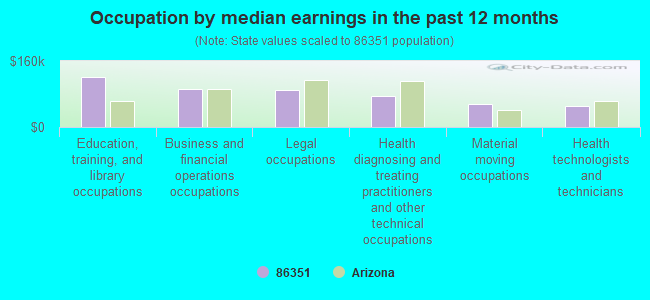
Occupation by median earnings in the past 12 months ($)
121,222Education, training, and library occupations
91,732Business and financial operations occupations
90,040Legal occupations
75,889Health diagnosing and treating practitioners and other technical occupations
56,805Material moving occupations
49,809Health technologists and technicians
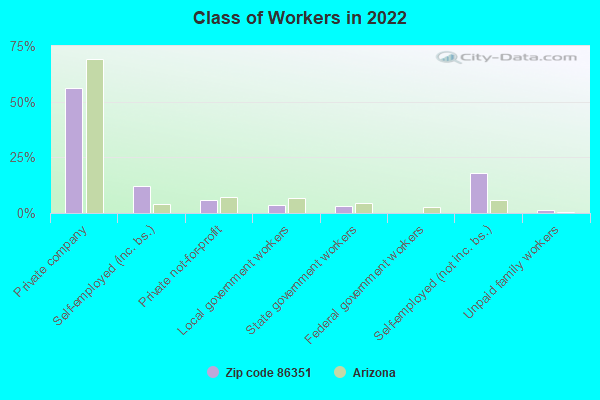
Top industries in this zip code by the number of employees in 2005:
Educational Services: Elementary and Secondary Schools (50-99: 1)
Other Services (except Public Administration): Other Similar Organizations (except Business, Professional, Labor, and Political Organizations) (20-49: 1, 10-19: 1, 1-4: 3)
Construction: New Single-Family Housing Construction (except Operative Builders) (5-9: 3, 1-4: 13)
Construction: Water and Sewer Line and Related Structures Construction (20-49: 1, 1-4: 1)
People in group quarters in 2010:
103 people in nursing facilities/skilled-nursing facilities
52 people in workers' group living quarters and job corps centers
People in group quarters in 2000:
108 people in nursing homes
Home Mortgage Disclosure Act Aggregated Statistics For Year 2009 (Based on 2 partial tracts)
A) FHA, FSA/RHS & VA Home Purchase Loans
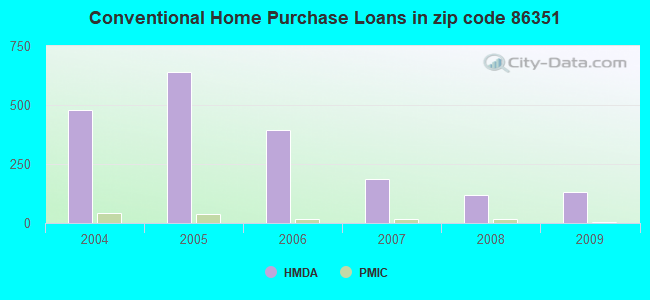
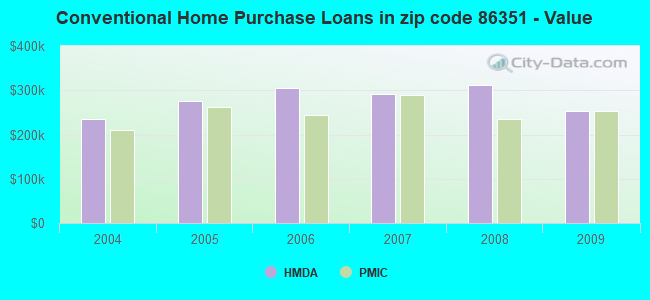
B) Conventional Home Purchase Loans
C) Refinancings
D) Home Improvement Loans
F) Non-occupant Loans on < 5 Family Dwellings (A B C & D)
G) Loans On Manufactured Home Dwelling (A B C & D)
Number
Average Value
Number
Average Value
Number
Average Value
Number
Average Value
Number
Average Value
Number
Average Value
LOANS ORIGINATED
19
$210,061
133
$253,544
346
$252,587
10
$155,544
150
$259,643
12
$145,772
APPLICATIONS APPROVED, NOT ACCEPTED
1
$167,170
15
$242,226
36
$246,767
2
$314,965
9
$252,151
6
$78,875
APPLICATIONS DENIED
10
$197,620
19
$390,453
167
$282,259
5
$113,064
31
$267,055
8
$94,892
APPLICATIONS WITHDRAWN
4
$195,035
15
$226,289
76
$241,472
3
$155,867
24
$207,789
5
$98,366
FILES CLOSED FOR INCOMPLETENESS
1
$249,550
3
$315,770
27
$264,923
2
$70,665
6
$307,292
1
$121,950
Aggregated Statistics For Year 2008 (Based on 2 partial tracts)
A) FHA, FSA/RHS & VA Home Purchase Loans
B) Conventional Home Purchase Loans
C) Refinancings
D) Home Improvement Loans
F) Non-occupant Loans on < 5 Family Dwellings (A B C & D)
G) Loans On Manufactured Home Dwelling (A B C & D)
Number
Average Value
Number
Average Value
Number
Average Value
Number
Average Value
Number
Average Value
Number
Average Value
LOANS ORIGINATED
15
$212,345
119
$311,611
205
$284,630
17
$215,012
99
$311,619
29
$140,662
APPLICATIONS APPROVED, NOT ACCEPTED
0
$0
24
$291,005
41
$273,441
1
$20,190
22
$263,278
5
$128,246
APPLICATIONS DENIED
5
$232,912
27
$336,410
124
$304,615
13
$83,121
35
$311,065
19
$140,310
APPLICATIONS WITHDRAWN
2
$323,040
17
$330,926
46
$349,515
4
$217,042
11
$319,149
7
$154,944
FILES CLOSED FOR INCOMPLETENESS
1
$148,600
6
$809,080
20
$297,964
2
$141,735
6
$233,397
3
$105,257
Aggregated Statistics For Year 2007 (Based on 2 partial tracts)
A) FHA, FSA/RHS & VA Home Purchase Loans
B) Conventional Home Purchase Loans
C) Refinancings
D) Home Improvement Loans
F) Non-occupant Loans on < 5 Family Dwellings (A B C & D)
G) Loans On Manufactured Home Dwelling (A B C & D)
Number
Average Value
Number
Average Value
Number
Average Value
Number
Average Value
Number
Average Value
Number
Average Value
LOANS ORIGINATED
2
$211,995
188
$290,457
342
$309,684
23
$187,714
135
$296,431
43
$125,366
APPLICATIONS APPROVED, NOT ACCEPTED
1
$130,830
34
$338,669
82
$291,376
10
$170,727
28
$313,464
6
$132,985
APPLICATIONS DENIED
3
$162,060
52
$375,301
211
$331,939
24
$224,445
51
$376,690
38
$133,403
APPLICATIONS WITHDRAWN
0
$0
16
$292,604
69
$310,341
13
$140,522
12
$375,736
10
$106,765
FILES CLOSED FOR INCOMPLETENESS
0
$0
2
$298,005
19
$310,331
2
$333,135
2
$488,195
3
$121,140
Aggregated Statistics For Year 2006 (Based on 2 partial tracts)
A) FHA, FSA/RHS & VA Home Purchase Loans
B) Conventional Home Purchase Loans
C) Refinancings
D) Home Improvement Loans
F) Non-occupant Loans on < 5 Family Dwellings (A B C & D)
G) Loans On Manufactured Home Dwelling (A B C & D)
Number
Average Value
Number
Average Value
Number
Average Value
Number
Average Value
Number
Average Value
Number
Average Value
LOANS ORIGINATED
4
$158,088
392
$304,305
409
$294,713
38
$199,775
250
$314,822
53
$134,580
APPLICATIONS APPROVED, NOT ACCEPTED
0
$0
39
$295,105
64
$304,718
11
$127,675
27
$301,654
10
$137,938
APPLICATIONS DENIED
2
$167,175
65
$301,806
187
$285,048
30
$138,746
41
$348,233
44
$120,277
APPLICATIONS WITHDRAWN
2
$117,505
48
$307,898
138
$287,078
10
$216,033
33
$345,090
6
$111,315
FILES CLOSED FOR INCOMPLETENESS
0
$0
16
$280,439
37
$306,059
2
$201,090
6
$253,855
2
$114,680
Aggregated Statistics For Year 2005 (Based on 2 partial tracts)
A) FHA, FSA/RHS & VA Home Purchase Loans
B) Conventional Home Purchase Loans
C) Refinancings
D) Home Improvement Loans
E) Loans on Dwellings For 5+ Families
F) Non-occupant Loans on < 5 Family Dwellings (A B C & D)
G) Loans On Manufactured Home Dwelling (A B C & D)
Number
Average Value
Number
Average Value
Number
Average Value
Number
Average Value
Number
Average Value
Number
Average Value
Number
Average Value
LOANS ORIGINATED
1
$290,740
638
$276,192
465
$263,043
33
$180,144
1
$742,990
376
$256,510
65
$106,889
APPLICATIONS APPROVED, NOT ACCEPTED
0
$0
57
$291,473
48
$242,095
6
$99,065
0
$0
27
$289,809
10
$119,444
APPLICATIONS DENIED
3
$143,483
115
$280,637
172
$218,836
24
$91,360
0
$0
54
$261,214
42
$97,431
APPLICATIONS WITHDRAWN
2
$164,345
65
$229,570
139
$215,286
10
$257,544
0
$0
42
$203,169
19
$107,411
FILES CLOSED FOR INCOMPLETENESS
1
$129,220
11
$269,371
77
$239,217
4
$167,375
0
$0
11
$246,392
8
$135,475
Aggregated Statistics For Year 2004 (Based on 2 partial tracts)
A) FHA, FSA/RHS & VA Home Purchase Loans
B) Conventional Home Purchase Loans
C) Refinancings
D) Home Improvement Loans
F) Non-occupant Loans on < 5 Family Dwellings (A B C & D)
G) Loans On Manufactured Home Dwelling (A B C & D)
Detailed PMIC statistics for the following Tracts:0017.00
2003 - 2018 National Fire Incident Reporting System (NFIRS) incidents
According to the data from the years 2003 - 2018 the average number of fire incidents per year is 8. The highest number of reported fire incidents - 22 took place in 2005, and the least - 0 in 2006. The data has a growing trend.
When looking into fire subcategories, the most incidents belonged to: Structure Fires (47.2%), and Outside Fires (31.2%).
Fire incident types reported to NFIRS in Zip Code 86351


 Nearest zip codes: 86325, 86335, 86336, 86017, 86326, 86322.


 According to the data from the years 2003 - 2018 the average number of fire incidents per year is 8. The highest number of reported fire incidents - 22 took place in 2005, and the least - 0 in 2006. The data has a growing trend.
 When looking into fire subcategories, the most incidents belonged to: Structure Fires (47.2%), and Outside Fires (31.2%).