Estimated zip code population in 2022: 33,550
Zip code population in 2010: 26,507
Zip code population in 2000: 20,891
Houses and condos: 10,724
Renter-occupied apartments: 1,451
% of renters here:
14%State:
29%
March 2022 cost of living index in zip code 84414: 89.1
(less than average, U.S. average is 100)
Land area: 16.3
sq. mi.
Water area: 0.0
sq. mi.
Population density: 2,060 people per square mile (low).
OSM Map
General Map
Google Map
MSN Map
OSM Map
General Map
Google Map
MSN Map
OSM Map
General Map
Google Map
MSN Map
OSM Map
General Map
Google Map
MSN Map
Please wait while loading the map...
Real estate property taxes paid for housing units in 2022:
This zip code:
0.5% ($2,722)Utah:
0.5% ($2,376)
Median real estate property taxes paid for housing units with mortgages in 2022: $2,681 (0.5%)
Median real estate property taxes paid for housing units with no mortgage in 2022: $2,833 (0.6%)
Profiles of local businesses
Business Search - 14 Million verified businesses
Males: 16,077 Females: 17,470
For population 25 years and over in 84414:
High school or higher: 96.1%Bachelor's degree or higher: 37.2%Graduate or professional degree: 11.3%Unemployed: 2.4%Mean travel time to work (commute): 23.7 minutes
For population 15 years and over in 84414:
Never married: 28.4%Now married: 60.7%Separated: 0.8%Widowed: 3.3%Divorced: 6.9%
Zip code 84414 compared to state average:
Black race population percentage below state average. Foreign-born population percentage significantly below state average. Renting percentage below state average. Length of stay since moving in significantly above state average. Number of rooms per house above state average. 28,856 86.0% White 3,056 9.1% Hispanic or Latino 782 2.3% Two or more races 630 1.9% Asian 164 0.5% Black 32 0.10% American Indian 20 0.06% Some other race 6 0.02% Native Hawaiian and Other
Data:
Median household income ($)
Median household income (% change since 2000)
Household income diversity
Ratio of average income to average house value (%)
Ratio of average income to average rent
Median household income ($) - White
Median household income ($) - Black or African American
Median household income ($) - Asian
Median household income ($) - Hispanic or Latino
Median household income ($) - American Indian and Alaska Native
Median household income ($) - Multirace
Median household income ($) - Other Race
Median household income for houses/condos with a mortgage ($)
Median household income for apartments without a mortgage ($)
Races - White alone (%)
Races - White alone (% change since 2000)
Races - Black alone (%)
Races - Black alone (% change since 2000)
Races - American Indian alone (%)
Races - American Indian alone (% change since 2000)
Races - Asian alone (%)
Races - Asian alone (% change since 2000)
Races - Hispanic (%)
Races - Hispanic (% change since 2000)
Races - Native Hawaiian and Other Pacific Islander alone (%)
Races - Native Hawaiian and Other Pacific Islander alone (% change since 2000)
Races - Two or more races (%)
Races - Two or more races (% change since 2000)
Races - Other race alone (%)
Races - Other race alone (% change since 2000)
Racial diversity
Unemployment (%)
Unemployment (% change since 2000)
Unemployment (%) - White
Unemployment (%) - Black or African American
Unemployment (%) - Asian
Unemployment (%) - Hispanic or Latino
Unemployment (%) - American Indian and Alaska Native
Unemployment (%) - Multirace
Unemployment (%) - Other Race
Population density (people per square mile)
Population - Males (%)
Population - Females (%)
Population - Males (%) - White
Population - Males (%) - Black or African American
Population - Males (%) - Asian
Population - Males (%) - Hispanic or Latino
Population - Males (%) - American Indian and Alaska Native
Population - Males (%) - Multirace
Population - Males (%) - Other Race
Population - Females (%) - White
Population - Females (%) - Black or African American
Population - Females (%) - Asian
Population - Females (%) - Hispanic or Latino
Population - Females (%) - American Indian and Alaska Native
Population - Females (%) - Multirace
Population - Females (%) - Other Race
Coronavirus confirmed cases (Jun 08, 2024)
Deaths caused by coronavirus (Jun 08, 2024)
Coronavirus confirmed cases (per 100k population) (Jun 08, 2024)
Deaths caused by coronavirus (per 100k population) (Jun 08, 2024)
Daily increase in number of cases (Jun 08, 2024)
Weekly increase in number of cases (Jun 08, 2024)
Cases doubled (in days) (Jun 08, 2024)
Hospitalized patients (Apr 18, 2022)
Negative test results (Apr 18, 2022)
Total test results (Apr 18, 2022)
COVID Vaccine doses distributed (per 100k population) (Sep 19, 2023)
COVID Vaccine doses administered (per 100k population) (Sep 19, 2023)
COVID Vaccine doses distributed (Sep 19, 2023)
COVID Vaccine doses administered (Sep 19, 2023)
Likely homosexual households (%)
Likely homosexual households (% change since 2000)
Likely homosexual households - Lesbian couples (%)
Likely homosexual households - Lesbian couples (% change since 2000)
Likely homosexual households - Gay men (%)
Likely homosexual households - Gay men (% change since 2000)
Cost of living index
Median gross rent ($)
Median contract rent ($)
Median monthly housing costs ($)
Median house or condo value ($)
Median house or condo value ($ change since 2000)
Mean house or condo value by units in structure - 1, detached ($)
Mean house or condo value by units in structure - 1, attached ($)
Mean house or condo value by units in structure - 2 ($)
Mean house or condo value by units in structure by units in structure - 3 or 4 ($)
Mean house or condo value by units in structure - 5 or more ($)
Mean house or condo value by units in structure - Boat, RV, van, etc. ($)
Mean house or condo value by units in structure - Mobile home ($)
Median house or condo value ($) - White
Median house or condo value ($) - Black or African American
Median house or condo value ($) - Asian
Median house or condo value ($) - Hispanic or Latino
Median house or condo value ($) - American Indian and Alaska Native
Median house or condo value ($) - Multirace
Median house or condo value ($) - Other Race
Median resident age
Resident age diversity
Median resident age - Males
Median resident age - Females
Median resident age - White
Median resident age - Black or African American
Median resident age - Asian
Median resident age - Hispanic or Latino
Median resident age - American Indian and Alaska Native
Median resident age - Multirace
Median resident age - Other Race
Median resident age - Males - White
Median resident age - Males - Black or African American
Median resident age - Males - Asian
Median resident age - Males - Hispanic or Latino
Median resident age - Males - American Indian and Alaska Native
Median resident age - Males - Multirace
Median resident age - Males - Other Race
Median resident age - Females - White
Median resident age - Females - Black or African American
Median resident age - Females - Asian
Median resident age - Females - Hispanic or Latino
Median resident age - Females - American Indian and Alaska Native
Median resident age - Females - Multirace
Median resident age - Females - Other Race
Commute - mean travel time to work (minutes)
Travel time to work - Less than 5 minutes (%)
Travel time to work - Less than 5 minutes (% change since 2000)
Travel time to work - 5 to 9 minutes (%)
Travel time to work - 5 to 9 minutes (% change since 2000)
Travel time to work - 10 to 19 minutes (%)
Travel time to work - 10 to 19 minutes (% change since 2000)
Travel time to work - 20 to 29 minutes (%)
Travel time to work - 20 to 29 minutes (% change since 2000)
Travel time to work - 30 to 39 minutes (%)
Travel time to work - 30 to 39 minutes (% change since 2000)
Travel time to work - 40 to 59 minutes (%)
Travel time to work - 40 to 59 minutes (% change since 2000)
Travel time to work - 60 to 89 minutes (%)
Travel time to work - 60 to 89 minutes (% change since 2000)
Travel time to work - 90 or more minutes (%)
Travel time to work - 90 or more minutes (% change since 2000)
Marital status - Never married (%)
Marital status - Now married (%)
Marital status - Separated (%)
Marital status - Widowed (%)
Marital status - Divorced (%)
Median family income ($)
Median family income (% change since 2000)
Median non-family income ($)
Median non-family income (% change since 2000)
Median per capita income ($)
Median per capita income (% change since 2000)
Median family income ($) - White
Median family income ($) - Black or African American
Median family income ($) - Asian
Median family income ($) - Hispanic or Latino
Median family income ($) - American Indian and Alaska Native
Median family income ($) - Multirace
Median family income ($) - Other Race
Median year house/condo built
Median year apartment built
Year house built - Built 2005 or later (%)
Year house built - Built 2000 to 2004 (%)
Year house built - Built 1990 to 1999 (%)
Year house built - Built 1980 to 1989 (%)
Year house built - Built 1970 to 1979 (%)
Year house built - Built 1960 to 1969 (%)
Year house built - Built 1950 to 1959 (%)
Year house built - Built 1940 to 1949 (%)
Year house built - Built 1939 or earlier (%)
Average household size
Household density (households per square mile)
Average household size - White
Average household size - Black or African American
Average household size - Asian
Average household size - Hispanic or Latino
Average household size - American Indian and Alaska Native
Average household size - Multirace
Average household size - Other Race
Occupied housing units (%)
Vacant housing units (%)
Owner occupied housing units (%)
Renter occupied housing units (%)
Vacancy status - For rent (%)
Vacancy status - For sale only (%)
Vacancy status - Rented or sold, not occupied (%)
Vacancy status - For seasonal, recreational, or occasional use (%)
Vacancy status - For migrant workers (%)
Vacancy status - Other vacant (%)
Residents with income below the poverty level (%)
Residents with income below 50% of the poverty level (%)
Children below poverty level (%)
Poor families by family type - Married-couple family (%)
Poor families by family type - Male, no wife present (%)
Poor families by family type - Female, no husband present (%)
Poverty status for native-born residents (%)
Poverty status for foreign-born residents (%)
Poverty among high school graduates not in families (%)
Poverty among people who did not graduate high school not in families (%)
Residents with income below the poverty level (%) - White
Residents with income below the poverty level (%) - Black or African American
Residents with income below the poverty level (%) - Asian
Residents with income below the poverty level (%) - Hispanic or Latino
Residents with income below the poverty level (%) - American Indian and Alaska Native
Residents with income below the poverty level (%) - Multirace
Residents with income below the poverty level (%) - Other Race
Air pollution - Air Quality Index (AQI)
Air pollution - CO
Air pollution - NO2
Air pollution - SO2
Air pollution - Ozone
Air pollution - PM10
Air pollution - PM25
Air pollution - Pb
Crime - Murders per 100,000 population
Crime - Rapes per 100,000 population
Crime - Robberies per 100,000 population
Crime - Assaults per 100,000 population
Crime - Burglaries per 100,000 population
Crime - Thefts per 100,000 population
Crime - Auto thefts per 100,000 population
Crime - Arson per 100,000 population
Crime - City-data.com crime index
Crime - Violent crime index
Crime - Property crime index
Crime - Murders per 100,000 population (5 year average)
Crime - Rapes per 100,000 population (5 year average)
Crime - Robberies per 100,000 population (5 year average)
Crime - Assaults per 100,000 population (5 year average)
Crime - Burglaries per 100,000 population (5 year average)
Crime - Thefts per 100,000 population (5 year average)
Crime - Auto thefts per 100,000 population (5 year average)
Crime - Arson per 100,000 population (5 year average)
Crime - City-data.com crime index (5 year average)
Crime - Violent crime index (5 year average)
Crime - Property crime index (5 year average)
1996 Presidential Elections Results (%) - Democratic Party (Clinton)
1996 Presidential Elections Results (%) - Republican Party (Dole)
1996 Presidential Elections Results (%) - Other
2000 Presidential Elections Results (%) - Democratic Party (Gore)
2000 Presidential Elections Results (%) - Republican Party (Bush)
2000 Presidential Elections Results (%) - Other
2004 Presidential Elections Results (%) - Democratic Party (Kerry)
2004 Presidential Elections Results (%) - Republican Party (Bush)
2004 Presidential Elections Results (%) - Other
2008 Presidential Elections Results (%) - Democratic Party (Obama)
2008 Presidential Elections Results (%) - Republican Party (McCain)
2008 Presidential Elections Results (%) - Other
2012 Presidential Elections Results (%) - Democratic Party (Obama)
2012 Presidential Elections Results (%) - Republican Party (Romney)
2012 Presidential Elections Results (%) - Other
2016 Presidential Elections Results (%) - Democratic Party (Clinton)
2016 Presidential Elections Results (%) - Republican Party (Trump)
2016 Presidential Elections Results (%) - Other
2020 Presidential Elections Results (%) - Democratic Party (Biden)
2020 Presidential Elections Results (%) - Republican Party (Trump)
2020 Presidential Elections Results (%) - Other
Ancestries Reported - Arab (%)
Ancestries Reported - Czech (%)
Ancestries Reported - Danish (%)
Ancestries Reported - Dutch (%)
Ancestries Reported - English (%)
Ancestries Reported - French (%)
Ancestries Reported - French Canadian (%)
Ancestries Reported - German (%)
Ancestries Reported - Greek (%)
Ancestries Reported - Hungarian (%)
Ancestries Reported - Irish (%)
Ancestries Reported - Italian (%)
Ancestries Reported - Lithuanian (%)
Ancestries Reported - Norwegian (%)
Ancestries Reported - Polish (%)
Ancestries Reported - Portuguese (%)
Ancestries Reported - Russian (%)
Ancestries Reported - Scotch-Irish (%)
Ancestries Reported - Scottish (%)
Ancestries Reported - Slovak (%)
Ancestries Reported - Subsaharan African (%)
Ancestries Reported - Swedish (%)
Ancestries Reported - Swiss (%)
Ancestries Reported - Ukrainian (%)
Ancestries Reported - United States (%)
Ancestries Reported - Welsh (%)
Ancestries Reported - West Indian (%)
Ancestries Reported - Other (%)
Educational Attainment - No schooling completed (%)
Educational Attainment - Less than high school (%)
Educational Attainment - High school or equivalent (%)
Educational Attainment - Less than 1 year of college (%)
Educational Attainment - 1 or more years of college (%)
Educational Attainment - Associate degree (%)
Educational Attainment - Bachelor's degree (%)
Educational Attainment - Master's degree (%)
Educational Attainment - Professional school degree (%)
Educational Attainment - Doctorate degree (%)
School Enrollment - Nursery, preschool (%)
School Enrollment - Kindergarten (%)
School Enrollment - Grade 1 to 4 (%)
School Enrollment - Grade 5 to 8 (%)
School Enrollment - Grade 9 to 12 (%)
School Enrollment - College undergrad (%)
School Enrollment - Graduate or professional (%)
School Enrollment - Not enrolled in school (%)
School enrollment - Public schools (%)
School enrollment - Private schools (%)
School enrollment - Not enrolled (%)
Median number of rooms in houses and condos
Median number of rooms in apartments
Housing units lacking complete plumbing facilities (%)
Housing units lacking complete kitchen facilities (%)
Density of houses
Urban houses (%)
Rural houses (%)
Households with people 60 years and over (%)
Households with people 65 years and over (%)
Households with people 75 years and over (%)
Households with one or more nonrelatives (%)
Households with no nonrelatives (%)
Population in households (%)
Family households (%)
Nonfamily households (%)
Population in families (%)
Family households with own children (%)
Median number of bedrooms in owner occupied houses
Mean number of bedrooms in owner occupied houses
Median number of bedrooms in renter occupied houses
Mean number of bedrooms in renter occupied houses
Median number of vehichles in owner occupied houses
Mean number of vehichles in owner occupied houses
Median number of vehichles in renter occupied houses
Mean number of vehichles in renter occupied houses
Mortgage status - with mortgage (%)
Mortgage status - with second mortgage (%)
Mortgage status - with home equity loan (%)
Mortgage status - with both second mortgage and home equity loan (%)
Mortgage status - without a mortgage (%)
Average family size
Average family size - White
Average family size - Black or African American
Average family size - Asian
Average family size - Hispanic or Latino
Average family size - American Indian and Alaska Native
Average family size - Multirace
Average family size - Other Race
Geographical mobility - Same house 1 year ago (%)
Geographical mobility - Moved within same county (%)
Geographical mobility - Moved from different county within same state (%)
Geographical mobility - Moved from different state (%)
Geographical mobility - Moved from abroad (%)
Place of birth - Born in state of residence (%)
Place of birth - Born in other state (%)
Place of birth - Native, outside of US (%)
Place of birth - Foreign born (%)
Housing units in structures - 1, detached (%)
Housing units in structures - 1, attached (%)
Housing units in structures - 2 (%)
Housing units in structures - 3 or 4 (%)
Housing units in structures - 5 to 9 (%)
Housing units in structures - 10 to 19 (%)
Housing units in structures - 20 to 49 (%)
Housing units in structures - 50 or more (%)
Housing units in structures - Mobile home (%)
Housing units in structures - Boat, RV, van, etc. (%)
House/condo owner moved in on average (years ago)
Renter moved in on average (years ago)
Year householder moved into unit - Moved in 1999 to March 2000 (%)
Year householder moved into unit - Moved in 1995 to 1998 (%)
Year householder moved into unit - Moved in 1990 to 1994 (%)
Year householder moved into unit - Moved in 1980 to 1989 (%)
Year householder moved into unit - Moved in 1970 to 1979 (%)
Year householder moved into unit - Moved in 1969 or earlier (%)
Means of transportation to work - Drove car alone (%)
Means of transportation to work - Carpooled (%)
Means of transportation to work - Public transportation (%)
Means of transportation to work - Bus or trolley bus (%)
Means of transportation to work - Streetcar or trolley car (%)
Means of transportation to work - Subway or elevated (%)
Means of transportation to work - Railroad (%)
Means of transportation to work - Ferryboat (%)
Means of transportation to work - Taxicab (%)
Means of transportation to work - Motorcycle (%)
Means of transportation to work - Bicycle (%)
Means of transportation to work - Walked (%)
Means of transportation to work - Other means (%)
Working at home (%)
Industry diversity
Most Common Industries - Agriculture, forestry, fishing and hunting, and mining (%)
Most Common Industries - Agriculture, forestry, fishing and hunting (%)
Most Common Industries - Mining, quarrying, and oil and gas extraction (%)
Most Common Industries - Construction (%)
Most Common Industries - Manufacturing (%)
Most Common Industries - Wholesale trade (%)
Most Common Industries - Retail trade (%)
Most Common Industries - Transportation and warehousing, and utilities (%)
Most Common Industries - Transportation and warehousing (%)
Most Common Industries - Utilities (%)
Most Common Industries - Information (%)
Most Common Industries - Finance and insurance, and real estate and rental and leasing (%)
Most Common Industries - Finance and insurance (%)
Most Common Industries - Real estate and rental and leasing (%)
Most Common Industries - Professional, scientific, and management, and administrative and waste management services (%)
Most Common Industries - Professional, scientific, and technical services (%)
Most Common Industries - Management of companies and enterprises (%)
Most Common Industries - Administrative and support and waste management services (%)
Most Common Industries - Educational services, and health care and social assistance (%)
Most Common Industries - Educational services (%)
Most Common Industries - Health care and social assistance (%)
Most Common Industries - Arts, entertainment, and recreation, and accommodation and food services (%)
Most Common Industries - Arts, entertainment, and recreation (%)
Most Common Industries - Accommodation and food services (%)
Most Common Industries - Other services, except public administration (%)
Most Common Industries - Public administration (%)
Occupation diversity
Most Common Occupations - Management, business, science, and arts occupations (%)
Most Common Occupations - Management, business, and financial occupations (%)
Most Common Occupations - Management occupations (%)
Most Common Occupations - Business and financial operations occupations (%)
Most Common Occupations - Computer, engineering, and science occupations (%)
Most Common Occupations - Computer and mathematical occupations (%)
Most Common Occupations - Architecture and engineering occupations (%)
Most Common Occupations - Life, physical, and social science occupations (%)
Most Common Occupations - Education, legal, community service, arts, and media occupations (%)
Most Common Occupations - Community and social service occupations (%)
Most Common Occupations - Legal occupations (%)
Most Common Occupations - Education, training, and library occupations (%)
Most Common Occupations - Arts, design, entertainment, sports, and media occupations (%)
Most Common Occupations - Healthcare practitioners and technical occupations (%)
Most Common Occupations - Health diagnosing and treating practitioners and other technical occupations (%)
Most Common Occupations - Health technologists and technicians (%)
Most Common Occupations - Service occupations (%)
Most Common Occupations - Healthcare support occupations (%)
Most Common Occupations - Protective service occupations (%)
Most Common Occupations - Fire fighting and prevention, and other protective service workers including supervisors (%)
Most Common Occupations - Law enforcement workers including supervisors (%)
Most Common Occupations - Food preparation and serving related occupations (%)
Most Common Occupations - Building and grounds cleaning and maintenance occupations (%)
Most Common Occupations - Personal care and service occupations (%)
Most Common Occupations - Sales and office occupations (%)
Most Common Occupations - Sales and related occupations (%)
Most Common Occupations - Office and administrative support occupations (%)
Most Common Occupations - Natural resources, construction, and maintenance occupations (%)
Most Common Occupations - Farming, fishing, and forestry occupations (%)
Most Common Occupations - Construction and extraction occupations (%)
Most Common Occupations - Installation, maintenance, and repair occupations (%)
Most Common Occupations - Production, transportation, and material moving occupations (%)
Most Common Occupations - Production occupations (%)
Most Common Occupations - Transportation occupations (%)
Most Common Occupations - Material moving occupations (%)
People in Group quarters - Institutionalized population (%)
People in Group quarters - Correctional institutions (%)
People in Group quarters - Federal prisons and detention centers (%)
People in Group quarters - Halfway houses (%)
People in Group quarters - Local jails and other confinement facilities (including police lockups) (%)
People in Group quarters - Military disciplinary barracks (%)
People in Group quarters - State prisons (%)
People in Group quarters - Other types of correctional institutions (%)
People in Group quarters - Nursing homes (%)
People in Group quarters - Hospitals/wards, hospices, and schools for the handicapped (%)
People in Group quarters - Hospitals/wards and hospices for chronically ill (%)
People in Group quarters - Hospices or homes for chronically ill (%)
People in Group quarters - Military hospitals or wards for chronically ill (%)
People in Group quarters - Other hospitals or wards for chronically ill (%)
People in Group quarters - Hospitals or wards for drug/alcohol abuse (%)
People in Group quarters - Mental (Psychiatric) hospitals or wards (%)
People in Group quarters - Schools, hospitals, or wards for the mentally retarded (%)
People in Group quarters - Schools, hospitals, or wards for the physically handicapped (%)
People in Group quarters - Institutions for the deaf (%)
People in Group quarters - Institutions for the blind (%)
People in Group quarters - Orthopedic wards and institutions for the physically handicapped (%)
People in Group quarters - Wards in general hospitals for patients who have no usual home elsewhere (%)
People in Group quarters - Wards in military hospitals for patients who have no usual home elsewhere (%)
People in Group quarters - Juvenile institutions (%)
People in Group quarters - Long-term care (%)
People in Group quarters - Homes for abused, dependent, and neglected children (%)
People in Group quarters - Residential treatment centers for emotionally disturbed children (%)
People in Group quarters - Training schools for juvenile delinquents (%)
People in Group quarters - Short-term care, detention or diagnostic centers for delinquent children (%)
People in Group quarters - Type of juvenile institution unknown (%)
People in Group quarters - Noninstitutionalized population (%)
People in Group quarters - College dormitories (includes college quarters off campus) (%)
People in Group quarters - Military quarters (%)
People in Group quarters - On base (%)
People in Group quarters - Barracks, unaccompanied personnel housing (UPH), (Enlisted/Officer), ;and similar group living quarters for military personnel (%)
People in Group quarters - Transient quarters for temporary residents (%)
People in Group quarters - Military ships (%)
People in Group quarters - Group homes (%)
People in Group quarters - Homes or halfway houses for drug/alcohol abuse (%)
People in Group quarters - Homes for the mentally ill (%)
People in Group quarters - Homes for the mentally retarded (%)
People in Group quarters - Homes for the physically handicapped (%)
People in Group quarters - Other group homes (%)
People in Group quarters - Religious group quarters (%)
People in Group quarters - Dormitories (%)
People in Group quarters - Agriculture workers' dormitories on farms (%)
People in Group quarters - Job Corps and vocational training facilities (%)
People in Group quarters - Other workers' dormitories (%)
People in Group quarters - Crews of maritime vessels (%)
People in Group quarters - Other nonhousehold living situations (%)
People in Group quarters - Other noninstitutional group quarters (%)
Residents speaking English at home (%)
Residents speaking English at home - Born in the United States (%)
Residents speaking English at home - Native, born elsewhere (%)
Residents speaking English at home - Foreign born (%)
Residents speaking Spanish at home (%)
Residents speaking Spanish at home - Born in the United States (%)
Residents speaking Spanish at home - Native, born elsewhere (%)
Residents speaking Spanish at home - Foreign born (%)
Residents speaking other language at home (%)
Residents speaking other language at home - Born in the United States (%)
Residents speaking other language at home - Native, born elsewhere (%)
Residents speaking other language at home - Foreign born (%)
Class of Workers - Employee of private company (%)
Class of Workers - Self-employed in own incorporated business (%)
Class of Workers - Private not-for-profit wage and salary workers (%)
Class of Workers - Local government workers (%)
Class of Workers - State government workers (%)
Class of Workers - Federal government workers (%)
Class of Workers - Self-employed workers in own not incorporated business and Unpaid family workers (%)
House heating fuel used in houses and condos - Utility gas (%)
House heating fuel used in houses and condos - Bottled, tank, or LP gas (%)
House heating fuel used in houses and condos - Electricity (%)
House heating fuel used in houses and condos - Fuel oil, kerosene, etc. (%)
House heating fuel used in houses and condos - Coal or coke (%)
House heating fuel used in houses and condos - Wood (%)
House heating fuel used in houses and condos - Solar energy (%)
House heating fuel used in houses and condos - Other fuel (%)
House heating fuel used in houses and condos - No fuel used (%)
House heating fuel used in apartments - Utility gas (%)
House heating fuel used in apartments - Bottled, tank, or LP gas (%)
House heating fuel used in apartments - Electricity (%)
House heating fuel used in apartments - Fuel oil, kerosene, etc. (%)
House heating fuel used in apartments - Coal or coke (%)
House heating fuel used in apartments - Wood (%)
House heating fuel used in apartments - Solar energy (%)
House heating fuel used in apartments - Other fuel (%)
House heating fuel used in apartments - No fuel used (%)
Armed forces status - In Armed Forces (%)
Armed forces status - Civilian (%)
Armed forces status - Civilian - Veteran (%)
Armed forces status - Civilian - Nonveteran (%)
Fatal accidents locations in years 2005-2021
Fatal accidents locations in 2005
Fatal accidents locations in 2006
Fatal accidents locations in 2007
Fatal accidents locations in 2008
Fatal accidents locations in 2009
Fatal accidents locations in 2010
Fatal accidents locations in 2011
Fatal accidents locations in 2012
Fatal accidents locations in 2013
Fatal accidents locations in 2014
Fatal accidents locations in 2015
Fatal accidents locations in 2016
Fatal accidents locations in 2017
Fatal accidents locations in 2018
Fatal accidents locations in 2019
Fatal accidents locations in 2020
Fatal accidents locations in 2021
Alcohol use - People drinking some alcohol every month (%)
Alcohol use - People not drinking at all (%)
Alcohol use - Average days/month drinking alcohol
Alcohol use - Average drinks/week
Alcohol use - Average days/year people drink much
Audiometry - Average condition of hearing (%)
Audiometry - People that can hear a whisper from across a quiet room (%)
Audiometry - People that can hear normal voice from across a quiet room (%)
Audiometry - Ears ringing, roaring, buzzing (%)
Audiometry - Had a job exposure to loud noise (%)
Audiometry - Had off-work exposure to loud noise (%)
Blood Pressure & Cholesterol - Has high blood pressure (%)
Blood Pressure & Cholesterol - Checking blood pressure at home (%)
Blood Pressure & Cholesterol - Frequently checking blood cholesterol (%)
Blood Pressure & Cholesterol - Has high cholesterol level (%)
Consumer Behavior - Money monthly spent on food at supermarket/grocery store
Consumer Behavior - Money monthly spent on food at other stores
Consumer Behavior - Money monthly spent on eating out
Consumer Behavior - Money monthly spent on carryout/delivered foods
Consumer Behavior - Income spent on food at supermarket/grocery store (%)
Consumer Behavior - Income spent on food at other stores (%)
Consumer Behavior - Income spent on eating out (%)
Consumer Behavior - Income spent on carryout/delivered foods (%)
Current Health Status - General health condition (%)
Current Health Status - Blood donors (%)
Current Health Status - Has blood ever tested for HIV virus (%)
Current Health Status - Left-handed people (%)
Dermatology - People using sunscreen (%)
Diabetes - Diabetics (%)
Diabetes - Had a blood test for high blood sugar (%)
Diabetes - People taking insulin (%)
Diet Behavior & Nutrition - Diet health (%)
Diet Behavior & Nutrition - Milk product consumption (# of products/month)
Diet Behavior & Nutrition - Meals not home prepared (#/week)
Diet Behavior & Nutrition - Meals from fast food or pizza place (#/week)
Diet Behavior & Nutrition - Ready-to-eat foods (#/month)
Diet Behavior & Nutrition - Frozen meals/pizza (#/month)
Drug Use - People that ever used marijuana or hashish (%)
Drug Use - Ever used hard drugs (%)
Drug Use - Ever used any form of cocaine (%)
Drug Use - Ever used heroin (%)
Drug Use - Ever used methamphetamine (%)
Health Insurance - People covered by health insurance (%)
Kidney Conditions-Urology - Avg. # of times urinating at night
Medical Conditions - People with asthma (%)
Medical Conditions - People with anemia (%)
Medical Conditions - People with psoriasis (%)
Medical Conditions - People with overweight (%)
Medical Conditions - Elderly people having difficulties in thinking or remembering (%)
Medical Conditions - People who ever received blood transfusion (%)
Medical Conditions - People having trouble seeing even with glass/contacts (%)
Medical Conditions - People with arthritis (%)
Medical Conditions - People with gout (%)
Medical Conditions - People with congestive heart failure (%)
Medical Conditions - People with coronary heart disease (%)
Medical Conditions - People with angina pectoris (%)
Medical Conditions - People who ever had heart attack (%)
Medical Conditions - People who ever had stroke (%)
Medical Conditions - People with emphysema (%)
Medical Conditions - People with thyroid problem (%)
Medical Conditions - People with chronic bronchitis (%)
Medical Conditions - People with any liver condition (%)
Medical Conditions - People who ever had cancer or malignancy (%)
Mental Health - People who have little interest in doing things (%)
Mental Health - People feeling down, depressed, or hopeless (%)
Mental Health - People who have trouble sleeping or sleeping too much (%)
Mental Health - People feeling tired or having little energy (%)
Mental Health - People with poor appetite or overeating (%)
Mental Health - People feeling bad about themself (%)
Mental Health - People who have trouble concentrating on things (%)
Mental Health - People moving or speaking slowly or too fast (%)
Mental Health - People having thoughts they would be better off dead (%)
Oral Health - Average years since last visit a dentist
Oral Health - People embarrassed because of mouth (%)
Oral Health - People with gum disease (%)
Oral Health - General health of teeth and gums (%)
Oral Health - Average days a week using dental floss/device
Oral Health - Average days a week using mouthwash for dental problem
Oral Health - Average number of teeth
Pesticide Use - Households using pesticides to control insects (%)
Pesticide Use - Households using pesticides to kill weeds (%)
Physical Activity - People doing vigorous-intensity work activities (%)
Physical Activity - People doing moderate-intensity work activities (%)
Physical Activity - People walking or bicycling (%)
Physical Activity - People doing vigorous-intensity recreational activities (%)
Physical Activity - People doing moderate-intensity recreational activities (%)
Physical Activity - Average hours a day doing sedentary activities
Physical Activity - Average hours a day watching TV or videos
Physical Activity - Average hours a day using computer
Physical Functioning - People having limitations keeping them from working (%)
Physical Functioning - People limited in amount of work they can do (%)
Physical Functioning - People that need special equipment to walk (%)
Physical Functioning - People experiencing confusion/memory problems (%)
Physical Functioning - People requiring special healthcare equipment (%)
Prescription Medications - Average number of prescription medicines taking
Preventive Aspirin Use - Adults 40+ taking low-dose aspirin (%)
Reproductive Health - Vaginal deliveries (%)
Reproductive Health - Cesarean deliveries (%)
Reproductive Health - Deliveries resulted in a live birth (%)
Reproductive Health - Pregnancies resulted in a delivery (%)
Reproductive Health - Women breastfeeding newborns (%)
Reproductive Health - Women that had a hysterectomy (%)
Reproductive Health - Women that had both ovaries removed (%)
Reproductive Health - Women that have ever taken birth control pills (%)
Reproductive Health - Women taking birth control pills (%)
Reproductive Health - Women that have ever used Depo-Provera or injectables (%)
Reproductive Health - Women that have ever used female hormones (%)
Sexual Behavior - People 18+ that ever had sex (vaginal, anal, or oral) (%)
Sexual Behavior - Males 18+ that ever had vaginal sex with a woman (%)
Sexual Behavior - Males 18+ that ever performed oral sex on a woman (%)
Sexual Behavior - Males 18+ that ever had anal sex with a woman (%)
Sexual Behavior - Males 18+ that ever had any sex with a man (%)
Sexual Behavior - Females 18+ that ever had vaginal sex with a man (%)
Sexual Behavior - Females 18+ that ever performed oral sex on a man (%)
Sexual Behavior - Females 18+ that ever had anal sex with a man (%)
Sexual Behavior - Females 18+ that ever had any kind of sex with a woman (%)
Sexual Behavior - Average age people first had sex
Sexual Behavior - Average number of female sex partners in lifetime (males 18+)
Sexual Behavior - Average number of female vaginal sex partners in lifetime (males 18+)
Sexual Behavior - Average age people first performed oral sex on a woman (18+)
Sexual Behavior - Average number of woman performed oral sex on in lifetime (18+)
Sexual Behavior - Average number of male sex partners in lifetime (males 18+)
Sexual Behavior - Average number of male anal sex partners in lifetime (males 18+)
Sexual Behavior - Average age people first performed oral sex on a man (18+)
Sexual Behavior - Average number of male oral sex partners in lifetime (18+)
Sexual Behavior - People using protection when performing oral sex (%)
Sexual Behavior - Average number of times people have vaginal or anal sex a year
Sexual Behavior - People having sex without condom (%)
Sexual Behavior - Average number of male sex partners in lifetime (females 18+)
Sexual Behavior - Average number of male vaginal sex partners in lifetime (females 18+)
Sexual Behavior - Average number of female sex partners in lifetime (females 18+)
Sexual Behavior - Circumcised males 18+ (%)
Sleep Disorders - Average hours sleeping at night
Sleep Disorders - People that has trouble sleeping (%)
Smoking-Cigarette Use - People smoking cigarettes (%)
Taste & Smell - People 40+ having problems with smell (%)
Taste & Smell - People 40+ having problems with taste (%)
Taste & Smell - People 40+ that ever had wisdom teeth removed (%)
Taste & Smell - People 40+ that ever had tonsils teeth removed (%)
Taste & Smell - People 40+ that ever had a loss of consciousness because of a head injury (%)
Taste & Smell - People 40+ that ever had a broken nose or other serious injury to face or skull (%)
Taste & Smell - People 40+ that ever had two or more sinus infections (%)
Weight - Average height (inches)
Weight - Average weight (pounds)
Weight - Average BMI
Weight - People that are obese (%)
Weight - People that ever were obese (%)
Weight - People trying to lose weight (%)
Urban population: 32,138
Rural population: 1,411
Estimated median house/condo value in 2022: $498,889
84414:
$498,889Utah:
$499,500
According to our research of Utah and other state lists, there were 35 registered sex offenders living in 84414 zip code as of June 08, 2024 . The ratio of all residents to sex offenders in zip code 84414 is 841 to 1.The ratio of registered sex offenders to all residents in this zip code is much lower than the state average.
Median resident age: This zip code:
32.6 yearsUtah median age:
32.1 years
Average household size: This zip code:
3.2 peopleUtah:
3.0 people
Averages for the 2020 tax year for zip code 84414, filed in 2021:
Average Adjusted Gross Income (AGI) in 2020: $92,973 (Individual Income Tax Returns) Here:
$92,973State:
$81,660
Salary/wage: $68,951 (reported on 83.6% of returns )Here:
$68,951State:
$63,027
(% of AGI for various income ranges: 1184.6% for AGIs below $25k , 3602.2% for AGIs $25k-50k , 6176.5% for AGIs $50k-75k , 9190.8% for AGIs $75k-100k , 17898.4% for AGIs $100k-200k , 64936.0% for AGIs over 200k ) Taxable interest for individuals: $1,819 (reported on 36.6% of returns )This zip code:
$1,819Utah:
$2,255
(% of AGI for various income ranges: 13.8% for AGIs below $25k , 31.0% for AGIs $25k-50k , 49.1% for AGIs $50k-75k , 74.1% for AGIs $75k-100k , 144.9% for AGIs $100k-200k , 1456.3% for AGIs over 200k ) Ordinary dividends: $5,915 (reported on 17.2% of returns )(% of AGI for various income ranges: 16.1% for AGIs below $25k , 33.1% for AGIs $25k-50k , 46.7% for AGIs $50k-75k , 76.9% for AGIs $75k-100k , 140.1% for AGIs $100k-200k , 3176.0% for AGIs over 200k ) Net capital gain/loss in AGI: +$48,976 (reported on 17.4% of returns )Here:
+$48,976State:
+$43,433
(% of AGI for various income ranges: 9.6% for AGIs below $25k , 54.7% for AGIs $25k-50k , 50.0% for AGIs $50k-75k , 157.2% for AGIs $75k-100k , 528.9% for AGIs $100k-200k , 37500.3% for AGIs over 200k ) Profit/loss from business: +$7,830 (reported on 13.3% of returns )Here:
+$7,830State:
+$9,957
(% of AGI for various income ranges: 62.9% for AGIs below $25k , 69.5% for AGIs $25k-50k , 111.7% for AGIs $50k-75k , 173.4% for AGIs $75k-100k , 188.3% for AGIs $100k-200k , 1492.7% for AGIs over 200k ) Taxable individual retirement arrangement distribution: $19,536 (reported on 9.6% of returns )84414:
$19,536Utah:
$21,167
(% of AGI for various income ranges: 39.8% for AGIs below $25k , 114.8% for AGIs $25k-50k , 170.9% for AGIs $50k-75k , 275.2% for AGIs $75k-100k , 607.7% for AGIs $100k-200k , 2232.7% for AGIs over 200k ) Total itemized deductions: $39,301 (reported on 16.7% of returns )Here:
$39,301State:
$41,056
(% of AGI for various income ranges: 38.7% for AGIs below $25k , 140.2% for AGIs $25k-50k , 386.9% for AGIs $50k-75k , 743.3% for AGIs $75k-100k , 2061.9% for AGIs $100k-200k , 13255.7% for AGIs over 200k ) Charity contributions: $20,776 (reported on 15.0% of returns )Here:
$20,776State:
$22,261
(% of AGI for various income ranges: 4.5% for AGIs below $25k , 25.6% for AGIs $25k-50k , 91.6% for AGIs $50k-75k , 216.9% for AGIs $75k-100k , 808.1% for AGIs $100k-200k , 8862.0% for AGIs over 200k ) Taxes paid: $8,162 (reported on 16.7% of returns )(% of AGI for various income ranges: 5.5% for AGIs below $25k , 24.9% for AGIs $25k-50k , 89.4% for AGIs $50k-75k , 183.3% for AGIs $75k-100k , 567.0% for AGIs $100k-200k , 1804.3% for AGIs over 200k ) Earned income credit: $2,130 (reported on 8.7% of returns )(% of AGI for various income ranges: 50.1% for AGIs below $25k , 54.8% for AGIs $25k-50k , 1.4% for AGIs $50k-75k ) Percentage of individuals using paid preparers for their 2020 taxes: 93.6%(% for various income ranges: 92.0% for AGIs below $25k , 94.1% for AGIs $25k-50k , 94.0% for AGIs $50k-75k , 94.5% for AGIs $75k-100k , 94.0% for AGIs $100k-200k , 95.4% for AGIs over 200k )
Averages for the 2012 tax year for zip code 84414, filed in 2013:
Average Adjusted Gross Income (AGI) in 2012: $63,975 (Individual Income Tax Returns) Here:
$63,975State:
$60,327
Salary/wage: $54,146 (reported on 84.8% of returns )Here:
$54,146State:
$48,762
(% of AGI for various income ranges: 78.1% for AGIs below $25k , 75.1% for AGIs $25k-50k , 73.3% for AGIs $50k-75k , 76.4% for AGIs $75k-100k , 78.0% for AGIs $100k-200k , 48.2% for AGIs over 200k ) Taxable interest for individuals: $890 (reported on 49.9% of returns )This zip code:
$890Utah:
$1,534
(% of AGI for various income ranges: 1.1% for AGIs below $25k , 0.7% for AGIs $25k-50k , 0.7% for AGIs $50k-75k , 0.6% for AGIs $75k-100k , 0.5% for AGIs $100k-200k , 1.1% for AGIs over 200k ) Ordinary dividends: $3,807 (reported on 17.0% of returns )(% of AGI for various income ranges: 1.1% for AGIs below $25k , 0.6% for AGIs $25k-50k , 0.5% for AGIs $50k-75k , 0.5% for AGIs $75k-100k , 0.7% for AGIs $100k-200k , 3.0% for AGIs over 200k ) Net capital gain/loss in AGI: +$14,779 (reported on 13.5% of returns )Here:
+$14,779State:
+$23,734
(% of AGI for various income ranges: 0.4% for AGIs $50k-75k , 0.4% for AGIs $75k-100k , 0.8% for AGIs $100k-200k , 17.1% for AGIs over 200k ) Profit/loss from business: +$6,541 (reported on 13.6% of returns )Here:
+$6,541State:
+$8,845
(% of AGI for various income ranges: 3.5% for AGIs below $25k , 2.0% for AGIs $25k-50k , 1.3% for AGIs $50k-75k , 0.9% for AGIs $75k-100k , 1.2% for AGIs $100k-200k , 1.3% for AGIs over 200k ) Taxable individual retirement arrangement distribution: $14,068 (reported on 10.6% of returns )84414:
$14,068Utah:
$15,565
(% of AGI for various income ranges: 2.9% for AGIs below $25k , 2.0% for AGIs $25k-50k , 2.1% for AGIs $50k-75k , 2.2% for AGIs $75k-100k , 2.7% for AGIs $100k-200k , 2.1% for AGIs over 200k ) Self-employment retirement plans: $16,400 (reported on 0.3% of returns )84414:
$16,400Utah:
$22,655
Total itemized deductions: $23,338 (23% of AGI, reported on 48.4% of returns )Here:
$23,338State:
$25,197
Here:
23.4% of AGIState:
22.4% of AGI
(% of AGI for various income ranges: 9.1% for AGIs below $25k , 15.3% for AGIs $25k-50k , 18.6% for AGIs $50k-75k , 19.2% for AGIs $75k-100k , 19.2% for AGIs $100k-200k , 16.7% for AGIs over 200k ) Charity contributions: $7,777 (reported on 43.6% of returns )(% of AGI for various income ranges: 1.1% for AGIs below $25k , 3.2% for AGIs $25k-50k , 4.6% for AGIs $50k-75k , 5.8% for AGIs $75k-100k , 6.0% for AGIs $100k-200k , 7.0% for AGIs over 200k ) Taxes paid: $6,764 (reported on 48.2% of returns )(% of AGI for various income ranges: 1.5% for AGIs below $25k , 3.3% for AGIs $25k-50k , 4.5% for AGIs $50k-75k , 5.4% for AGIs $75k-100k , 6.2% for AGIs $100k-200k , 5.7% for AGIs over 200k ) Earned income credit: $2,129 (reported on 11.9% of returns )(% of AGI for various income ranges: 4.4% for AGIs below $25k , 1.3% for AGIs $25k-50k ) Percentage of individuals using paid preparers for their 2012 taxes: 44.0%(% for various income ranges: 37.4% for AGIs below $25k , 44.9% for AGIs $25k-50k , 45.9% for AGIs $50k-75k , 45.8% for AGIs $75k-100k , 47.3% for AGIs $100k-200k , 72.4% for AGIs over 200k )
Averages for the 2004 tax year for zip code 84414, filed in 2005:
Average Adjusted Gross Income (AGI) in 2004: $52,471 (Individual Income Tax Returns) Here:
$52,471State:
$45,498
Salary/wage: $45,496 (reported on 86.7% of returns )Here:
$45,496State:
$38,975
(% of AGI for various income ranges: 163.5% for AGIs below $10k , 76.4% for AGIs $10k-25k , 75.0% for AGIs $25k-50k , 78.7% for AGIs $50k-75k , 83.8% for AGIs $75k-100k , 65.7% for AGIs over 100k ) Taxable interest for individuals: $914 (reported on 66.3% of returns )This zip code:
$914Utah:
$1,445
(% of AGI for various income ranges: 6.0% for AGIs below $10k , 1.8% for AGIs $10k-25k , 1.3% for AGIs $25k-50k , 1.1% for AGIs $50k-75k , 0.7% for AGIs $75k-100k , 1.2% for AGIs over 100k ) Taxable dividends: $1,791 (reported on 20.8% of returns )(% of AGI for various income ranges: 2.9% for AGIs below $10k , 0.7% for AGIs $10k-25k , 0.6% for AGIs $25k-50k , 0.5% for AGIs $50k-75k , 0.6% for AGIs $75k-100k , 0.9% for AGIs over 100k ) Net capital gain/loss: +$6,411 (reported on 18.5% of returns )Here:
+$6,411State:
+$14,059
(% of AGI for various income ranges: 0.7% for AGIs below $10k , 0.3% for AGIs $10k-25k , 0.3% for AGIs $25k-50k , 0.6% for AGIs $50k-75k , 0.9% for AGIs $75k-100k , 5.3% for AGIs over 100k ) Profit/loss from business: +$5,826 (reported on 14.5% of returns )Here:
+$5,826State:
+$6,903
(% of AGI for various income ranges: -3.2% for AGIs below $10k , 3.1% for AGIs $10k-25k , 1.5% for AGIs $25k-50k , 1.7% for AGIs $50k-75k , 1.2% for AGIs $75k-100k , 1.8% for AGIs over 100k ) IRA payment deduction: $2,925 (reported on 1.9% of returns )(% of AGI for various income ranges: 0.1% for AGIs $10k-25k , 0.2% for AGIs $25k-50k , 0.1% for AGIs $50k-75k , 0.1% for AGIs $75k-100k , 0.1% for AGIs over 100k ) Self-employed pension: $14,077 (reported on 0.3% of returns )Total itemized deductions: $19,694 (24% of AGI, reported on 51.3% of returns )Here:
$19,694State:
$20,312
Here:
24.0% of AGIState:
24.9% of AGI
(% of AGI for various income ranges: 19.7% for AGIs below $10k , 11.9% for AGIs $10k-25k , 18.6% for AGIs $25k-50k , 22.4% for AGIs $50k-75k , 21.4% for AGIs $75k-100k , 17.7% for AGIs over 100k ) Charity contributions deductions: $6,222 (7% of AGI, reported on 48.4% of returns )Here:
7.5% of AGIState:
7.4% of AGI
(% of AGI for various income ranges: 2.5% for AGIs below $10k , 2.0% for AGIs $10k-25k , 4.2% for AGIs $25k-50k , 6.0% for AGIs $50k-75k , 6.2% for AGIs $75k-100k , 6.7% for AGIs over 100k ) Total tax: $6,497 (reported on 77.7% of returns )(% of AGI for various income ranges: 3.6% for AGIs below $10k , 4.2% for AGIs $10k-25k , 5.4% for AGIs $25k-50k , 6.7% for AGIs $50k-75k , 8.3% for AGIs $75k-100k , 15.0% for AGIs over 100k ) Earned income credit: $1,582 (reported on 8.2% of returns )Percentage of individuals using paid preparers for their 2004 taxes: 44.2%(% for various income ranges: 34.3% for AGIs below $10k , 43.2% for AGIs $10k-25k , 46.3% for AGIs $25k-50k , 45.2% for AGIs $50k-75k , 44.3% for AGIs $75k-100k , 56.1% for AGIs over 100k )
Estimated median household income in 2022: This zip code:
$106,497Utah:
$89,168
Nearest zip codes: 84340 ,
84401 ,
84310 ,
84403 ,
84404 ,
84405 .
Pleasant View Zip Code Map
Percentage of family households: This zip code:
64.2%Utah:
56.6%
Percentage of households with unmarried partners: This zip code:
2.5%Utah:
59.5%
Likely homosexual households (counted as self-reported same-sex unmarried-partner households)
Lesbian couples: 0.0% of all households Gay men: 0.0% of all households
Household received Food Stamps/SNAP in the past 12 months: 353Household did not receive Food Stamps/SNAP in the past 12 months: 10,269
Women who had a birth in the past 12 months: 632 (610 now married , 29 unmarried) Women who did not have a birth in the past 12 months: 7,615 (3,505 now married , 4,118 unmarried)
Housing units in zip code 84414 with a mortgage: 6,409 (826
second mortgage , 23
home equity loan , 678
both second mortgage and home equity loan )
Houses without a mortgage: 135
Median monthly owner costs for units with a mortgage: $1,910
Median monthly owner costs for units without a mortgage: $518
Residents with income below the poverty level in 2022:
This zip code:
4.2%Whole state:
8.2%
Residents with income below 50% of the poverty level in 2022:
This zip code:
1.9%Whole state:
4.3%
Median number of rooms in houses and condos: Median number of rooms in apartments:
Year house built (houses)
157 2020 or later1,846 2010 to 20192,789 2000 to 20091,675 1990 to 19991,123 1980 to 19891,037 1970 to 1979928 1960 to 1969494 1950 to 195967 1940 to 1949305 1939 or earlier
Zip code 84414 household income distribution in 2022 127 Less than $10,000140 $10,000 to $14,999167 $15,000 to $19,999211 $20,000 to $24,999167 $25,000 to $29,999307 $30,000 to $34,999217 $35,000 to $39,999207 $40,000 to $44,999253 $45,000 to $49,999573 $50,000 to $59,9991,021 $60,000 to $74,9991,267 $75,000 to $99,9991,999 $100,000 to $124,9991,241 $125,000 to $149,9991,343 $150,000 to $199,9991,417 $200,000 or moreEstimate of home value of owner-occupied houses/condos in 2022 in zip code 84414 25 Less than $10,00044 $30,000 to $34,99941 $40,000 to $49,99928 $50,000 to $59,99913 $80,000 to $89,99955 $100,000 to $124,99925 $125,000 to $149,99936 $150,000 to $174,99959 $175,000 to $199,999195 $200,000 to $249,999475 $250,000 to $299,9991,848 $300,000 to $399,9992,170 $400,000 to $499,9992,957 $500,000 to $749,999751 $750,000 to $999,999156 $1,000,000 to $1,499,99954 $1,500,000 to $1,999,999103 $2,000,000 or moreRent paid by renters in 2022 in zip code 84414 12 $300 to $3497 $450 to $4996 $550 to $5997 $650 to $69940 $700 to $74917 $750 to $79959 $800 to $899162 $900 to $999367 $1,000 to $1,249177 $1,250 to $1,499442 $1,500 to $1,99967 $2,000 to $2,49967 No cash rent
Median gross rent in 2022: $1,484.
Median price asked for vacant for-sale houses and condos in 2022: $2,097,411.
Estimated median house (or condo) value in 2022 for: White Non-Hispanic householders: $498,888Black or African American householders: $605,839American Indian or Alaska Native householders: $646,228Asian householders: $369,319Some other race householders: $492,103Two or more races householders: $828,142Hispanic or Latino householders: $476,593Estimated median house or condo value in 2022: $498,889
84414:
$498,889Utah:
$499,500
Lower value quartile - upper value quartile: $399,433 - $652,760
Mean price in 2022: Detached houses: $582,829Here:
$582,829State:
$607,750
Townhouses or other attached units: $347,863Here:
$347,863State:
$444,505
In 2-unit structures: $344,985Here:
$344,985State:
$433,540
In 3-to-4-unit structures: $221,601Here:
$221,601State:
$362,850
In 5-or-more-unit structures: $262,288Here:
$262,288State:
$412,810
Housing units in structures:
One, detached: 8,746One, attached: 929Two: 2523 or 4: 4275 to 9: 11210 to 19: 12020 to 49: 2250 or more: 68Mobile homes: 15Unemployment : 2.4%
Means of transportation to work in zip code 84414 72.8% 12,395 Drove a car alone6.7% 1,145 Carpooled0.3% 58 Bus or trolley bus0.1% 10 Streetcar or trolley car0.2% 28 Subway or elevated0.0% 6 Motorcycle1.0% 177 Walked0.9% 157 Other means17.9% 3,046 Worked at homeTravel time to work (commute) in zip code 84414 359 Less than 5 minutes1,166 5 to 9 minutes2,249 10 to 14 minutes2,095 15 to 19 minutes2,605 20 to 24 minutes1,816 25 to 29 minutes1,386 30 to 34 minutes181 35 to 39 minutes170 40 to 44 minutes852 45 to 59 minutes872 60 to 89 minutes219 90 or more minutes
Percentage of zip code residents living and working in this county: 73.2%
Household type by relationship:
Households: 33,550
Male householders: 5,461 (481 living alone ), Female householders: 5,150 (935 living alone )7,142 spouses (7,099 opposite-sex spouses ), 340 unmarried partners , (340 opposite-sex unmarried partners ), 12,115 children (11,340 natural , 228 adopted , 555 stepchildren ), 1,515 grandchildren , 143 brothers or sisters , 276 parents , 228 foster children , 451 other relatives , 621 non-relatives In group quarters: 26 (-1 institutionalized population )
Size of family households: 3,103 2-persons , 1,832 3-persons , 1,689 4-persons , 1,096 5-persons , 664 6-persons , 580 7-or-more-persons
Size of nonfamily households: 1,424 1-person , 90 2-persons , 57 3-persons , 44 5-persons
6,810 married couples with children. single-parent households (542 men , 800 women ).
91.5% of residents of 84414 zip code speak English at home. of residents speak Spanish at home (91% very well, 7% well, 1% not well, 1% not at all ).of residents speak other Indo-European language at home (95% very well, 5% well ).of residents speak Asian or Pacific Island language at home (54% very well, 38% well, 1% not well, 7% not at all ).
Foreign born population: 1,043 (3.1%)
(54.2%
of them are naturalized citizens )
This zip code:
3.1%Whole state:
8.6%
40% Honduras 10% Haiti 8% Sweden 7% United Kingdom, excluding England and Scotland 4% Nepal 3% Belize 3% Hong Kong 31% English 13% Scottish 6% American 5% European 5% German 3% Norwegian 2% Danish
Year of entry for the foreign-born population
162 2010 or later 182 2000 to 2009 269 1990 to 1999 625 Before 1990
Facilities with environmental interests located in this zip code:
ADMIRAL BEVERAGE CORPORATION (2751 N. 1000 W. in OGDEN, UT)
STATE MASTER (Utah compliance and permitting operations) - UST DATABASE-4, UNDERGROUND STORAGE TANK PROGRAM TRI REPORTER (Tracking of toxic chemicals releasing facilities) Business SIC classification: BOTTLED AND CANNED SOFT DRINKS AND CARBONATED WATERS
BATES ELEM SCH (850 E 3100 N in OGDEN, UT)
(National Center for Education Statistics) - STATE ID-35 100 Organizations: WEBER SCHOOL DISTRICT (SCHOOL DISTRICT)
GREEN ACRES ELEM SCH (640 E 1900 N in OGDEN, UT)
(National Center for Education Statistics) - STATE ID-35 111 Organizations: WEBER SCHOOL DISTRICT (SCHOOL DISTRICT)
LOMOND VIEW ELEM SCH (3644 N 900 W in OGDEN, UT)
(National Center for Education Statistics) - STATE ID-35 120 Organizations: WEBER SCHOOL DISTRICT (SCHOOL DISTRICT)
MAJESTIC ELEM SCH (425 W 2550 N in OGDEN, UT)
(National Center for Education Statistics) - STATE ID-35 121 Organizations: WEBER SCHOOL DISTRICT (SCHOOL DISTRICT)
COLD SPRINGS TROUT FARM (COLD WATER CANYON in NORTH OGDEN, UT)
National Pollutant Discharge Elimination System NON-MAJOR (Tracking pollutant discharge elimination systems) - permit Business SIC classification: FISH HATCHERIES AND PRESERVES
COLONIAL SPRINGS TOWNHOMES - PHASE II (2550 N AND 125 W in OGDEN, UT)
ENFORCEMENT/COMPLIANCE ACTIVITY (Integrated Compliance Information System) Alternative names: COLONIAL SPRINGS TOWNHOMES - ALDERWOOD HOMES
COLONIAL SPRINGS TOWNHOMES - PHASE III (2550 N AND 125 W in OGDEN, UT)
ENFORCEMENT/COMPLIANCE ACTIVITY (Integrated Compliance Information System) Alternative names: COLONIAL SPRINGS TOWNHOMES - NORM FROST DEVELOPER
MAJESTIC ELEMENTARY (425 WEST 2550 NORTH in OGDEN, UT)
COMPLIANCE ACTIVITY (Tracking inspections of insecticide, fungicide, and rodenticide, and toxic substances)
Housing units lacking complete plumbing facilities: 0.1%
Housing units lacking complete kitchen facilities: 0.1%
89.8% Utility gas 9.1% Electricity 0.9% Bottled, tank, or LP gas
Population in 1990: 16,891. Population change in the 1990s: +4,000 (+23.7%).
Place of birth for U.S.-born residents:
This state: 22,931Northeast: 603Midwest: 1,564South: 1,067West: 5,983
59% of the 84414 zip code residents lived in the same house 5 years ago.
Out of people who lived in different houses, 56% lived in this county.
Out of people who lived in different counties, 50% lived in Utah.
89% of the 84414 zip code residents lived in the same house 1 year ago.
Out of people who lived in different houses, 44% moved from this county.
Out of people who lived in different houses, 26% moved from different county within same state.
Out of people who lived in different houses, 27% moved from different state.
Out of people who lived in different houses, 5% moved from abroad.
Private vs. public school enrollment:
Students in private schools in grades 1 to 8 (elementary and middle school): 122
Students in private schools in grades 9 to 12 (high school): 52
Students in private undergraduate colleges: 158
Occupation by median earnings in the past 12 months ($)
142,752 Legal occupations 93,086 Computer and mathematical occupations 90,804 Life, physical, and social science occupations 88,651 Law enforcement workers including supervisors 81,282 Architecture and engineering occupations 77,881 Fire fighting and prevention, and other protective service workers including supervisors
Companies with federal contracts located in this zip code:
TREASURE FIRE EQUIPMENT INC (1460 W PLEASANT VIEW DR in OGDEN, UT; small business) in 2 contracts in 2003
$29,016 with Air Force for Valves, Powered. Signed on 2003-07-07. Completion date: 2003-07-07.
with Air Force for Facilities Operations Support Services. Signed on 2003-05-29. Completion date: 2004-01-12.
RSI CONSTRUCTION AND CONTRACTI (939 W 4000 N in OGDEN, UT; small business)
$15,200 with Air Force for Maintenance, Repair or Alteration of Real Property -- Maintenance Buildings. Signed on 2005-08-10. Completion date: 2005-10-19.
K D K TRAILERS LLC (651 W 2550 N in OGDEN, UT; small business) in 2 contracts in 2003
$6,800 with Air Force for Maintenance, Repair and Rebuilding of Equipment -- Ground Effect Vehicles, Motor Vehicles, Trailers, and Cycles. Signed on 2003-03-10. Completion date: 2003-04-10.
, same as above. Signed on 2003-03-19. Completion date: 2003-04-18.
Top industries in this zip code by the number of employees in 2005:
Accommodation and Food Services: Limited-Service Restaurants (20-49 employees: 6 establishments, 10-19 employees: 2 establishments)Construction: New Single-Family Housing Construction (except Operative Builders) (20-49: 1, 5-9: 2, 1-4: 24)Health Care and Social Assistance: Offices of Dentists (10-19: 4, 5-9: 2, 1-4: 10)Professional, Scientific, and Technical Services: All Other Professional, Scientific, and Technical Services (50-99: 1, 10-19: 1, 1-4: 1)Accommodation and Food Services: Full-Service Restaurants (20-49: 2, 10-19: 1, 5-9: 1)Construction: Plumbing, Heating, and Air-Conditioning Contractors (10-19: 1, 5-9: 3, 1-4: 13)Construction: Poured Concrete Foundation and Structure Contractors (20-49: 1, 1-4: 6)Construction: Masonry Contractors (20-49: 1, 5-9: 1, 1-4: 2)Construction: Roofing Contractors (10-19: 1, 5-9: 2, 1-4: 6)
People in group quarters in 2010:
8 people in residential treatment centers for juveniles (non-correctional)
4 people in group homes intended for adults
People in group quarters in 2000:
15 people in other noninstitutional group quarters
Fatal accident statistics in 2013:
Fatal accident count: 1Vehicles involved in fatal accidents: 1Fatal accidents caused by drunken drivers: 0Fatalities: 1Persons involved in fatal accidents: 2Pedestrians involved in fatal accidents: 1
Fatal accident statistics in 2010:
Fatal accident count: 1Vehicles involved in fatal accidents: 1Fatal accidents caused by drunken drivers: 1Fatalities: 1Persons involved in fatal accidents: 1Pedestrians involved in fatal accidents: 0
Home Mortgage Disclosure Act Aggregated Statistics For Year 2009(Based on 3 full and 8 partial tracts) A) FHA, FSA/RHS & VA B) Conventional C) Refinancings D) Home Improvement Loans F) Non-occupant Loans on G) Loans On Manufactured Number Average Value Number Average Value Number Average Value Number Average Value Number Average Value Number Average Value
LOANS ORIGINATED 306 $189,877 232 $224,626 2,325 $184,831 73 $72,077 71 $212,226 3 $157,550 APPLICATIONS APPROVED, NOT ACCEPTED 17 $184,816 24 $265,376 202 $178,909 11 $43,802 11 $193,723 0 $0 APPLICATIONS DENIED 36 $198,306 29 $188,932 514 $217,116 18 $79,962 38 $216,449 4 $91,720 APPLICATIONS WITHDRAWN 45 $199,978 32 $248,091 299 $199,941 17 $87,276 14 $165,986 0 $0 FILES CLOSED FOR INCOMPLETENESS 5 $168,426 9 $263,000 72 $201,300 1 $110,690 6 $217,348 0 $0
Aggregated Statistics For Year 2008(Based on 3 full and 8 partial tracts) A) FHA, FSA/RHS & VA B) Conventional C) Refinancings D) Home Improvement Loans E) Loans on Dwellings For 5+ Families F) Non-occupant Loans on G) Loans On Manufactured Number Average Value Number Average Value Number Average Value Number Average Value Number Average Value Number Average Value Number Average Value
LOANS ORIGINATED 250 $179,539 438 $206,102 1,245 $179,758 107 $80,542 1 $108,200 110 $213,093 9 $43,180 APPLICATIONS APPROVED, NOT ACCEPTED 11 $180,004 39 $242,703 182 $189,010 25 $77,553 0 $0 21 $153,336 2 $27,735 APPLICATIONS DENIED 25 $189,216 79 $253,189 399 $211,286 67 $77,891 1 $208,830 51 $211,693 4 $52,315 APPLICATIONS WITHDRAWN 25 $166,820 54 $231,114 234 $206,456 16 $103,103 0 $0 22 $191,709 0 $0 FILES CLOSED FOR INCOMPLETENESS 5 $169,410 7 $181,219 21 $212,458 3 $19,223 0 $0 2 $199,070 0 $0
Aggregated Statistics For Year 2007(Based on 3 full and 8 partial tracts) A) FHA, FSA/RHS & VA B) Conventional C) Refinancings D) Home Improvement Loans E) Loans on Dwellings For 5+ Families F) Non-occupant Loans on G) Loans On Manufactured Number Average Value Number Average Value Number Average Value Number Average Value Number Average Value Number Average Value Number Average Value
LOANS ORIGINATED 139 $163,930 1,035 $176,512 1,197 $170,383 156 $63,241 1 $3,430,480 224 $196,422 5 $91,308 APPLICATIONS APPROVED, NOT ACCEPTED 4 $124,970 87 $185,676 175 $181,780 48 $63,650 0 $0 23 $205,203 3 $52,443 APPLICATIONS DENIED 22 $145,745 211 $214,185 519 $199,371 81 $78,107 0 $0 104 $246,596 12 $45,550 APPLICATIONS WITHDRAWN 25 $157,995 100 $208,581 250 $204,458 17 $85,464 0 $0 36 $221,958 2 $44,375 FILES CLOSED FOR INCOMPLETENESS 2 $212,360 6 $337,507 51 $194,374 3 $38,063 0 $0 1 $352,420 0 $0
Aggregated Statistics For Year 2006(Based on 3 full and 8 partial tracts) A) FHA, FSA/RHS & VA B) Conventional C) Refinancings D) Home Improvement Loans E) Loans on Dwellings For 5+ Families F) Non-occupant Loans on G) Loans On Manufactured Number Average Value Number Average Value Number Average Value Number Average Value Number Average Value Number Average Value Number Average Value
LOANS ORIGINATED 133 $151,763 1,329 $143,456 1,136 $155,276 160 $57,630 4 $497,718 300 $161,635 5 $124,286 APPLICATIONS APPROVED, NOT ACCEPTED 2 $159,240 161 $137,323 155 $146,333 35 $46,910 0 $0 61 $125,028 0 $0 APPLICATIONS DENIED 12 $130,106 291 $135,460 433 $152,183 69 $44,987 0 $0 91 $138,402 8 $81,038 APPLICATIONS WITHDRAWN 2 $93,595 183 $129,701 252 $153,110 26 $43,278 0 $0 44 $137,045 0 $0 FILES CLOSED FOR INCOMPLETENESS 0 $0 29 $119,917 68 $153,924 6 $63,823 0 $0 8 $138,808 0 $0
Aggregated Statistics For Year 2005(Based on 3 full and 8 partial tracts) A) FHA, FSA/RHS & VA B) Conventional C) Refinancings D) Home Improvement Loans F) Non-occupant Loans on G) Loans On Manufactured Number Average Value Number Average Value Number Average Value Number Average Value Number Average Value Number Average Value
LOANS ORIGINATED 152 $129,125 1,232 $126,624 1,207 $136,982 97 $58,558 216 $125,891 2 $36,790 APPLICATIONS APPROVED, NOT ACCEPTED 0 $0 118 $111,335 183 $124,706 31 $112,534 29 $127,305 5 $53,540 APPLICATIONS DENIED 12 $110,653 256 $127,717 459 $134,692 61 $44,459 38 $136,510 11 $46,561 APPLICATIONS WITHDRAWN 4 $112,042 211 $131,903 317 $167,511 22 $197,646 30 $150,820 0 $0 FILES CLOSED FOR INCOMPLETENESS 1 $58,970 27 $116,170 132 $168,974 10 $32,824 5 $164,250 0 $0
Aggregated Statistics For Year 2004(Based on 3 full and 8 partial tracts) A) FHA, FSA/RHS & VA B) Conventional C) Refinancings D) Home Improvement Loans E) Loans on Dwellings For 5+ Families F) Non-occupant Loans on G) Loans On Manufactured Number Average Value Number Average Value Number Average Value Number Average Value Number Average Value Number Average Value Number Average Value
LOANS ORIGINATED 188 $127,997 844 $122,771 1,489 $139,246 87 $37,330 2 $414,335 156 $124,182 12 $67,444 APPLICATIONS APPROVED, NOT ACCEPTED 4 $141,170 96 $120,158 222 $147,690 18 $72,761 0 $0 29 $118,817 4 $26,205 APPLICATIONS DENIED 16 $124,315 162 $120,509 502 $154,495 54 $42,384 0 $0 37 $115,421 5 $36,810 APPLICATIONS WITHDRAWN 21 $120,715 126 $115,565 386 $144,489 10 $55,371 0 $0 35 $106,334 1 $65,250 FILES CLOSED FOR INCOMPLETENESS 1 $200,400 33 $114,215 121 $165,567 11 $56,357 0 $0 11 $91,955 0 $0
Aggregated Statistics For Year 2003(Based on 3 full and 8 partial tracts) A) FHA, FSA/RHS & VA B) Conventional C) Refinancings D) Home Improvement Loans F) Non-occupant Loans on Number Average Value Number Average Value Number Average Value Number Average Value Number Average Value
LOANS ORIGINATED 252 $127,410 701 $129,501 3,276 $132,557 81 $29,000 147 $128,185 APPLICATIONS APPROVED, NOT ACCEPTED 5 $163,956 80 $121,581 300 $123,596 6 $71,325 27 $114,076 APPLICATIONS DENIED 16 $119,529 112 $141,097 527 $143,524 32 $16,972 66 $111,292 APPLICATIONS WITHDRAWN 17 $128,114 100 $128,498 434 $154,172 4 $7,870 32 $115,864 FILES CLOSED FOR INCOMPLETENESS 4 $126,568 25 $84,921 123 $140,106 3 $36,927 6 $109,437
Aggregated Statistics For Year 2002(Based on 3 full and 8 partial tracts) A) FHA, FSA/RHS & VA B) Conventional C) Refinancings D) Home Improvement Loans E) Loans on Dwellings For 5+ Families F) Non-occupant Loans on Number Average Value Number Average Value Number Average Value Number Average Value Number Average Value Number Average Value
LOANS ORIGINATED 189 $123,759 526 $135,897 2,205 $133,863 81 $26,734 1 $121,730 108 $126,293 APPLICATIONS APPROVED, NOT ACCEPTED 9 $150,996 70 $118,266 252 $134,372 14 $36,994 0 $0 15 $130,023 APPLICATIONS DENIED 11 $129,013 142 $101,099 379 $132,906 48 $14,855 0 $0 35 $122,073 APPLICATIONS WITHDRAWN 22 $122,617 60 $132,807 426 $149,804 10 $51,136 0 $0 25 $128,185 FILES CLOSED FOR INCOMPLETENESS 3 $123,250 46 $117,335 119 $144,787 1 $15,000 0 $0 9 $143,198
Aggregated Statistics For Year 2001(Based on 3 full and 8 partial tracts) A) FHA, FSA/RHS & VA B) Conventional C) Refinancings D) Home Improvement Loans F) Non-occupant Loans on Number Average Value Number Average Value Number Average Value Number Average Value Number Average Value
LOANS ORIGINATED 232 $117,001 480 $132,584 1,939 $123,398 105 $33,958 95 $116,165 APPLICATIONS APPROVED, NOT ACCEPTED 3 $92,163 53 $109,778 165 $116,903 22 $26,983 13 $120,292 APPLICATIONS DENIED 16 $106,970 213 $73,355 469 $126,004 38 $25,482 11 $116,724 APPLICATIONS WITHDRAWN 16 $112,805 83 $145,663 351 $150,060 11 $26,089 11 $163,139 FILES CLOSED FOR INCOMPLETENESS 3 $124,003 22 $147,610 118 $148,025 6 $38,247 3 $189,560
Aggregated Statistics For Year 2000(Based on 3 full and 8 partial tracts) A) FHA, FSA/RHS & VA B) Conventional C) Refinancings D) Home Improvement Loans E) Loans on Dwellings For 5+ Families F) Non-occupant Loans on Number Average Value Number Average Value Number Average Value Number Average Value Number Average Value Number Average Value
LOANS ORIGINATED 165 $113,336 555 $125,802 584 $116,918 139 $25,289 2 $117,810 54 $112,687 APPLICATIONS APPROVED, NOT ACCEPTED 3 $107,770 104 $75,769 86 $110,311 31 $30,227 0 $0 5 $105,824 APPLICATIONS DENIED 18 $112,313 307 $91,277 309 $119,790 40 $23,909 0 $0 12 $164,864 APPLICATIONS WITHDRAWN 5 $97,896 75 $131,685 159 $130,756 16 $74,650 0 $0 6 $83,963 FILES CLOSED FOR INCOMPLETENESS 0 $0 25 $146,305 105 $130,463 1 $10,820 0 $0 7 $245,236
Aggregated Statistics For Year 1999(Based on 2 full and 5 partial tracts) A) FHA, FSA/RHS & VA B) Conventional C) Refinancings D) Home Improvement Loans E) Loans on Dwellings For 5+ Families F) Non-occupant Loans on Number Average Value Number Average Value Number Average Value Number Average Value Number Average Value Number Average Value
LOANS ORIGINATED 116 $108,193 332 $126,420 725 $108,042 69 $20,562 2 $406,870 24 $117,816 APPLICATIONS APPROVED, NOT ACCEPTED 2 $156,295 40 $111,467 117 $108,898 18 $17,098 0 $0 5 $80,596 APPLICATIONS DENIED 10 $110,400 100 $93,365 223 $115,861 20 $18,358 0 $0 4 $143,980 APPLICATIONS WITHDRAWN 15 $102,923 46 $127,619 168 $126,956 18 $84,860 0 $0 5 $140,106 FILES CLOSED FOR INCOMPLETENESS 3 $114,873 10 $141,235 95 $126,861 2 $87,270 0 $0 1 $147,640
Private Mortgage Insurance Companies Aggregated Statistics For Year 2009(Based on 3 full and 8 partial tracts) A) Conventional B) Refinancings C) Non-occupant Loans on Number Average Value Number Average Value Number Average Value
LOANS ORIGINATED 44 $225,969 117 $204,418 2 $179,815 APPLICATIONS APPROVED, NOT ACCEPTED 7 $376,040 51 $228,312 0 $0 APPLICATIONS DENIED 17 $257,358 38 $224,082 0 $0 APPLICATIONS WITHDRAWN 9 $185,342 34 $212,730 0 $0 FILES CLOSED FOR INCOMPLETENESS 1 $60,050 0 $0 0 $0
Aggregated Statistics For Year 2008(Based on 3 full and 8 partial tracts) A) Conventional B) Refinancings C) Non-occupant Loans on Number Average Value Number Average Value Number Average Value
LOANS ORIGINATED 170 $224,900 115 $218,878 27 $200,475 APPLICATIONS APPROVED, NOT ACCEPTED 60 $259,643 57 $216,282 24 $253,678 APPLICATIONS DENIED 2 $426,900 12 $251,981 4 $264,100 APPLICATIONS WITHDRAWN 8 $293,454 7 $305,536 2 $193,655 FILES CLOSED FOR INCOMPLETENESS 4 $240,938 2 $220,070 4 $309,315
Aggregated Statistics For Year 2007(Based on 3 full and 8 partial tracts) A) Conventional B) Refinancings C) Non-occupant Loans on Number Average Value Number Average Value Number Average Value
LOANS ORIGINATED 262 $193,219 114 $222,095 53 $207,728 APPLICATIONS APPROVED, NOT ACCEPTED 33 $206,136 32 $264,962 8 $231,422 APPLICATIONS DENIED 10 $276,538 1 $207,840 4 $244,128 APPLICATIONS WITHDRAWN 10 $203,069 3 $242,773 3 $220,647 FILES CLOSED FOR INCOMPLETENESS 2 $204,670 1 $110,910 0 $0
Aggregated Statistics For Year 2006(Based on 3 full and 8 partial tracts) A) Conventional B) Refinancings C) Non-occupant Loans on Number Average Value Number Average Value Number Average Value
LOANS ORIGINATED 162 $175,477 70 $210,259 28 $175,488 APPLICATIONS APPROVED, NOT ACCEPTED 28 $229,598 26 $247,360 3 $227,140 APPLICATIONS DENIED 2 $282,605 4 $271,065 4 $187,502 APPLICATIONS WITHDRAWN 7 $218,756 4 $218,412 4 $146,510 FILES CLOSED FOR INCOMPLETENESS 0 $0 0 $0 0 $0
Aggregated Statistics For Year 2005(Based on 3 full and 8 partial tracts) A) Conventional B) Refinancings C) Non-occupant Loans on Number Average Value Number Average Value Number Average Value
LOANS ORIGINATED 131 $171,494 106 $181,366 25 $137,047 APPLICATIONS APPROVED, NOT ACCEPTED 28 $183,044 30 $201,578 7 $132,830 APPLICATIONS DENIED 1 $383,860 2 $253,350 0 $0 APPLICATIONS WITHDRAWN 14 $177,099 12 $220,027 2 $304,390 FILES CLOSED FOR INCOMPLETENESS 1 $89,470 4 $207,100 0 $0
Aggregated Statistics For Year 2004(Based on 3 full and 8 partial tracts) A) Conventional B) Refinancings C) Non-occupant Loans on D) Loans On Manufactured Number Average Value Number Average Value Number Average Value Number Average Value
LOANS ORIGINATED 99 $155,667 125 $164,515 18 $126,975 2 $157,745 APPLICATIONS APPROVED, NOT ACCEPTED 12 $185,394 40 $190,906 6 $179,038 0 $0 APPLICATIONS DENIED 4 $169,770 0 $0 0 $0 0 $0 APPLICATIONS WITHDRAWN 6 $186,338 17 $179,955 3 $122,220 0 $0 FILES CLOSED FOR INCOMPLETENESS 0 $0 0 $0 0 $0 0 $0
Aggregated Statistics For Year 2003(Based on 3 full and 8 partial tracts) A) Conventional B) Refinancings C) Non-occupant Loans on Number Average Value Number Average Value Number Average Value
LOANS ORIGINATED 134 $153,406 396 $151,926 26 $132,704 APPLICATIONS APPROVED, NOT ACCEPTED 15 $189,453 91 $167,707 9 $111,978 APPLICATIONS DENIED 8 $206,878 7 $133,599 1 $372,550 APPLICATIONS WITHDRAWN 10 $150,809 36 $160,052 1 $70,330 FILES CLOSED FOR INCOMPLETENESS 0 $0 0 $0 0 $0
Aggregated Statistics For Year 2002(Based on 3 full and 8 partial tracts) A) Conventional B) Refinancings C) Non-occupant Loans on Number Average Value Number Average Value Number Average Value
LOANS ORIGINATED 145 $160,757 223 $163,224 26 $142,792 APPLICATIONS APPROVED, NOT ACCEPTED 35 $140,749 59 $165,669 13 $108,454 APPLICATIONS DENIED 2 $126,785 4 $139,890 3 $113,560 APPLICATIONS WITHDRAWN 5 $156,522 17 $154,610 2 $100,580 FILES CLOSED FOR INCOMPLETENESS 0 $0 1 $67,630 1 $67,630
Aggregated Statistics For Year 2001(Based on 3 full and 8 partial tracts) A) Conventional B) Refinancings C) Non-occupant Loans on Number Average Value Number Average Value Number Average Value
LOANS ORIGINATED 154 $162,375 223 $150,214 23 $108,255 APPLICATIONS APPROVED, NOT ACCEPTED 24 $162,666 43 $158,399 5 $112,790 APPLICATIONS DENIED 6 $141,892 10 $144,260 4 $119,010 APPLICATIONS WITHDRAWN 7 $178,703 11 $168,221 4 $121,305 FILES CLOSED FOR INCOMPLETENESS 0 $0 1 $63,840 0 $0
Aggregated Statistics For Year 2000(Based on 3 full and 8 partial tracts) A) Conventional B) Refinancings C) Non-occupant Loans on Number Average Value Number Average Value Number Average Value
LOANS ORIGINATED 131 $152,930 66 $155,943 6 $149,158 APPLICATIONS APPROVED, NOT ACCEPTED 14 $142,734 14 $162,651 1 $153,410 APPLICATIONS DENIED 3 $166,620 4 $147,818 0 $0 APPLICATIONS WITHDRAWN 5 $125,472 8 $202,931 2 $161,030 FILES CLOSED FOR INCOMPLETENESS 0 $0 0 $0 0 $0
Aggregated Statistics For Year 1999(Based on 2 full and 5 partial tracts) A) Conventional B) Refinancings C) Non-occupant Loans on Number Average Value Number Average Value Number Average Value
LOANS ORIGINATED 110 $143,402 78 $139,796 4 $101,798 APPLICATIONS APPROVED, NOT ACCEPTED 9 $119,543 20 $147,280 1 $135,460 APPLICATIONS DENIED 3 $146,743 5 $121,372 2 $110,835 APPLICATIONS WITHDRAWN 3 $103,830 7 $147,560 0 $0 FILES CLOSED FOR INCOMPLETENESS 0 $0 0 $0 0 $0
2002 - 2018 National Fire Incident Reporting System (NFIRS) incidents See full 2006 National Fire Incident Reporting System statistics for zip code 84414, Utah
Most common first names in zip code 84414 among deceased individuals Name Count Lived (average)
Mary 23 81.6 years John 20 70.9 years James 19 73.9 years Robert 19 70.1 years Helen 14 80.7 years William 14 78.5 years Don 12 76.5 years Richard 12 66.8 years Ruth 11 81.7 years David 11 59.5 years
Most common last names in zip code 84414 among deceased individuals Last name Count Lived (average)
Jones 19 79.6 years Johnson 17 75.6 years Anderson 16 78.6 years Barker 15 82.8 years Brown 14 84.9 years Jensen 14 75.5 years Williams 13 78.2 years Larsen 11 80.2 years Campbell 10 80.5 years Smith 10 77.3 years
Businesses in zip code 84414
Name Count Name Count
7-Eleven 1 Little Caesars Pizza 1 AutoZone 1 McDonald's 1 Big O Tires 1 Pizza Hut 1 Blockbuster 1 Subway 1 Curves 1 UPS 1 FedEx 1 Walgreens 1 H&R Block 1 Wendy's 1 Kroger 1
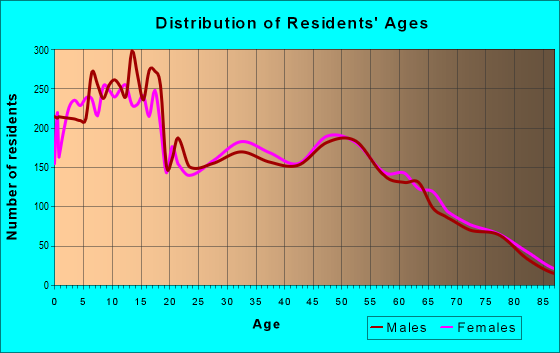
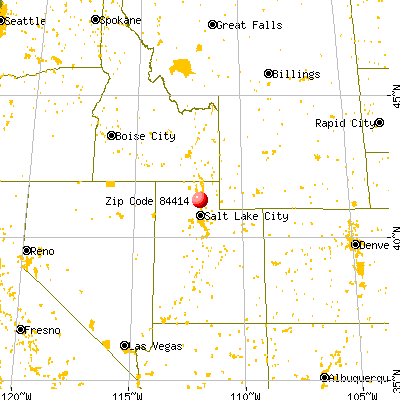


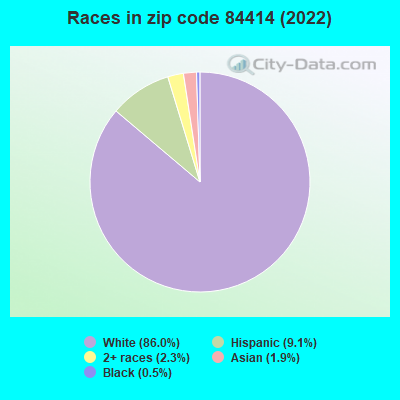


 Nearest zip codes: 84340, 84401, 84310, 84403, 84404, 84405.
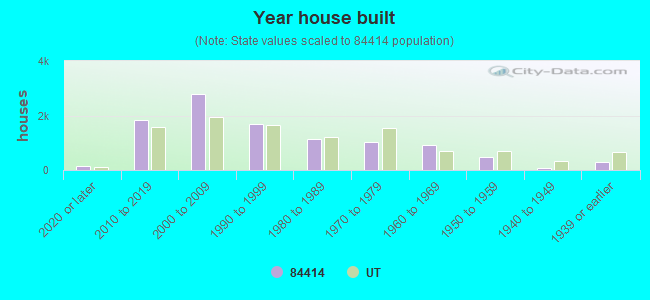
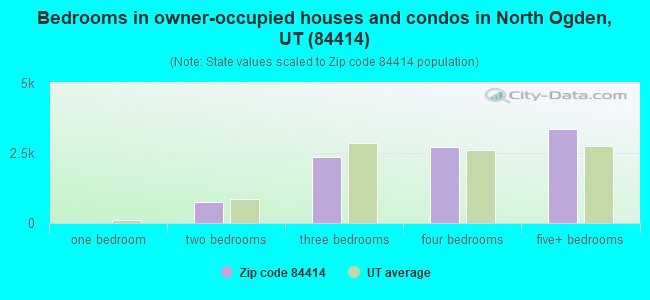
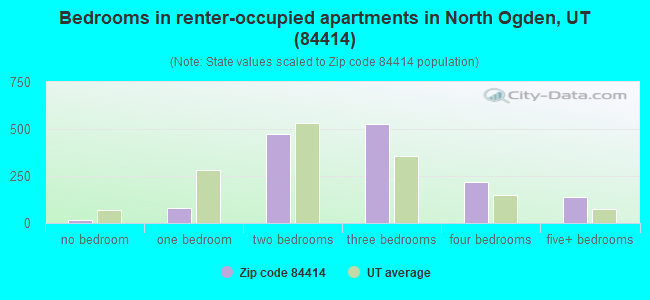
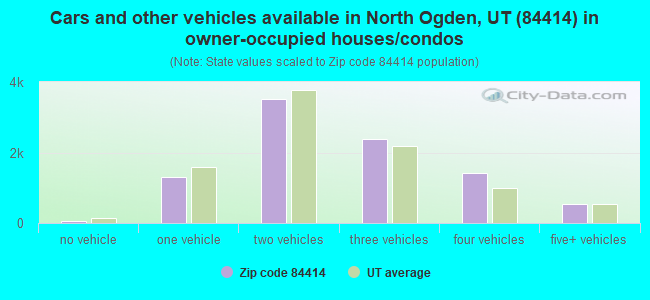
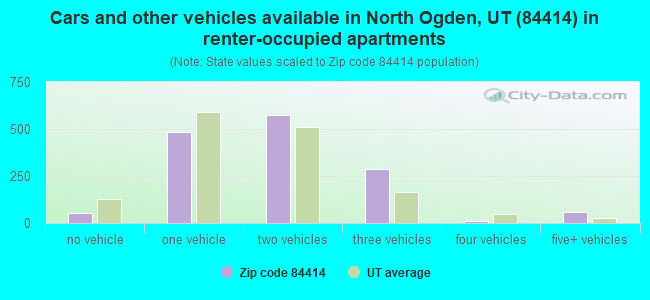


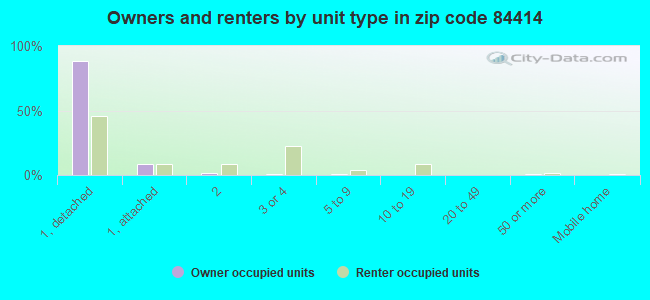
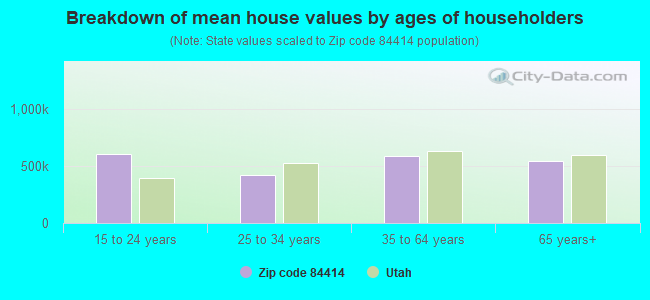


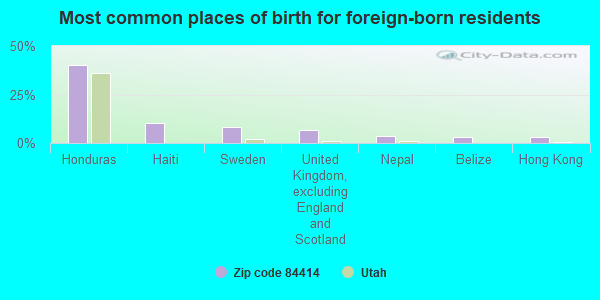
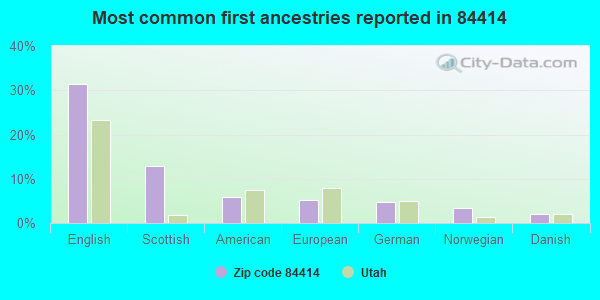
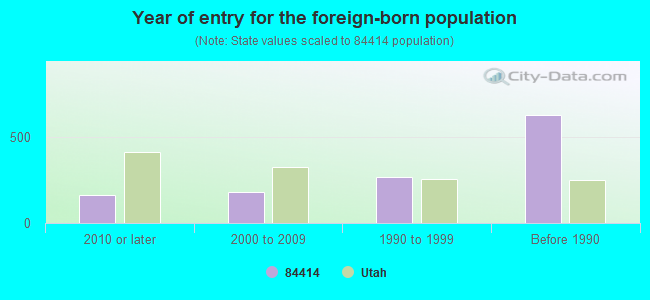
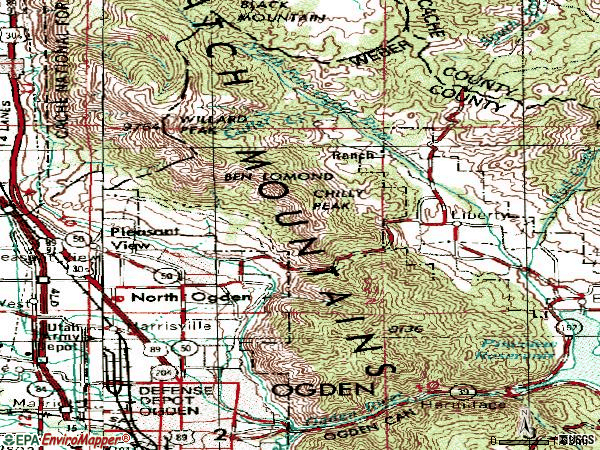


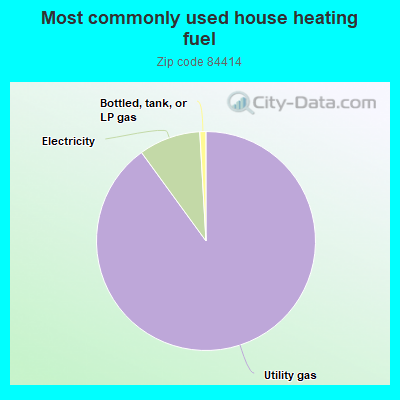
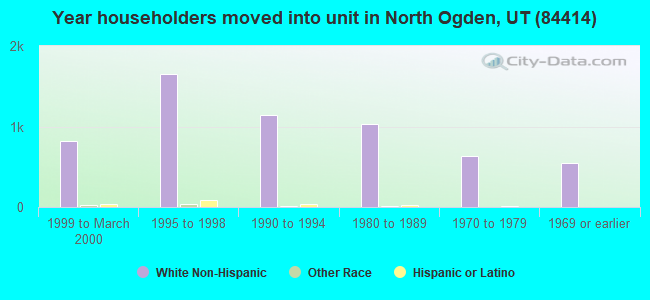
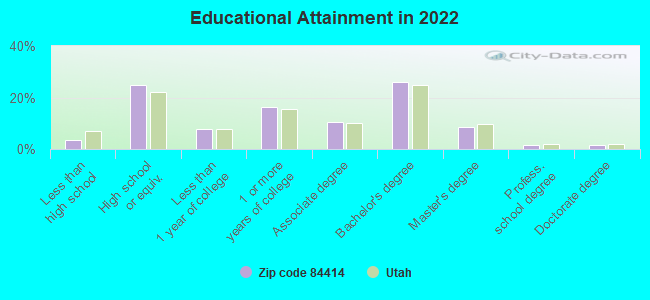
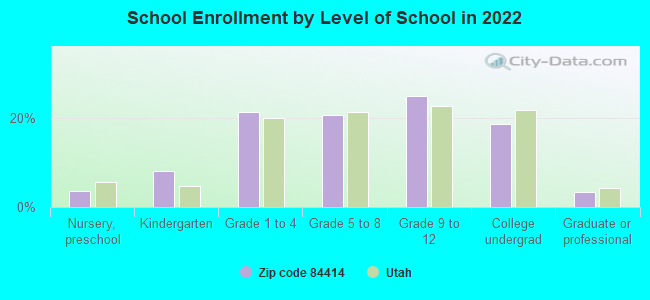
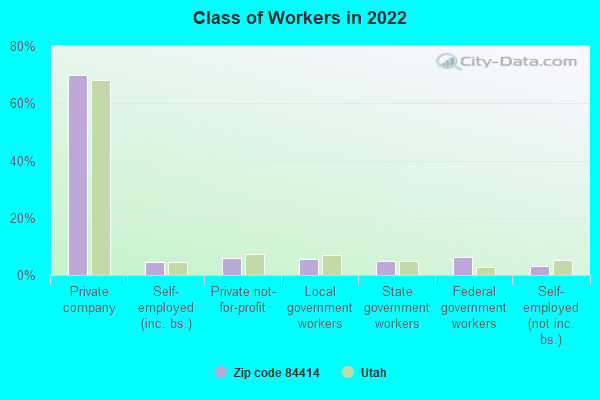
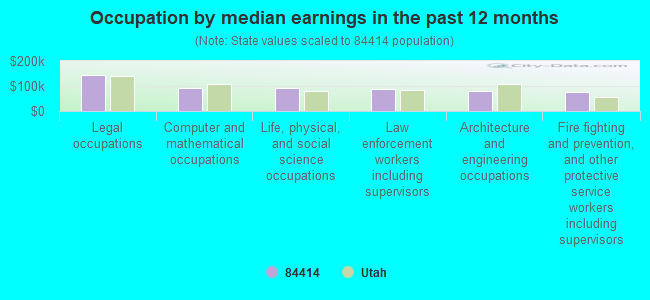
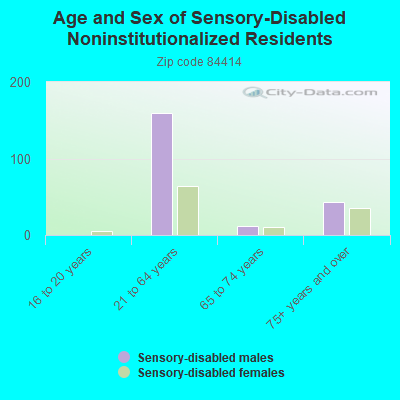
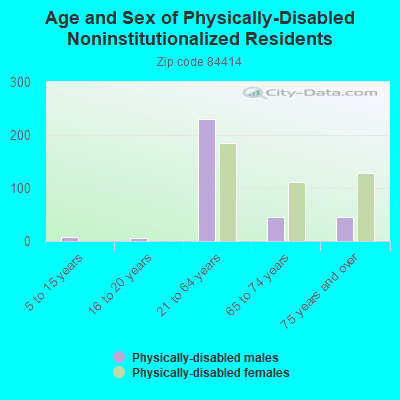
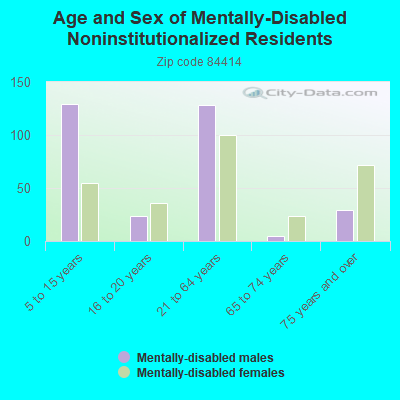
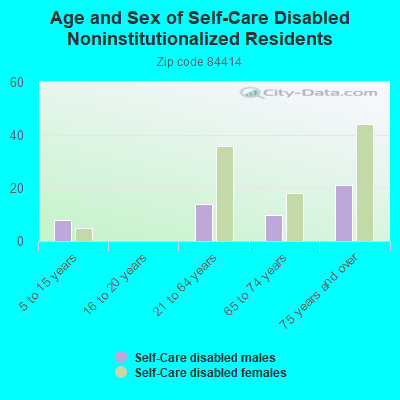
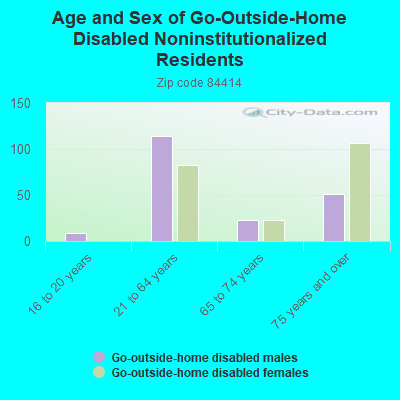
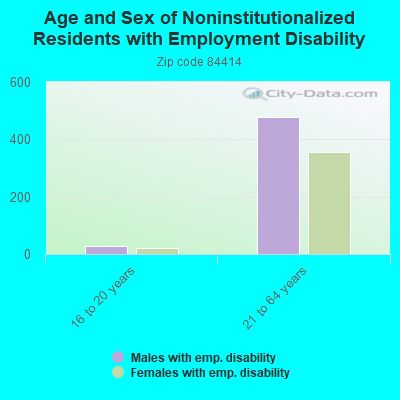
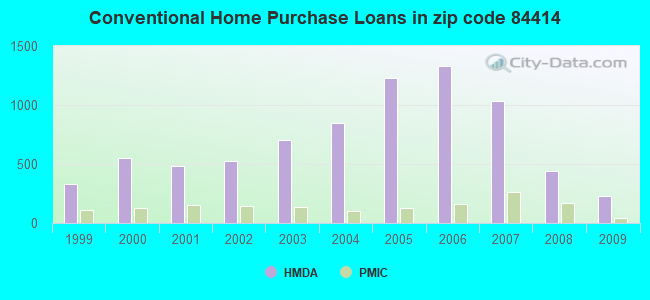
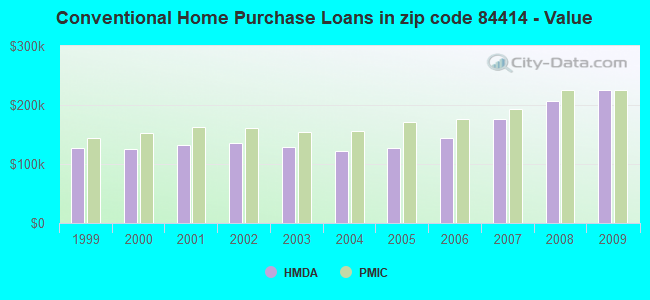
 Based on the data from the years 2002 - 2018 the average number of fire incidents per year is 40. The highest number of fires - 70 took place in 2008, and the least - 14 in 2013. The data has a declining trend.
 When looking into fire subcategories, the most incidents belonged to: Outside Fires (46.7%), and Structure Fires (36.7%).