Estimated zip code population in 2022: 14,186 Zip code population in 2010: 12,977 Zip code population in 2000: 10,832
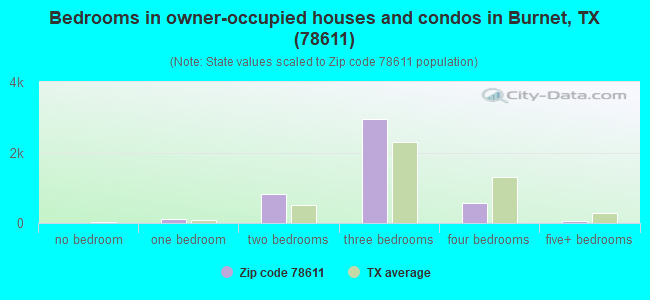
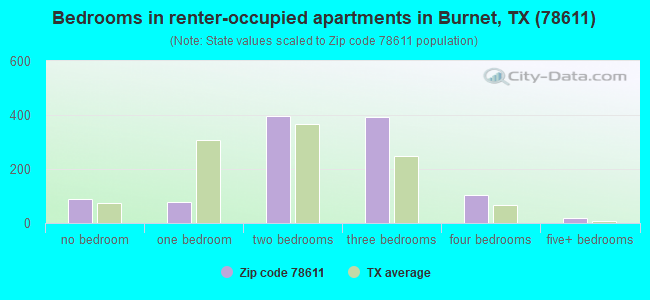
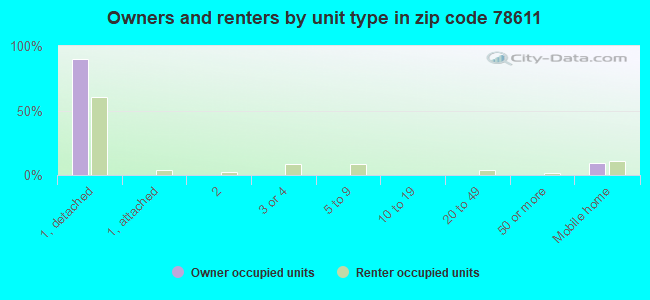
Houses and condos: 7,543 Renter-occupied apartments: 1,074
% of renters here:
19%
State:
38%
March 2022 cost of living index in zip code 78611: 81.1 (low, U.S. average is 100)
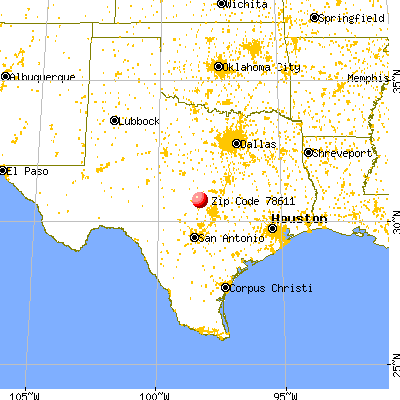
Land area: 277.7 sq. mi. Water area: 14.7 sq. mi.
Population density: 51 people per square mile
(very low).
OSM Map
General Map
Google Map
MSN Map
OSM Map
General Map
Google Map
MSN Map
OSM Map
General Map
Google Map
MSN Map
OSM Map
General Map
Google Map
MSN Map
Please wait while loading the map...
Real estate property taxes paid for housing units in 2022:
This zip code:
1.2% ($3,528)
Texas:
1.5% ($4,050)
Median real estate property taxes paid for housing units with mortgages in 2022: $4,370 (1.3%) Median real estate property taxes paid for housing units with no mortgage in 2022: $3,041 (1.1%)
Averages for the 2020 tax year for zip code 78611, filed in 2021:
Average Adjusted Gross Income (AGI) in 2020: $80,005 (Individual Income Tax Returns)
Here:
$80,005
State:
$77,054
Salary/wage: $60,009 (reported on 73.0% of returns)
Here:
$60,009
State:
$62,766
(% of AGI for various income ranges: 1181.6% for AGIs below $25k, 3572.9% for AGIs $25k-50k, 5904.6% for AGIs $50k-75k, 8389.0% for AGIs $75k-100k, 15993.1% for AGIs $100k-200k, 87521.1% for AGIs over 200k)
Taxable interest for individuals: $2,629 (reported on 30.8% of returns)
This zip code:
$2,629
Texas:
$2,665
(% of AGI for various income ranges: 25.8% for AGIs below $25k, 43.2% for AGIs $25k-50k, 80.1% for AGIs $50k-75k, 120.5% for AGIs $75k-100k, 224.5% for AGIs $100k-200k, 2710.0% for AGIs over 200k)
Ordinary dividends: $9,314 (reported on 20.5% of returns)
Here:
$9,314
State:
$10,044
(% of AGI for various income ranges: 40.7% for AGIs below $25k, 68.4% for AGIs $25k-50k, 145.3% for AGIs $50k-75k, 249.8% for AGIs $75k-100k, 484.0% for AGIs $100k-200k, 7938.9% for AGIs over 200k)
Net capital gain/loss in AGI: +$34,795 (reported on 20.2% of returns)
Here:
+$34,795
State:
+$39,590
(% of AGI for various income ranges: 21.2% for AGIs below $25k, 54.0% for AGIs $25k-50k, 110.7% for AGIs $50k-75k, 230.2% for AGIs $75k-100k, 916.0% for AGIs $100k-200k, 45880.0% for AGIs over 200k)
Profit/loss from business: +$15,595 (reported on 20.8% of returns)
Here:
+$15,595
State:
+$10,888
(% of AGI for various income ranges: 192.9% for AGIs below $25k, 265.8% for AGIs $25k-50k, 414.6% for AGIs $50k-75k, 596.7% for AGIs $75k-100k, 1058.2% for AGIs $100k-200k, 5907.8% for AGIs over 200k)
Taxable individual retirement arrangement distribution: $25,957 (reported on 12.8% of returns)
78611:
$25,957
Texas:
$24,740
(% of AGI for various income ranges: 89.4% for AGIs below $25k, 165.2% for AGIs $25k-50k, 351.1% for AGIs $50k-75k, 621.4% for AGIs $75k-100k, 1567.6% for AGIs $100k-200k, 6714.4% for AGIs over 200k)
Self-employed (Keogh) retirement plans: $18,800 (reported on 0.3% of returns)
78611:
$18,800
Texas:
$29,298
(% of AGI for various income ranges: 89.5% for AGIs $75k-100k)
Total itemized deductions: $33,535 (reported on 7.7% of returns)
Here:
$33,535
State:
$40,428
(% of AGI for various income ranges: 59.3% for AGIs below $25k, 146.2% for AGIs $25k-50k, 309.3% for AGIs $50k-75k, 323.8% for AGIs $75k-100k, 962.7% for AGIs $100k-200k, 7313.3% for AGIs over 200k)
Charity contributions: $12,512 (reported on 6.2% of returns)
Here:
$12,512
State:
$18,201
(% of AGI for various income ranges: 23.6% for AGIs $25k-50k, 62.5% for AGIs $50k-75k, 80.2% for AGIs $75k-100k, 258.7% for AGIs $100k-200k, 3194.4% for AGIs over 200k)
Taxes paid: $7,334 (reported on 7.2% of returns)
78611:
$7,334
State:
$7,821
(% of AGI for various income ranges: 12.1% for AGIs below $25k, 19.2% for AGIs $25k-50k, 59.9% for AGIs $50k-75k, 68.6% for AGIs $75k-100k, 233.6% for AGIs $100k-200k, 1395.6% for AGIs over 200k)
Earned income credit: $2,360 (reported on 15.2% of returns)
Here:
$2,360
State:
$2,584
(% of AGI for various income ranges: 104.6% for AGIs below $25k, 83.4% for AGIs $25k-50k, 2.2% for AGIs $50k-75k)
Percentage of individuals using paid preparers for their 2020 taxes: 89.8%
Here:
90%
State:
92%
(% for various income ranges: 88.1% for AGIs below $25k, 90.6% for AGIs $25k-50k, 90.5% for AGIs $50k-75k, 89.6% for AGIs $75k-100k, 90.6% for AGIs $100k-200k, 92.3% for AGIs over 200k)
Averages for the 2012 tax year for zip code 78611, filed in 2013:
Average Adjusted Gross Income (AGI) in 2012: $54,394 (Individual Income Tax Returns)
Here:
$54,394
State:
$65,384
Salary/wage: $42,292 (reported on 73.5% of returns)
Here:
$42,292
State:
$52,524
(% of AGI for various income ranges: 66.4% for AGIs below $25k, 71.3% for AGIs $25k-50k, 65.3% for AGIs $50k-75k, 60.4% for AGIs $75k-100k, 57.7% for AGIs $100k-200k, 34.9% for AGIs over 200k)
Taxable interest for individuals: $2,138 (reported on 31.2% of returns)
This zip code:
$2,138
Texas:
$2,372
(% of AGI for various income ranges: 1.8% for AGIs below $25k, 0.9% for AGIs $25k-50k, 1.2% for AGIs $50k-75k, 1.2% for AGIs $75k-100k, 1.1% for AGIs $100k-200k, 1.4% for AGIs over 200k)
Ordinary dividends: $6,175 (reported on 18.6% of returns)
Here:
$6,175
State:
$9,721
(% of AGI for various income ranges: 2.0% for AGIs below $25k, 1.2% for AGIs $25k-50k, 1.4% for AGIs $50k-75k, 2.2% for AGIs $75k-100k, 2.1% for AGIs $100k-200k, 3.2% for AGIs over 200k)
Net capital gain/loss in AGI: +$15,256 (reported on 16.8% of returns)
Here:
+$15,256
State:
+$35,319
(% of AGI for various income ranges: 0.6% for AGIs $25k-50k, 0.9% for AGIs $50k-75k, 1.4% for AGIs $75k-100k, 2.4% for AGIs $100k-200k, 16.7% for AGIs over 200k)
Profit/loss from business: +$12,940 (reported on 21.1% of returns)
Here:
+$12,940
State:
+$13,732
(% of AGI for various income ranges: 12.4% for AGIs below $25k, 4.3% for AGIs $25k-50k, 3.1% for AGIs $50k-75k, 2.9% for AGIs $75k-100k, 5.0% for AGIs $100k-200k, 5.3% for AGIs over 200k)
Taxable individual retirement arrangement distribution: $19,262 (reported on 13.8% of returns)
78611:
$19,262
Texas:
$19,511
(% of AGI for various income ranges: 4.6% for AGIs below $25k, 3.5% for AGIs $25k-50k, 4.3% for AGIs $50k-75k, 4.9% for AGIs $75k-100k, 6.3% for AGIs $100k-200k, 5.0% for AGIs over 200k)
Self-employment retirement plans: $14,767 (reported on 0.5% of returns)
78611:
$14,767
Texas:
$23,938
Total itemized deductions: $22,134 (20% of AGI, reported on 22.9% of returns)
Here:
$22,134
State:
$24,724
Here:
20.3% of AGI
State:
15.9% of AGI
(% of AGI for various income ranges: 9.2% for AGIs below $25k, 8.4% for AGIs $25k-50k, 9.7% for AGIs $50k-75k, 10.3% for AGIs $75k-100k, 12.3% for AGIs $100k-200k, 6.3% for AGIs over 200k)
Charity contributions: $5,348 (reported on 18.1% of returns)
Here:
$5,348
State:
$6,808
(% of AGI for various income ranges: 0.8% for AGIs below $25k, 1.3% for AGIs $25k-50k, 1.4% for AGIs $50k-75k, 1.7% for AGIs $75k-100k, 2.3% for AGIs $100k-200k, 2.3% for AGIs over 200k)
Taxes paid: $5,842 (reported on 22.6% of returns)
78611:
$5,842
State:
$6,921
(% of AGI for various income ranges: 1.6% for AGIs below $25k, 1.7% for AGIs $25k-50k, 2.5% for AGIs $50k-75k, 2.8% for AGIs $75k-100k, 3.6% for AGIs $100k-200k, 1.9% for AGIs over 200k)
Earned income credit: $2,439 (reported on 20.6% of returns)
Here:
$2,439
State:
$2,570
(% of AGI for various income ranges: 7.4% for AGIs below $25k, 1.5% for AGIs $25k-50k)
Percentage of individuals using paid preparers for their 2012 taxes: 47.3%
Here:
47%
State:
51%
(% for various income ranges: 44.3% for AGIs below $25k, 42.1% for AGIs $25k-50k, 52.4% for AGIs $50k-75k, 46.8% for AGIs $75k-100k, 56.0% for AGIs $100k-200k, 81.2% for AGIs over 200k)
Averages for the 2004 tax year for zip code 78611, filed in 2005:
Average Adjusted Gross Income (AGI) in 2004: $41,454 (Individual Income Tax Returns)
Here:
$41,454
State:
$47,881
Salary/wage: $33,710 (reported on 74.5% of returns)
Here:
$33,710
State:
$41,947
(% of AGI for various income ranges: 103.4% for AGIs below $10k, 69.9% for AGIs $10k-25k, 70.8% for AGIs $25k-50k, 69.1% for AGIs $50k-75k, 64.2% for AGIs $75k-100k, 41.4% for AGIs over 100k)
Taxable interest for individuals: $2,381 (reported on 40.0% of returns)
This zip code:
$2,381
Texas:
$2,255
(% of AGI for various income ranges: 10.6% for AGIs below $10k, 3.0% for AGIs $10k-25k, 2.3% for AGIs $25k-50k, 1.8% for AGIs $50k-75k, 2.5% for AGIs $75k-100k, 1.9% for AGIs over 100k)
Taxable dividends: $3,243 (reported on 21.4% of returns)
Here:
$3,243
State:
$4,261
(% of AGI for various income ranges: 4.1% for AGIs below $10k, 1.3% for AGIs $10k-25k, 0.9% for AGIs $25k-50k, 1.0% for AGIs $50k-75k, 1.5% for AGIs $75k-100k, 2.6% for AGIs over 100k)
Net capital gain/loss: +$12,824 (reported on 20.3% of returns)
Here:
+$12,824
State:
+$16,110
(% of AGI for various income ranges: -1.9% for AGIs below $10k, 0.7% for AGIs $10k-25k, 0.3% for AGIs $25k-50k, 1.9% for AGIs $50k-75k, 3.2% for AGIs $75k-100k, 16.6% for AGIs over 100k)
Profit/loss from business: +$10,913 (reported on 22.1% of returns)
Here:
+$10,913
State:
+$11,013
(% of AGI for various income ranges: 12.3% for AGIs below $10k, 9.0% for AGIs $10k-25k, 5.1% for AGIs $25k-50k, 3.1% for AGIs $50k-75k, 5.8% for AGIs $75k-100k, 6.5% for AGIs over 100k)
IRA payment deduction: $3,202 (reported on 1.9% of returns)
78611:
$3,202
Texas:
$3,120
(% of AGI for various income ranges: 1.0% for AGIs below $10k, 0.2% for AGIs $25k-50k, 0.2% for AGIs $50k-75k, 0.2% for AGIs $75k-100k, 0.1% for AGIs over 100k)
Self-employed pension: $13,679 (reported on 0.6% of returns)
Here:
$13,679
Texas:
$16,401
Total itemized deductions: $19,128 (24% of AGI, reported on 22.3% of returns)
Here:
$19,128
State:
$19,631
Here:
24.1% of AGI
State:
18.9% of AGI
(% of AGI for various income ranges: 25.1% for AGIs below $10k, 9.2% for AGIs $10k-25k, 9.0% for AGIs $25k-50k, 10.5% for AGIs $50k-75k, 12.2% for AGIs $75k-100k, 9.7% for AGIs over 100k)
Charity contributions deductions: $4,836 (6% of AGI, reported on 17.7% of returns)
Here:
$4,836
State:
$4,753
Here:
5.7% of AGI
State:
4.2% of AGI
(% of AGI for various income ranges: 1.6% for AGIs below $10k, 0.9% for AGIs $10k-25k, 1.4% for AGIs $25k-50k, 1.5% for AGIs $50k-75k, 1.9% for AGIs $75k-100k, 3.3% for AGIs over 100k)
Total tax: $6,612 (reported on 72.3% of returns)
78611:
$6,612
State:
$9,058
(% of AGI for various income ranges: 5.2% for AGIs below $10k, 4.2% for AGIs $10k-25k, 6.4% for AGIs $25k-50k, 8.8% for AGIs $50k-75k, 10.7% for AGIs $75k-100k, 19.8% for AGIs over 100k)
Earned income credit: $1,862 (reported on 19.4% of returns)
Here:
$1,862
State:
$2,024
Percentage of individuals using paid preparers for their 2004 taxes: 59.1%
Here:
59%
State:
57%
(% for various income ranges: 53.6% for AGIs below $10k, 62.1% for AGIs $10k-25k, 58.9% for AGIs $25k-50k, 56.4% for AGIs $50k-75k, 58.0% for AGIs $75k-100k, 74.7% for AGIs over 100k)
Household received Food Stamps/SNAP in the past 12 months: 368 Household did not receive Food Stamps/SNAP in the past 12 months: 5,237
Women who had a birth in the past 12 months: 40 (41 now married, 0 unmarried) Women who did not have a birth in the past 12 months: 2,796 (1,101 now married, 1,699 unmarried)
Housing units in zip code 78611 with a mortgage: 2,125 (144 second mortgage, 88 both second mortgage and home equity loan) Houses without a mortgage: 73
Median monthly owner costs for units with a mortgage: $1,822 Median monthly owner costs for units without a mortgage: $629
Residents with income below the poverty level in 2022:
This zip code:
7.9%
Whole state:
14.0%
Residents with income below 50% of the poverty level in 2022:
This zip code:
3.8%
Whole state:
7.4%
Median number of rooms in houses and condos:
Here:
5.8
State:
6.3
Median number of rooms in apartments:
Here:
4.4
State:
4.0
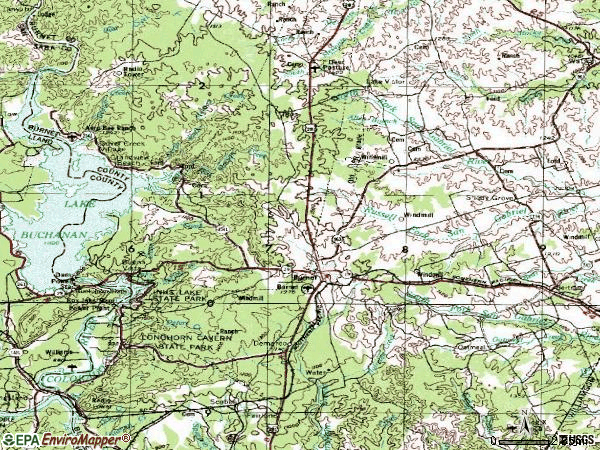
Notable locations in this zip code not listed on our city pages
Notable locations in zip code 78611: Summit (A), Inks Dam National Fish Hatchery (B), Demarco (C), Bethel Community Center (D), Buckner Boys Ranch (E), Burnet County Courthouse (F), Dublin Public Library (G), Stephenville Public Library (H), Cassie Volunteer Fire Department (I), Fort Croghan Museum (J), Burnet Fire Department (K), East Lake Bucahanan Fire Department (L). Display/hide their locations on the map
Churches in zip code 78611 include: Church of Christ (A), Temple Baptist Church (B), Parsonage Baptist Church (C), First Baptist Church (D), Saint Matthew African Methodist Episcopal Church (E), Hoover Valley Chapel (F), Lakeside Retreat Church (G). Display/hide their locations on the map
Cemeteries: Magill Cemetery (1), Pebble Mound Cemetery (2), Hoovers Valley Cemetery (3), Holland Cemetery (4), Bethel Cemetery (5), Post Mountain Cemetery (6), Flippin Cemetery (7). Display/hide their locations on the map
Streams, rivers, and creeks: Bee Creek (A), Beaver Creek (B), Allen Branch (C), Adams Creek (D), Clear Creek (E), Williams Creek (F), Silver Creek (G), South Fork Morgan Creek (H), Spring Creek (I). Display/hide their locations on the map
Parks in zip code 78611 include: Wallace Riddell Park (1), Inks Lake State Park (2), Fort Croghan Historical Site (3), Tommy White Park (4), Burnet County Park (5). Display/hide their locations on the map
In group quarters: 660 (-1 institutionalized population)
Size of family households: 2,099 2-persons, 994 3-persons, 432 4-persons, 175 5-persons, 53 6-persons, 144 7-or-more-persons
Size of nonfamily households: 1,356 1-person, 349 2-persons, 46 3-persons
1,608 married couples with children.
469 single-parent households (198 men, 271 women).
94.2% of residents of 78611 zip code speak English at home.
5.0% of residents speak Spanish at home (78% very well, 8% well, 3% not well, 12% not at all).
0.4% of residents speak other Indo-European language at home (100% very well).
0.8% of residents speak Asian or Pacific Island language at home (59% very well, 41% well).
0.1% of residents speak other language at home (100% very well).
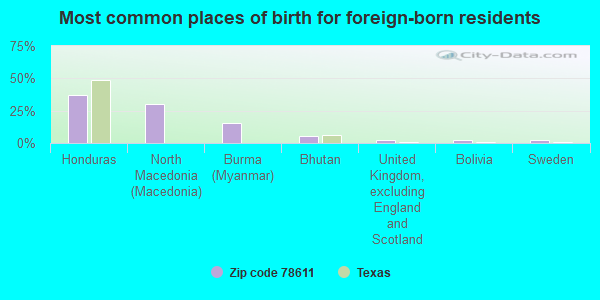
Foreign born population: 404 (2.9%) (59.9% of them are naturalized citizens)
This zip code:
2.9%
Whole state:
17.2%
37%Honduras
30%North Macedonia (Macedonia)
15%Burma (Myanmar)
6%Bhutan
3%United Kingdom, excluding England and Scotland
3%Bolivia
2%Sweden
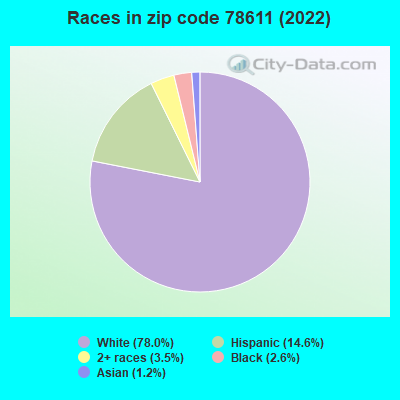
18%German
15%American
14%English
10%Irish
6%European
1%Swedish
1%Scottish
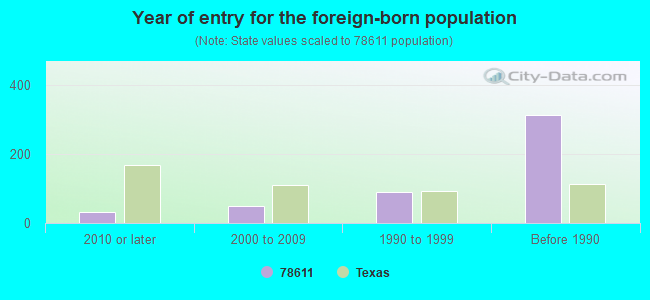
Year of entry for the foreign-born population
322010 or later
492000 to 2009
911990 to 1999
313Before 1990
Facilities with environmental interests located in this zip code:
ARISTOKRAFT PLANT 10 (HIGHWAY 281 SOUTH & ARISTOKRAFT DRIVE in BURNET, TX)
COMPLIANCE ACTIVITY (Tracking inspections of insecticide, fungicide, and rodenticide, and toxic substances) (Resource Conservation and Recovery Act (tracking hazardous waste)) TRI REPORTER (Tracking of toxic chemicals releasing facilities) Business SIC classification: WOOD KITCHEN CABINETS Business NAICS classification: METAL HOUSEHOLD FURNITURE MANUFACTURING.
ATMI MATERIALS LTD (706 HOUSTON CLINTON DRIVE in BURNET, TX)
CRITERIA AND HAZARDOUS AIR POLLUTANT INVENTORY (Inventory of air pollution sources) Large Quantity Generators, more that 1000 kg of hazardous waste/month (Resource Conservation and Recovery Act (tracking hazardous waste)) - notification TRI REPORTER (Tracking of toxic chemicals releasing facilities) Business SIC classification: INDUSTRIAL ORGANIC CHEMICALS Business NAICS classification: ALL OTHER BASIC ORGANIC CHEMICAL MANUFACTURING. Alternative names: ATMI INC., ATMI MATERIAL LTD POST MOUNTAIN
ATMI MATERIALS BURNET (304 INDUSTRIAL BOULEVARD in BURNET, TX)
HAZARDOUS WASTE BIENNIAL REPORTER (Resource Conservation and Recovery Act (tracking hazardous waste)) Large Quantity Generators, more that 1000 kg of hazardous waste/month (Resource Conservation and Recovery Act (tracking hazardous waste)) Organizations: ATMI MATERIALS LTD (CONTACT/OPERATOR)
Alternative names: ADCS INC, ADVANCED DELIVERY & CHEMICAL SYSTEMS IN
Housing units lacking complete plumbing facilities: 3.1% Housing units lacking complete kitchen facilities: 2.8%
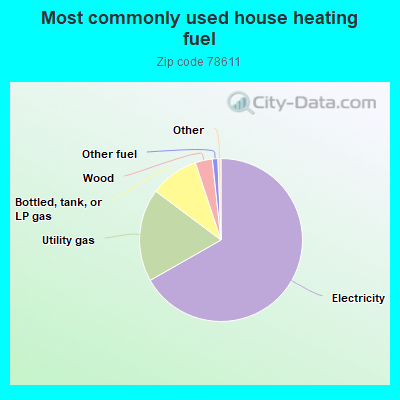
66.9%Electricity
18.5%Utility gas
9.7%Bottled, tank, or LP gas
3.4%Wood
1.1%Other fuel
Population in 1990: 8,460. Population change in the 1990s: +2,372 (+28.0%).
Place of birth for U.S.-born residents:
This state: 10,014
Northeast: 564
Midwest: 995
South: 905
West: 1,147
55% of the 78611 zip code residents lived in the same house 5 years ago. Out of people who lived in different houses, 40% lived in this county. Out of people who lived in different counties, 50% lived in Texas.
84% of the 78611 zip code residents lived in the same house 1 year ago. Out of people who lived in different houses, 35% moved from this county. Out of people who lived in different houses, 52% moved from different county within same state. Out of people who lived in different houses, 9% moved from different state. Out of people who lived in different houses, 4% moved from abroad.
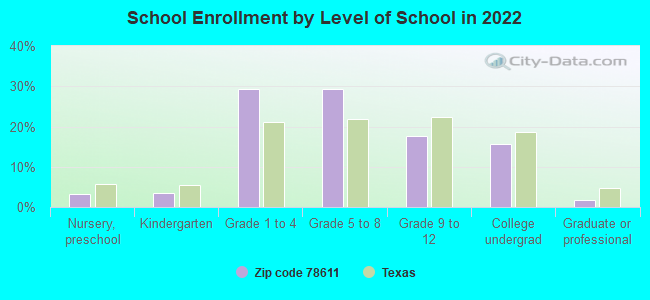
Private vs. public school enrollment:
Students in private schools in grades 1 to 8 (elementary and middle school): 268
Here:
17.3%
Texas:
8.8%
Students in private schools in grades 9 to 12 (high school): 152
Here:
32.2%
Texas:
8.0%
Students in private undergraduate colleges: 91
Here:
22.1%
Texas:
16.2%
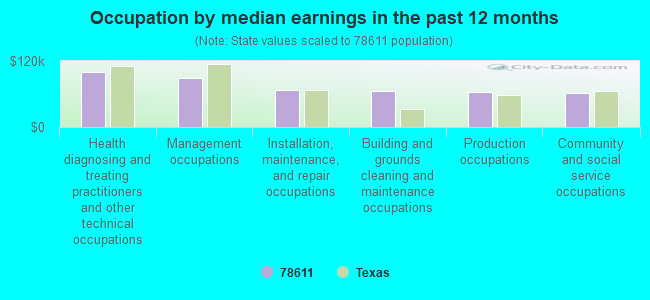
Occupation by median earnings in the past 12 months ($)
100,831Health diagnosing and treating practitioners and other technical occupations
88,504Management occupations
66,929Installation, maintenance, and repair occupations
65,396Building and grounds cleaning and maintenance occupations
62,937Production occupations
62,693Community and social service occupations
Companies with federal contracts located in this zip code:
TEXAS COMMERCIAL FENCE, INC (320 SOUTHLAND RD in BURNET, TX; small business) : $2,128,187 in 202 contractsfrom 2000 to 2006
Contracts for Construction of Structures and Facilities -- Other Non-Building Facilities, Maintenance, Repair or Alteration of Real Property -- Other Non-Building Facilities, Maintenance, Repair or Alteration of Real Property -- Family Housing Facilities, Maintenance, Repair or Alteration of Real Property -- Other Administrative Facilities and Service Buildings, and moreby Army, Navy, Air Force Signed by year:2000: $433,397; 2001: $823,903; 2002: $422,378; 2003: $326,120; 2004: $0; 2005: $114,388; 2006: $8,001.
Biggest contracts:
$277,465 with Army for Construction of Structures and Facilities -- Other Non-Building Facilities. Taking place in AL. Signed on 2001-09-14. Completion date: 2002-06-11.
$144,226 with Navy for Maintenance, Repair or Alteration of Real Property -- Other Non-Building Facilities. Taking place in CA. Signed on 2003-09-30. Completion date: 2004-03-01.
$117,788, same as above.Signed on 2001-09-20. Completion date: 2001-12-19.
$91,562 with Army for Construction of Structures and Facilities -- Other Non-Building Facilities. Signed on 2000-09-07. Completion date: 2000-12-08.
COFFMAN, LYDIA A (1675 COUNTY ROAD 100 in BURNET, TX; small business) : $511,244 in 4 contractsin 2005
$367,945 with Army for Orthopedic Services. Signed on 2005-10-19. Completion date: 2005-09-30.
$207,188, same as above.Signed on 2005-04-07. Completion date: 2005-09-30.
-$5,876, same as above.Signed on 2005-10-29. Completion date: 2005-09-30.
-$58,013, same as above.Signed on 2005-08-24. Completion date: 2005-09-30.
US FISH AND WILDLIFE SERVICE (345 COUNTY ROAD 117 in BURNET, TX) : $86,250 in 6 contractsfrom 2002 to 2006
Contracts for Live Animals, Raised for Food by Army Signed by year:2000: $0; 2001: $0; 2002: $9,450; 2003: $9,450; 2004: $9,450; 2005: $9,450; 2006: $48,450.
Biggest contracts:
$48,450 with Army for Live Animals, Raised for Food. Signed on 2006-03-24. Completion date: 2007-09-28.
$9,450, same as above.Signed on 2005-09-13. Completion date: 2003-08-15.
$9,450, same as above.Signed on 2004-08-18. Completion date: 2003-08-15.
$9,450, same as above.Signed on 2003-08-05. Completion date: 2003-08-15.
Top industries in this zip code by the number of employees in 2005:
Real Estate and Rental and Leasing: Offices of Real Estate Agents and Brokers (50-99: 1, 1-4: 5)
Administrative and Support and Waste Management and Remediation Services: Landscaping Services (50-99: 1, 5-9: 1)
Construction: Site Preparation Contractors (50-99: 1, 1-4: 1)
Construction: Highway, Street, and Bridge Construction (50-99: 1, 1-4: 1)
People in group quarters in 2010:
417 people in state prisons
407 people in local jails and other municipal confinement facilities
81 people in nursing facilities/skilled-nursing facilities
8 people in group homes for juveniles (non-correctional)
6 people in group homes intended for adults
5 people in workers' group living quarters and job corps centers
People in group quarters in 2000:
405 people in state prisons
117 people in local jails and other confinement facilities (including police lockups)
100 people in nursing homes
26 people in other noninstitutional group quarters
19 people in homes for the mentally retarded
12 people in other group homes
11 people in mental (psychiatric) hospitals or wards
Fatal accident statistics in 2014:
Fatal accident count: 4
Vehicles involved in fatal accidents: 7
Fatal accidents caused by drunken drivers: 1
Fatalities: 5
Persons involved in fatal accidents: 12
Pedestrians involved in fatal accidents: 0
Fatal accident statistics in 2012:
Fatal accident count: 2
Vehicles involved in fatal accidents: 4
Fatal accidents caused by drunken drivers: 0
Fatalities: 3
Persons involved in fatal accidents: 6
Pedestrians involved in fatal accidents: 0
2002 - 2018 National Fire Incident Reporting System (NFIRS) incidents
Based on the data from the years 2002 - 2018 the average number of fires per year is 135. The highest number of reported fire incidents - 209 took place in 2011, and the least - 74 in 2009. The data has a rising trend.
When looking into fire subcategories, the most reports belonged to: Outside Fires (66.6%), and Structure Fires (21.0%).
Fire incident types reported to NFIRS in Zip Code 78611


 Nearest zip codes: 78609, 78672, 78607, 78639, 76824, 78654.
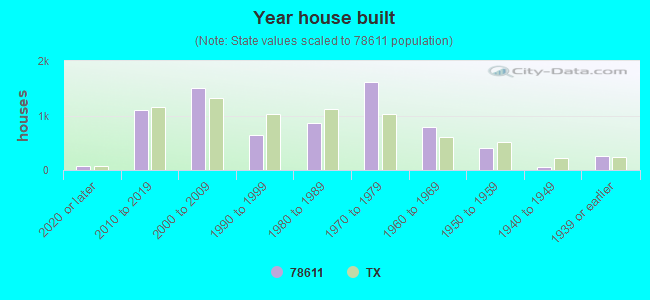


 Based on the data from the years 2002 - 2018 the average number of fires per year is 135. The highest number of reported fire incidents - 209 took place in 2011, and the least - 74 in 2009. The data has a rising trend.
 When looking into fire subcategories, the most reports belonged to: Outside Fires (66.6%), and Structure Fires (21.0%).