Estimated zip code population in 2022: 10,908 Zip code population in 2010: 8,498 Zip code population in 2000: 7,779
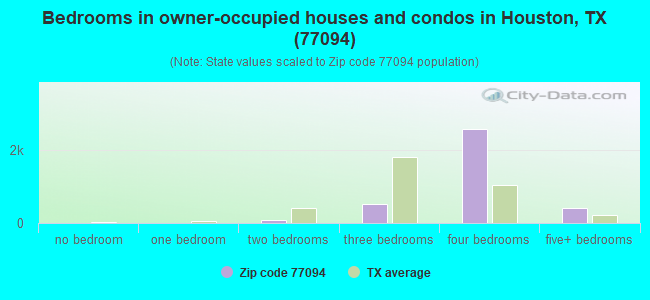
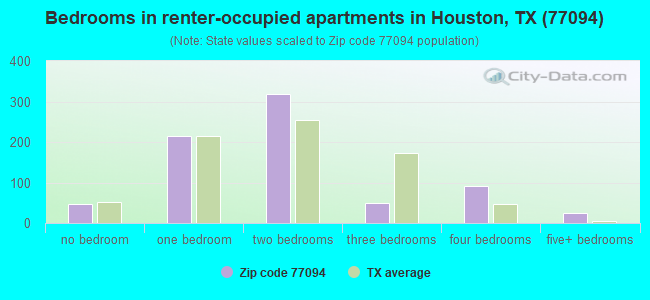
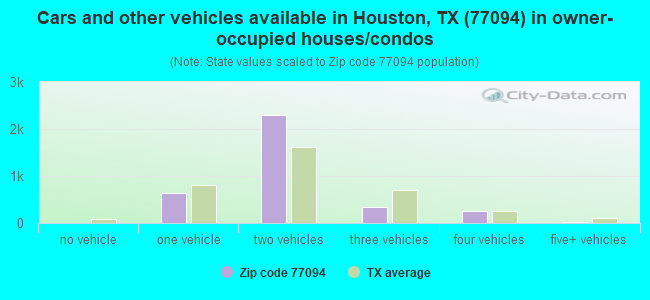
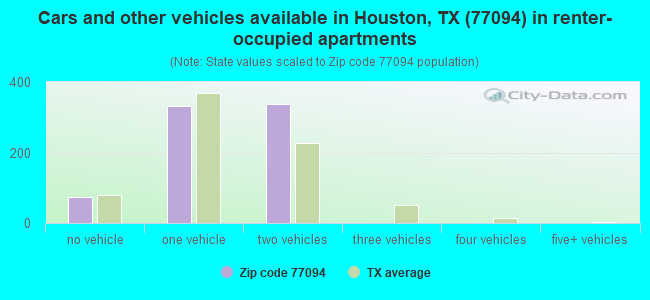
Houses and condos: 4,518 Renter-occupied apartments: 746
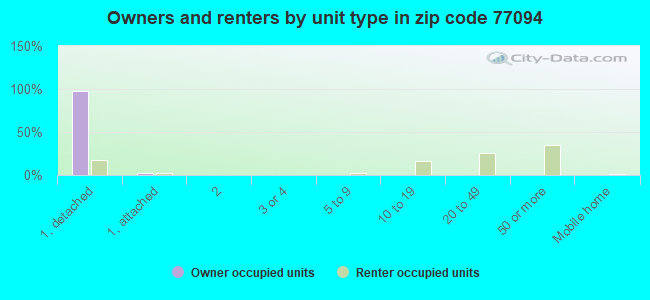
% of renters here:
17%
State:
38%
March 2022 cost of living index in zip code 77094: 96.5 (near average, U.S. average is 100)
Land area: 11.3 sq. mi. Water area: 0.3 sq. mi.
Population density: 961 people per square mile
(low).
OSM Map
General Map
Google Map
MSN Map
OSM Map
General Map
Google Map
MSN Map
OSM Map
General Map
Google Map
MSN Map
OSM Map
General Map
Google Map
MSN Map
Please wait while loading the map...
Real estate property taxes paid for housing units in 2022:
This zip code:
1.8% ($9,381)
Texas:
1.5% ($4,050)
Median real estate property taxes paid for housing units with mortgages in 2022: $9,506 (1.8%) Median real estate property taxes paid for housing units with no mortgage in 2022: $9,439 (1.8%)
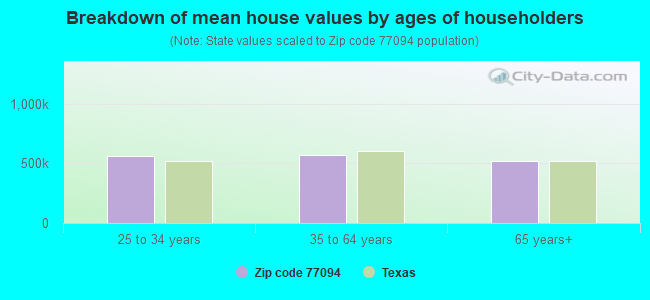
Estimated median house/condo value in 2022: $524,649
77094:
$524,649
Texas:
$275,400
According to our research of Texas and other state lists, there were 15 registered sex offenders living in 77094 zip code as of June 08, 2024. The ratio of all residents to sex offenders in zip code 77094 is 607 to 1. The ratio of registered sex offenders to all residents in this zip code is lower than the state average.
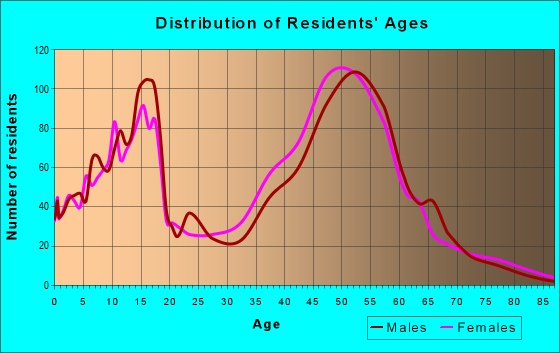
Median resident age:
This zip code:
46.1 years
Texas median age:
35.6 years
Average household size:
This zip code:
2.5 people
Texas:
2.6 people
Averages for the 2020 tax year for zip code 77094, filed in 2021:
Average Adjusted Gross Income (AGI) in 2020: $166,393 (Individual Income Tax Returns)
Here:
$166,393
State:
$77,054
Salary/wage: $134,852 (reported on 81.4% of returns)
Here:
$134,852
State:
$62,766
(% of AGI for various income ranges: 1136.2% for AGIs below $25k, 3501.8% for AGIs $25k-50k, 6545.7% for AGIs $50k-75k, 9383.3% for AGIs $75k-100k, 18421.3% for AGIs $100k-200k, 82916.9% for AGIs over 200k)
Taxable interest for individuals: $3,358 (reported on 48.4% of returns)
This zip code:
$3,358
Texas:
$2,665
(% of AGI for various income ranges: 40.6% for AGIs below $25k, 60.7% for AGIs $25k-50k, 91.7% for AGIs $50k-75k, 138.3% for AGIs $75k-100k, 255.1% for AGIs $100k-200k, 1206.0% for AGIs over 200k)
Ordinary dividends: $12,389 (reported on 44.3% of returns)
Here:
$12,389
State:
$10,044
(% of AGI for various income ranges: 44.0% for AGIs below $25k, 98.2% for AGIs $25k-50k, 277.7% for AGIs $50k-75k, 418.8% for AGIs $75k-100k, 849.0% for AGIs $100k-200k, 4432.0% for AGIs over 200k)
Net capital gain/loss in AGI: +$37,377 (reported on 41.8% of returns)
Here:
+$37,377
State:
+$39,590
(% of AGI for various income ranges: 33.9% for AGIs below $25k, 127.9% for AGIs $25k-50k, 161.1% for AGIs $50k-75k, 477.9% for AGIs $75k-100k, 1107.5% for AGIs $100k-200k, 15590.2% for AGIs over 200k)
Profit/loss from business: +$20,804 (reported on 22.7% of returns)
Here:
+$20,804
State:
+$10,888
(% of AGI for various income ranges: 229.2% for AGIs below $25k, 263.0% for AGIs $25k-50k, 278.0% for AGIs $50k-75k, 622.1% for AGIs $75k-100k, 972.0% for AGIs $100k-200k, 2772.0% for AGIs over 200k)
Taxable individual retirement arrangement distribution: $65,008 (reported on 11.8% of returns)
77094:
$65,008
Texas:
$24,740
(% of AGI for various income ranges: 49.6% for AGIs below $25k, 148.2% for AGIs $25k-50k, 390.9% for AGIs $50k-75k, 795.0% for AGIs $75k-100k, 1439.7% for AGIs $100k-200k, 5715.6% for AGIs over 200k)
Self-employed (Keogh) retirement plans: $20,650 (reported on 1.6% of returns)
77094:
$20,650
Texas:
$29,298
(% of AGI for various income ranges: 110.7% for AGIs $100k-200k, 217.1% for AGIs over 200k)
Total itemized deductions: $51,666 (reported on 14.9% of returns)
Here:
$51,666
State:
$40,428
(% of AGI for various income ranges: 70.9% for AGIs below $25k, 161.2% for AGIs $25k-50k, 421.7% for AGIs $50k-75k, 547.1% for AGIs $75k-100k, 1076.7% for AGIs $100k-200k, 6320.9% for AGIs over 200k)
Charity contributions: $28,045 (reported on 12.7% of returns)
Here:
$28,045
State:
$18,201
(% of AGI for various income ranges: 36.8% for AGIs $25k-50k, 78.9% for AGIs $50k-75k, 107.5% for AGIs $75k-100k, 274.1% for AGIs $100k-200k, 3514.0% for AGIs over 200k)
Taxes paid: $9,055 (reported on 14.5% of returns)
77094:
$9,055
State:
$7,821
(% of AGI for various income ranges: 49.6% for AGIs $25k-50k, 96.9% for AGIs $50k-75k, 146.2% for AGIs $75k-100k, 250.3% for AGIs $100k-200k, 933.6% for AGIs over 200k)
Earned income credit: $2,094 (reported on 9.2% of returns)
Here:
$2,094
State:
$2,584
(% of AGI for various income ranges: 83.9% for AGIs below $25k, 59.3% for AGIs $25k-50k)
Percentage of individuals using paid preparers for their 2020 taxes: 90.0%
Here:
90%
State:
92%
(% for various income ranges: 88.5% for AGIs below $25k, 93.2% for AGIs $25k-50k, 92.0% for AGIs $50k-75k, 91.9% for AGIs $75k-100k, 87.2% for AGIs $100k-200k, 90.6% for AGIs over 200k)
Averages for the 2012 tax year for zip code 77094, filed in 2013:
Average Adjusted Gross Income (AGI) in 2012: $183,733 (Individual Income Tax Returns)
Here:
$183,733
State:
$65,384
Salary/wage: $151,028 (reported on 87.4% of returns)
Here:
$151,028
State:
$52,524
(% of AGI for various income ranges: 79.8% for AGIs below $25k, 78.3% for AGIs $25k-50k, 74.2% for AGIs $50k-75k, 73.7% for AGIs $75k-100k, 82.3% for AGIs $100k-200k, 68.6% for AGIs over 200k)
Taxable interest for individuals: $2,949 (reported on 56.2% of returns)
This zip code:
$2,949
Texas:
$2,372
(% of AGI for various income ranges: 2.1% for AGIs below $25k, 1.5% for AGIs $25k-50k, 1.3% for AGIs $50k-75k, 0.5% for AGIs $75k-100k, 0.6% for AGIs $100k-200k, 0.9% for AGIs over 200k)
Ordinary dividends: $11,897 (reported on 47.3% of returns)
Here:
$11,897
State:
$9,721
(% of AGI for various income ranges: 4.5% for AGIs below $25k, 2.4% for AGIs $25k-50k, 2.3% for AGIs $50k-75k, 2.6% for AGIs $75k-100k, 1.6% for AGIs $100k-200k, 3.5% for AGIs over 200k)
Net capital gain/loss in AGI: +$38,013 (reported on 40.7% of returns)
Here:
+$38,013
State:
+$35,319
(% of AGI for various income ranges: 0.4% for AGIs below $25k, 0.7% for AGIs $50k-75k, 1.5% for AGIs $75k-100k, 1.0% for AGIs $100k-200k, 11.4% for AGIs over 200k)
Profit/loss from business: +$33,119 (reported on 20.5% of returns)
Here:
+$33,119
State:
+$13,732
(% of AGI for various income ranges: 8.9% for AGIs below $25k, 7.3% for AGIs $25k-50k, 8.1% for AGIs $50k-75k, 6.5% for AGIs $75k-100k, 4.4% for AGIs $100k-200k, 3.0% for AGIs over 200k)
Taxable individual retirement arrangement distribution: $38,279 (reported on 10.5% of returns)
77094:
$38,279
Texas:
$19,511
(% of AGI for various income ranges: 3.7% for AGIs below $25k, 4.0% for AGIs $25k-50k, 4.1% for AGIs $50k-75k, 5.6% for AGIs $75k-100k, 3.0% for AGIs $100k-200k, 1.6% for AGIs over 200k)
Self-employment retirement plans: $38,033 (reported on 2.0% of returns)
77094:
$38,033
Texas:
$23,938
Total itemized deductions: $29,654 (10% of AGI, reported on 52.1% of returns)
Here:
$29,654
State:
$24,724
Here:
10.5% of AGI
State:
15.9% of AGI
(% of AGI for various income ranges: 14.6% for AGIs below $25k, 15.2% for AGIs $25k-50k, 14.7% for AGIs $50k-75k, 13.9% for AGIs $75k-100k, 11.9% for AGIs $100k-200k, 6.7% for AGIs over 200k)
Charity contributions: $8,539 (reported on 44.9% of returns)
Here:
$8,539
State:
$6,808
(% of AGI for various income ranges: 1.0% for AGIs below $25k, 1.8% for AGIs $25k-50k, 2.0% for AGIs $50k-75k, 2.0% for AGIs $75k-100k, 2.1% for AGIs $100k-200k, 2.1% for AGIs over 200k)
Taxes paid: $10,820 (reported on 51.9% of returns)
77094:
$10,820
State:
$6,921
(% of AGI for various income ranges: 4.2% for AGIs below $25k, 4.1% for AGIs $25k-50k, 5.8% for AGIs $50k-75k, 5.1% for AGIs $75k-100k, 4.8% for AGIs $100k-200k, 2.3% for AGIs over 200k)
Earned income credit: $1,685 (reported on 5.9% of returns)
Here:
$1,685
State:
$2,570
(% of AGI for various income ranges: 3.5% for AGIs below $25k, 0.6% for AGIs $25k-50k)
Percentage of individuals using paid preparers for their 2012 taxes: 46.6%
Here:
47%
State:
51%
(% for various income ranges: 36.7% for AGIs below $25k, 44.7% for AGIs $25k-50k, 46.2% for AGIs $50k-75k, 48.6% for AGIs $75k-100k, 45.3% for AGIs $100k-200k, 56.9% for AGIs over 200k)
Averages for the 2004 tax year for zip code 77094, filed in 2005:
Average Adjusted Gross Income (AGI) in 2004: $121,663 (Individual Income Tax Returns)
Here:
$121,663
State:
$47,881
Salary/wage: $112,137 (reported on 84.4% of returns)
Here:
$112,137
State:
$41,947
(% of AGI for various income ranges: 371.5% for AGIs below $10k, 74.8% for AGIs $10k-25k, 73.6% for AGIs $25k-50k, 70.9% for AGIs $50k-75k, 81.2% for AGIs $75k-100k, 77.3% for AGIs over 100k)
Taxable interest for individuals: $2,266 (reported on 69.6% of returns)
This zip code:
$2,266
Texas:
$2,255
(% of AGI for various income ranges: 25.1% for AGIs below $10k, 5.7% for AGIs $10k-25k, 3.1% for AGIs $25k-50k, 2.8% for AGIs $50k-75k, 1.5% for AGIs $75k-100k, 1.0% for AGIs over 100k)
Taxable dividends: $3,909 (reported on 52.4% of returns)
Here:
$3,909
State:
$4,261
(% of AGI for various income ranges: 29.3% for AGIs below $10k, 4.3% for AGIs $10k-25k, 3.0% for AGIs $25k-50k, 3.3% for AGIs $50k-75k, 1.4% for AGIs $75k-100k, 1.5% for AGIs over 100k)
Net capital gain/loss: +$16,526 (reported on 47.1% of returns)
Here:
+$16,526
State:
+$16,110
(% of AGI for various income ranges: -28.2% for AGIs below $10k, 2.2% for AGIs $10k-25k, 1.2% for AGIs $25k-50k, 1.4% for AGIs $50k-75k, 0.7% for AGIs $75k-100k, 7.4% for AGIs over 100k)
Profit/loss from business: +$29,075 (reported on 20.8% of returns)
Here:
+$29,075
State:
+$11,013
(% of AGI for various income ranges: -10.8% for AGIs below $10k, 11.1% for AGIs $10k-25k, 7.2% for AGIs $25k-50k, 9.8% for AGIs $50k-75k, 7.6% for AGIs $75k-100k, 4.4% for AGIs over 100k)
IRA payment deduction: $3,601 (reported on 4.5% of returns)
77094:
$3,601
Texas:
$3,120
(% of AGI for various income ranges: 3.8% for AGIs below $10k, 0.3% for AGIs $25k-50k, 0.5% for AGIs $50k-75k, 0.3% for AGIs $75k-100k, 0.1% for AGIs over 100k)
Self-employed pension: $18,978 (reported on 2.4% of returns)
Here:
$18,978
Texas:
$16,401
Total itemized deductions: $23,609 (14% of AGI, reported on 58.9% of returns)
Here:
$23,609
State:
$19,631
Here:
13.7% of AGI
State:
18.9% of AGI
(% of AGI for various income ranges: 36.1% for AGIs below $10k, 25.0% for AGIs $10k-25k, 25.0% for AGIs $25k-50k, 22.9% for AGIs $50k-75k, 18.6% for AGIs $75k-100k, 9.6% for AGIs over 100k)
Charity contributions deductions: $5,063 (3% of AGI, reported on 53.1% of returns)
Here:
$5,063
State:
$4,753
Here:
2.8% of AGI
State:
4.2% of AGI
(% of AGI for various income ranges: 1.3% for AGIs below $10k, 1.4% for AGIs $10k-25k, 3.1% for AGIs $25k-50k, 2.9% for AGIs $50k-75k, 2.4% for AGIs $75k-100k, 2.1% for AGIs over 100k)
Total tax: $28,516 (reported on 81.1% of returns)
77094:
$28,516
State:
$9,058
(% of AGI for various income ranges: 10.8% for AGIs below $10k, 5.4% for AGIs $10k-25k, 7.3% for AGIs $25k-50k, 9.3% for AGIs $50k-75k, 10.5% for AGIs $75k-100k, 20.7% for AGIs over 100k)
Earned income credit: $1,596 (reported on 3.9% of returns)
Here:
$1,596
State:
$2,024
Percentage of individuals using paid preparers for their 2004 taxes: 45.1%
Here:
45%
State:
57%
(% for various income ranges: 37.3% for AGIs below $10k, 48.5% for AGIs $10k-25k, 53.8% for AGIs $25k-50k, 50.0% for AGIs $50k-75k, 44.5% for AGIs $75k-100k, 45.8% for AGIs over 100k)
Household received Food Stamps/SNAP in the past 12 months: 80 Household did not receive Food Stamps/SNAP in the past 12 months: 4,193
Women who had a birth in the past 12 months: 67 (68 now married, 0 unmarried) Women who did not have a birth in the past 12 months: 1,666 (1,028 now married, 628 unmarried)
Housing units in zip code 77094 with a mortgage: 2,027 (53 second mortgage, 32 both second mortgage and home equity loan) Median monthly owner costs for units with a mortgage: $3,179 Median monthly owner costs for units without a mortgage: $1,333
Residents with income below the poverty level in 2022:
This zip code:
7.3%
Whole state:
14.0%
Residents with income below 50% of the poverty level in 2022:
This zip code:
5.4%
Whole state:
7.4%
Median number of rooms in houses and condos:
Here:
8.4
State:
6.3
Median number of rooms in apartments:
Here:
3.9
State:
4.0
Notable locations in this zip code not listed on our city pages
Size of family households: 1,629 2-persons, 567 3-persons, 747 4-persons, 301 5-persons, 31 6-persons, 23 7-or-more-persons
Size of nonfamily households: 924 1-person, 56 2-persons
1,946 married couples with children.
435 single-parent households (114 men, 321 women).
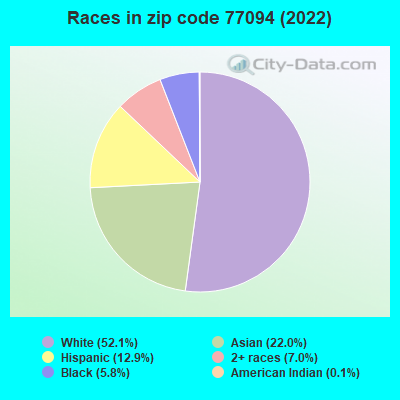
58.2% of residents of 77094 zip code speak English at home.
10.3% of residents speak Spanish at home (66% very well, 25% well, 9% not well).
15.7% of residents speak other Indo-European language at home (91% very well, 8% well, 1% not well).
16.9% of residents speak Asian or Pacific Island language at home (78% very well, 16% well, 7% not well).
0.5% of residents speak other language at home (100% very well).
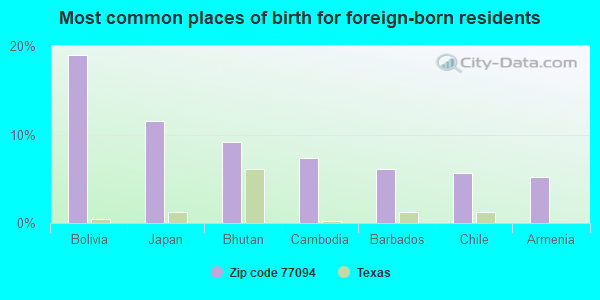
Foreign born population: 3,981 (36.5%) (70.1% of them are naturalized citizens)
Housing units lacking complete plumbing facilities: 0.4% Housing units lacking complete kitchen facilities: 0.4%
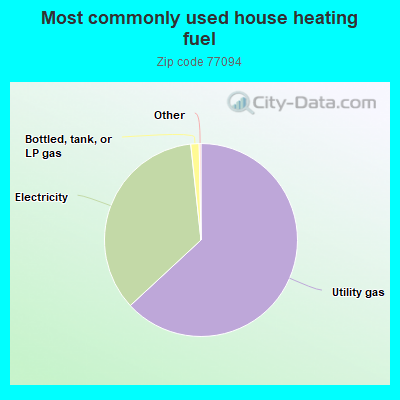
63.1%Utility gas
35.2%Electricity
1.4%Bottled, tank, or LP gas
Population in 1990: 1,168. Population change in the 1990s: +6,611 (+566.0%).
Place of birth for U.S.-born residents:
This state: 4,104
Northeast: 659
Midwest: 773
South: 946
West: 406
41% of the 77094 zip code residents lived in the same house 5 years ago. Out of people who lived in different houses, 55% lived in this county. Out of people who lived in different counties, 50% lived in Texas.
93% of the 77094 zip code residents lived in the same house 1 year ago. Out of people who lived in different houses, 15% moved from this county. Out of people who lived in different houses, 47% moved from different county within same state. Out of people who lived in different houses, 40% moved from different state. Out of people who lived in different houses, 8% moved from abroad.
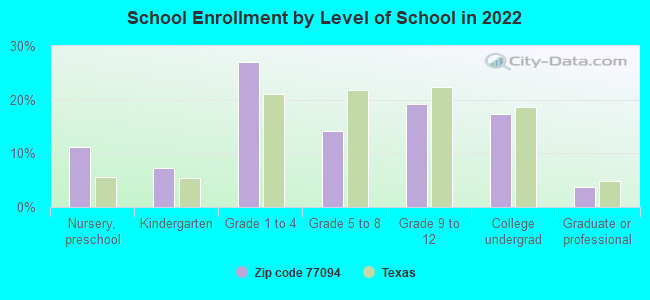
Private vs. public school enrollment:
Students in private schools in grades 1 to 8 (elementary and middle school): 146
Here:
14.3%
Texas:
8.8%
Students in private schools in grades 9 to 12 (high school): 45
Here:
9.6%
Texas:
8.0%
Students in private undergraduate colleges:
Here:
0.0%
Texas:
16.2%
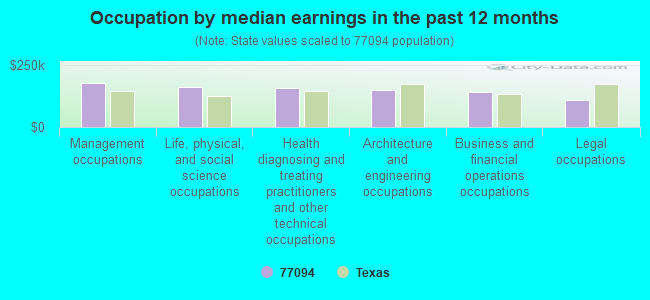
Occupation by median earnings in the past 12 months ($)
178,219Management occupations
162,527Life, physical, and social science occupations
159,364Health diagnosing and treating practitioners and other technical occupations
151,258Architecture and engineering occupations
140,593Business and financial operations occupations
110,593Legal occupations
Companies with federal contracts located in this zip code:
MICROMATION, INC (16300 KATY FREEWAY SUITE 1 in HOUSTON, TX; small business) : $407,140 in 20 contractsfrom 2002 to 2006
Contracts for ADP Components, Miscellaneous Alarm, Signal and Security Detection Systems, Data Collection Services, ADP Input/Output and Storage Devices, and moreby Army, Navy, Air Force, NASA, and others Signed by year:2000: $0; 2001: $0; 2002: $3,254; 2003: $57,684; 2004: $187,816; 2005: $55,513; 2006: $102,873.
Biggest contracts:
$99,997 with Army for ADP Components. Signed on 2006-04-11. Completion date: 2006-05-05.
$50,667 with Navy for Miscellaneous Alarm, Signal and Security Detection Systems. Signed on 2004-03-16. Completion date: 2004-06-30.
$48,239 with Army for ADP Components. Taking place in AZ. Signed on 2004-09-27. Completion date: 2004-10-23.
$30,950 with Air Force for Data Collection Services. Signed on 2003-09-25. Completion date: 2003-12-23.
APPLIED FIELD DATA SYSTEMS (16300 KATY FREEWAY in HOUSTON, TX; small business) 50 employees, $0 revenue. Small Disadvantaged Business, Woman Owned Business, Subcontinent Asian (Asian-Indian) American Owned Business: $18,704 in 3 contractsin 2004
$8,856 with Army for Radar Equipment, Except Airborne. Signed on 2004-09-18. Completion date: 2004-09-30.
$5,164 with Bureau of Land Management for Microcircuits, Electronic. Taking place in OR. Signed on 2004-09-15. Completion date: 2004-10-15.
$4,684 with Geological Survey for Miscellaneous Communication Equipment. Signed on 2004-09-08. Completion date: 2004-10-01.
Top industries in this zip code by the number of employees in 2005:
Mining: Drilling Oil and Gas Wells (over 1000 employees: 1 establishment, 250-499 employees: 1 establishment, 1-4 employees: 1 establishment)
Administrative and Support and Waste Management and Remediation Services: Professional Employer Organizations (500-999: 1, 10-19: 2)
Finance and Insurance: Financial Transactions Processing, Reserve, and Clearinghouse Activities (500-999: 1)
Professional, Scientific, and Technical Services: Human Resources and Executive Search Consulting Services (250-499: 1, 10-19: 1, 1-4: 1)
Accommodation and Food Services: Full-Service Restaurants (100-249: 1, 50-99: 3)
Management of Companies and Enterprises: Corporate, Subsidiary, and Regional Managing Offices (100-249: 1, 50-99: 1, 20-49: 3, 5-9: 1)
Construction: Other Heavy and Civil Engineering Construction (100-249: 1)
Fatal accident statistics in 2014:
Fatal accident count: 1
Vehicles involved in fatal accidents: 2
Fatal accidents caused by drunken drivers: 1
Fatalities: 1
Persons involved in fatal accidents: 3
Pedestrians involved in fatal accidents: 0
Fatal accident statistics in 2012:
Fatal accident count: 3
Vehicles involved in fatal accidents: 5
Fatal accidents caused by drunken drivers: 0
Fatalities: 3
Persons involved in fatal accidents: 5
Pedestrians involved in fatal accidents: 1
Home Mortgage Disclosure Act Aggregated Statistics For Year 2009 (Based on 4 partial tracts)
A) FHA, FSA/RHS & VA Home Purchase Loans
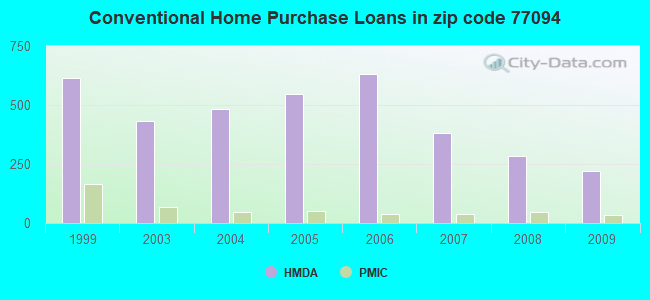
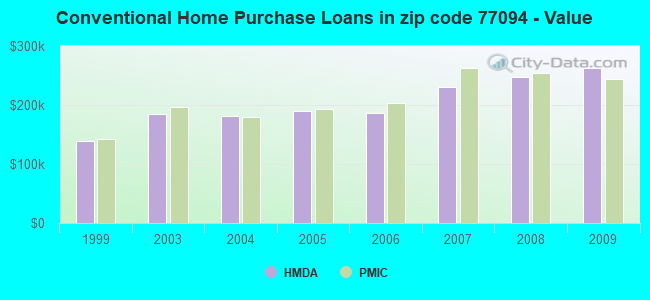
B) Conventional Home Purchase Loans
C) Refinancings
D) Home Improvement Loans
F) Non-occupant Loans on < 5 Family Dwellings (A B C & D)
Number
Average Value
Number
Average Value
Number
Average Value
Number
Average Value
Number
Average Value
LOANS ORIGINATED
26
$228,855
219
$262,892
363
$233,038
14
$111,795
15
$209,321
APPLICATIONS APPROVED, NOT ACCEPTED
2
$279,675
22
$313,292
26
$333,363
4
$133,622
2
$502,170
APPLICATIONS DENIED
9
$191,146
21
$335,610
100
$214,812
7
$49,720
1
$174,020
APPLICATIONS WITHDRAWN
4
$190,180
42
$382,955
83
$226,196
7
$63,749
2
$245,490
FILES CLOSED FOR INCOMPLETENESS
0
$0
6
$369,585
16
$171,466
0
$0
0
$0
Aggregated Statistics For Year 2008 (Based on 4 partial tracts)
A) FHA, FSA/RHS & VA Home Purchase Loans
B) Conventional Home Purchase Loans
C) Refinancings
D) Home Improvement Loans
F) Non-occupant Loans on < 5 Family Dwellings (A B C & D)
G) Loans On Manufactured Home Dwelling (A B C & D)
Number
Average Value
Number
Average Value
Number
Average Value
Number
Average Value
Number
Average Value
Number
Average Value
LOANS ORIGINATED
9
$182,859
285
$246,989
147
$231,604
22
$88,818
26
$257,301
1
$39,780
APPLICATIONS APPROVED, NOT ACCEPTED
1
$307,020
30
$246,060
19
$199,599
7
$98,374
2
$357,360
0
$0
APPLICATIONS DENIED
2
$295,210
32
$281,540
52
$229,286
24
$87,253
4
$133,932
1
$50,960
APPLICATIONS WITHDRAWN
2
$290,240
53
$283,756
30
$189,019
2
$225,605
4
$212,552
0
$0
FILES CLOSED FOR INCOMPLETENESS
0
$0
1
$324,420
5
$173,772
0
$0
0
$0
0
$0
Aggregated Statistics For Year 2007 (Based on 4 partial tracts)
B) Conventional Home Purchase Loans
C) Refinancings
D) Home Improvement Loans
F) Non-occupant Loans on < 5 Family Dwellings (A B C & D)
G) Loans On Manufactured Home Dwelling (A B C & D)
Number
Average Value
Number
Average Value
Number
Average Value
Number
Average Value
Number
Average Value
LOANS ORIGINATED
380
$231,173
104
$215,864
32
$64,947
22
$316,530
0
$0
APPLICATIONS APPROVED, NOT ACCEPTED
71
$250,309
19
$263,385
9
$42,677
2
$181,480
0
$0
APPLICATIONS DENIED
76
$205,489
86
$313,124
25
$68,891
5
$247,606
1
$34,800
APPLICATIONS WITHDRAWN
51
$323,371
41
$211,645
1
$41,020
1
$33,560
0
$0
FILES CLOSED FOR INCOMPLETENESS
10
$393,037
16
$303,758
1
$37,290
0
$0
0
$0
Aggregated Statistics For Year 2006 (Based on 4 partial tracts)
A) FHA, FSA/RHS & VA Home Purchase Loans
B) Conventional Home Purchase Loans
C) Refinancings
D) Home Improvement Loans
F) Non-occupant Loans on < 5 Family Dwellings (A B C & D)
G) Loans On Manufactured Home Dwelling (A B C & D)
Number
Average Value
Number
Average Value
Number
Average Value
Number
Average Value
Number
Average Value
Number
Average Value
LOANS ORIGINATED
5
$210,026
633
$186,784
88
$224,192
32
$57,722
43
$146,983
0
$0
APPLICATIONS APPROVED, NOT ACCEPTED
1
$124,300
102
$221,303
27
$325,067
11
$64,975
6
$307,022
1
$38,530
APPLICATIONS DENIED
0
$0
164
$265,399
80
$233,929
36
$48,235
12
$124,714
0
$0
APPLICATIONS WITHDRAWN
1
$193,700
117
$219,343
54
$300,134
2
$164,075
13
$146,698
0
$0
FILES CLOSED FOR INCOMPLETENESS
0
$0
21
$246,090
11
$305,439
1
$23,620
1
$463,640
0
$0
Aggregated Statistics For Year 2005 (Based on 4 partial tracts)
A) FHA, FSA/RHS & VA Home Purchase Loans
B) Conventional Home Purchase Loans
C) Refinancings
D) Home Improvement Loans
E) Loans on Dwellings For 5+ Families
F) Non-occupant Loans on < 5 Family Dwellings (A B C & D)
Number
Average Value
Number
Average Value
Number
Average Value
Number
Average Value
Number
Average Value
Number
Average Value
LOANS ORIGINATED
6
$165,112
547
$189,993
142
$197,576
34
$75,128
1
$1,292,720
29
$175,349
APPLICATIONS APPROVED, NOT ACCEPTED
0
$0
89
$234,857
22
$297,020
14
$57,799
0
$0
5
$99,440
APPLICATIONS DENIED
0
$0
132
$297,510
85
$239,431
27
$53,771
0
$0
7
$315,721
APPLICATIONS WITHDRAWN
2
$168,425
80
$253,461
58
$277,511
21
$325,725
0
$0
7
$264,226
FILES CLOSED FOR INCOMPLETENESS
0
$0
22
$196,902
65
$239,134
1
$186,450
0
$0
2
$151,025
Aggregated Statistics For Year 2004 (Based on 4 partial tracts)
A) FHA, FSA/RHS & VA Home Purchase Loans
B) Conventional Home Purchase Loans
C) Refinancings
D) Home Improvement Loans
F) Non-occupant Loans on < 5 Family Dwellings (A B C & D)
G) Loans On Manufactured Home Dwelling (A B C & D)
Number
Average Value
Number
Average Value
Number
Average Value
Number
Average Value
Number
Average Value
Number
Average Value
LOANS ORIGINATED
12
$152,060
481
$180,727
282
$201,105
31
$86,464
17
$166,732
0
$0
APPLICATIONS APPROVED, NOT ACCEPTED
1
$111,870
63
$225,003
45
$204,377
11
$71,529
1
$28,590
1
$28,590
APPLICATIONS DENIED
1
$110,630
83
$275,527
88
$255,378
21
$98,730
4
$147,918
0
$0
APPLICATIONS WITHDRAWN
1
$200,120
55
$268,851
73
$269,416
2
$16,780
5
$114,506
0
$0
FILES CLOSED FOR INCOMPLETENESS
0
$0
11
$290,862
53
$264,735
1
$382,840
0
$0
0
$0
Aggregated Statistics For Year 2003 (Based on 4 partial tracts)
A) FHA, FSA/RHS & VA Home Purchase Loans
B) Conventional Home Purchase Loans
C) Refinancings
D) Home Improvement Loans
F) Non-occupant Loans on < 5 Family Dwellings (A B C & D)
Number
Average Value
Number
Average Value
Number
Average Value
Number
Average Value
Number
Average Value
LOANS ORIGINATED
9
$132,034
434
$185,013
975
$175,993
31
$54,772
24
$215,712
APPLICATIONS APPROVED, NOT ACCEPTED
0
$0
42
$169,181
114
$205,695
9
$27,346
1
$535,730
APPLICATIONS DENIED
4
$137,352
66
$331,930
218
$239,871
15
$35,467
9
$177,334
APPLICATIONS WITHDRAWN
1
$176,510
55
$428,168
121
$189,213
4
$353,322
5
$182,720
FILES CLOSED FOR INCOMPLETENESS
0
$0
5
$981,458
26
$244,967
4
$97,885
0
$0
Aggregated Statistics For Year 1999 (Based on 1 partial tract)
A) FHA, FSA/RHS & VA Home Purchase Loans
B) Conventional Home Purchase Loans
C) Refinancings
D) Home Improvement Loans
E) Loans on Dwellings For 5+ Families
F) Non-occupant Loans on < 5 Family Dwellings (A B C & D)
Detailed PMIC statistics for the following Tracts:4544.00
, 4545.00
2002 - 2018 National Fire Incident Reporting System (NFIRS) incidents
Based on the data from the years 2002 - 2018 the average number of fires per year is 6. The highest number of fires - 25 took place in 2017, and the least - 1 in 2015. The data has a growing trend.
When looking into fire subcategories, the most incidents belonged to: Mobile Property/Vehicle Fires (35.3%), and Outside Fires (34.3%).
Fire incident types reported to NFIRS in Zip Code 77094
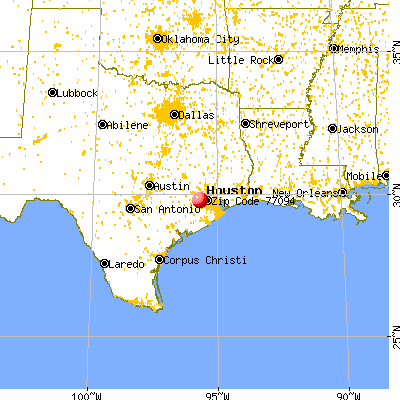


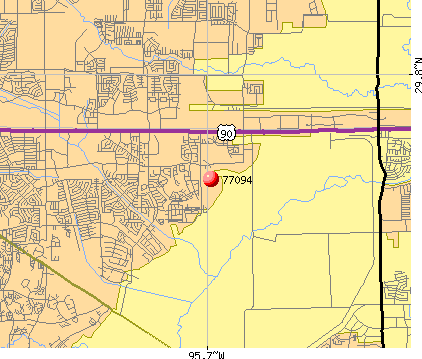 Nearest zip codes: 77082, 77084, 77450, 77077, 77079, 77083.
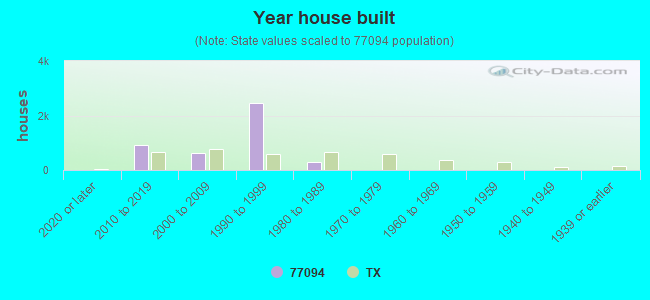


 : $407,140 in 20 contracts from 2002 to 2006
 Based on the data from the years 2002 - 2018 the average number of fires per year is 6. The highest number of fires - 25 took place in 2017, and the least - 1 in 2015. The data has a growing trend.
 When looking into fire subcategories, the most incidents belonged to: Mobile Property/Vehicle Fires (35.3%), and Outside Fires (34.3%).