Estimated zip code population in 2022: 6,108 Zip code population in 2010: 4,611 Zip code population in 2000: 4,357
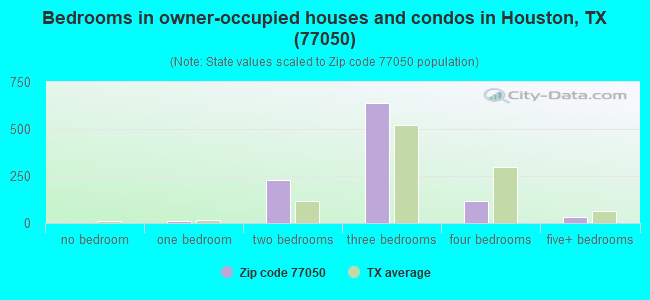
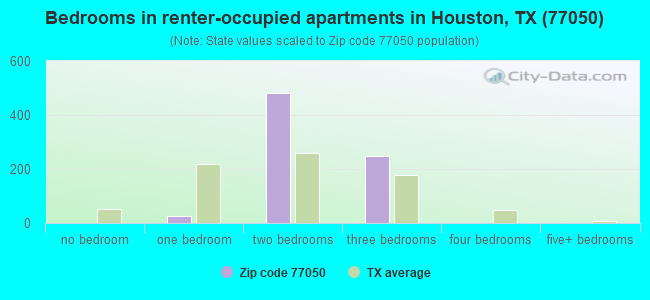
Houses and condos: 1,861 Renter-occupied apartments: 775
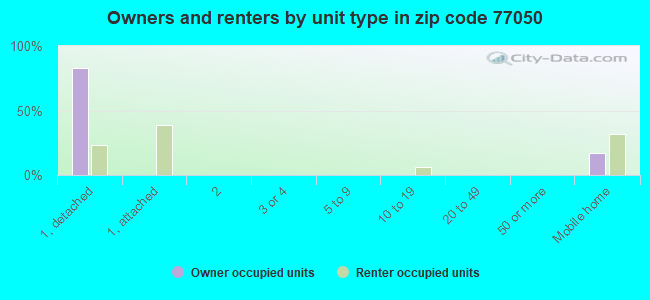
% of renters here:
43%
State:
38%
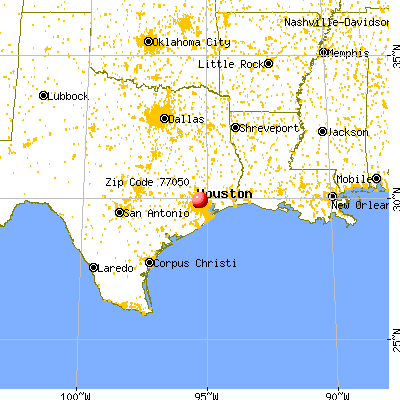
March 2022 cost of living index in zip code 77050: 96.2 (near average, U.S. average is 100)
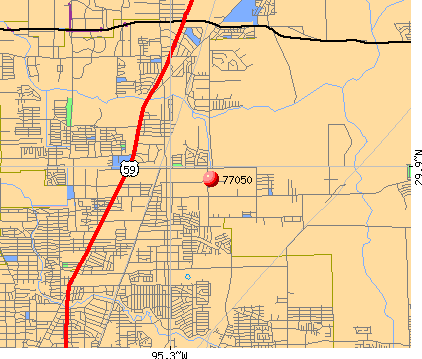
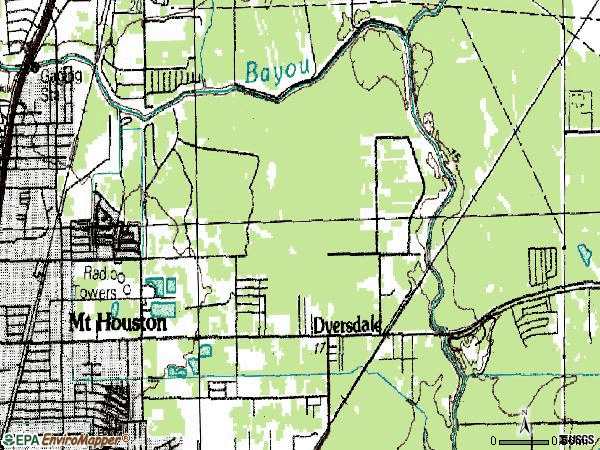
Land area: 6.7 sq. mi. Water area: 0.3 sq. mi.
Population density: 915 people per square mile
(low).
OSM Map
General Map
Google Map
MSN Map
OSM Map
General Map
Google Map
MSN Map
OSM Map
General Map
Google Map
MSN Map
OSM Map
General Map
Google Map
MSN Map
Please wait while loading the map...
Real estate property taxes paid for housing units in 2022:
This zip code:
1.2% ($1,412)
Texas:
1.5% ($4,050)
Median real estate property taxes paid for housing units with mortgages in 2022: $1,387 (0.8%) Median real estate property taxes paid for housing units with no mortgage in 2022: $1,459 (1.4%)
Business Search- 14 Million verified businesses
Males: 3,069
(50.2%)
Females: 3,039
(49.8%)
For population 25 years and over in 77050:
High school or higher: 51.5%
Bachelor's degree or higher: 4.1%
Graduate or professional degree: 1.2%
Unemployed: 5.7%
Mean travel time to work (commute): 50.0 minutes
For population 15 years and over in 77050:
Never married: 37.8%
Now married: 52.8%
Separated: 1.2%
Widowed: 2.2%
Divorced: 6.0%
Zip code 77050 compared to state average:
Median household income significantly below state average.
Median house value significantly below state average.
Black race population percentage above state average.
Hispanic race population percentage above state average.
Median age below state average.
Foreign-born population percentage significantly above state average.
Length of stay since moving in significantly above state average.
Number of college students significantly below state average.
Percentage of population with a bachelor's degree or higher significantly below state average.
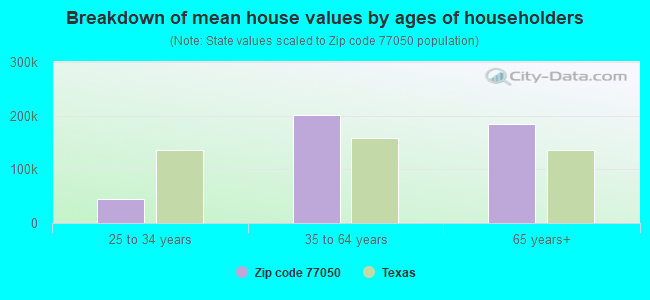
Estimated median house/condo value in 2022: $116,640
77050:
$116,640
Texas:
$275,400
According to our research of Texas and other state lists, there were 12 registered sex offenders living in 77050 zip code as of June 08, 2024. The ratio of all residents to sex offenders in zip code 77050 is 404 to 1. The ratio of registered sex offenders to all residents in this zip code is near the state average.
Median resident age:
This zip code:
30.9 years
Texas median age:
35.6 years
Average household size:
This zip code:
3.4 people
Texas:
2.6 people
Averages for the 2020 tax year for zip code 77050, filed in 2021:
Average Adjusted Gross Income (AGI) in 2020: $34,168 (Individual Income Tax Returns)
Here:
$34,168
State:
$77,054
Salary/wage: $34,068 (reported on 72.5% of returns)
Here:
$34,068
State:
$62,766
(% of AGI for various income ranges: 1080.7% for AGIs below $25k, 3578.7% for AGIs $25k-50k, 6164.2% for AGIs $50k-75k, 9107.1% for AGIs $75k-100k, 14577.5% for AGIs $100k-200k)
Taxable interest for individuals: $171 (reported on 8.8% of returns)
This zip code:
$171
Texas:
$2,665
(% of AGI for various income ranges: 1.7% for AGIs below $25k, 0.4% for AGIs $25k-50k, 4.2% for AGIs $50k-75k, 17.5% for AGIs $100k-200k)
Ordinary dividends: $600 (reported on 2.1% of returns)
Here:
$600
State:
$10,044
(% of AGI for various income ranges: 12.6% for AGIs $50k-75k)
Net capital gain/loss in AGI: +$1,200 (reported on 2.1% of returns)
Here:
+$1,200
State:
+$39,590
(% of AGI for various income ranges: 25.3% for AGIs $50k-75k)
Profit/loss from business: +$6,053 (reported on 34.2% of returns)
Here:
+$6,053
State:
+$10,888
(% of AGI for various income ranges: 390.0% for AGIs below $25k, 120.7% for AGIs $25k-50k, 242.1% for AGIs $50k-75k, 318.6% for AGIs $75k-100k)
Taxable individual retirement arrangement distribution: $14,900 (reported on 3.1% of returns)
77050:
$14,900
Texas:
$24,740
(% of AGI for various income ranges: 18.3% for AGIs below $25k, 57.3% for AGIs $25k-50k, 722.9% for AGIs $75k-100k)
Total itemized deductions: $32,750 (reported on 4.1% of returns)
Here:
$32,750
State:
$40,428
(% of AGI for various income ranges: 285.6% for AGIs $25k-50k, 1907.1% for AGIs $75k-100k)
Charity contributions: $10,250 (reported on 3.1% of returns)
Here:
$10,250
State:
$18,201
(% of AGI for various income ranges: 64.4% for AGIs $25k-50k, 464.3% for AGIs $75k-100k)
Taxes paid: $5,643 (reported on 3.6% of returns)
77050:
$5,643
State:
$7,821
(% of AGI for various income ranges: 46.7% for AGIs $25k-50k, 264.3% for AGIs $75k-100k)
Earned income credit: $3,011 (reported on 31.6% of returns)
Here:
$3,011
State:
$2,584
(% of AGI for various income ranges: 197.6% for AGIs below $25k, 96.4% for AGIs $25k-50k)
Percentage of individuals using paid preparers for their 2020 taxes: 85.0%
Here:
85%
State:
92%
(% for various income ranges: 82.7% for AGIs below $25k, 87.3% for AGIs $25k-50k, 87.5% for AGIs $50k-75k, 80.0% for AGIs $75k-100k, 100.0% for AGIs $100k-200k)
Averages for the 2012 tax year for zip code 77050, filed in 2013:
Average Adjusted Gross Income (AGI) in 2012: $31,398 (Individual Income Tax Returns)
Here:
$31,398
State:
$65,384
Salary/wage: $29,943 (reported on 78.7% of returns)
Here:
$29,943
State:
$52,524
(% of AGI for various income ranges: 70.8% for AGIs below $25k, 88.5% for AGIs $25k-50k, 76.5% for AGIs $50k-75k, 80.8% for AGIs $75k-100k, 46.8% for AGIs $100k-200k)
Taxable interest for individuals: $224 (reported on 9.0% of returns)
This zip code:
$224
Texas:
$2,372
(% of AGI for various income ranges: 0.1% for AGIs $50k-75k)
Ordinary dividends: $1,350 (reported on 3.2% of returns)
Here:
$1,350
State:
$9,721
Profit/loss from business: +$6,937 (reported on 26.1% of returns)
Here:
+$6,937
State:
+$13,732
(% of AGI for various income ranges: 19.4% for AGIs below $25k, 1.9% for AGIs $25k-50k, 4.2% for AGIs $50k-75k)
Taxable individual retirement arrangement distribution: $16,289 (reported on 4.8% of returns)
77050:
$16,289
Texas:
$19,511
(% of AGI for various income ranges: 1.2% for AGIs below $25k, 0.9% for AGIs $25k-50k, 3.8% for AGIs $50k-75k, 11.8% for AGIs $75k-100k)
Total itemized deductions: $20,600 (34% of AGI, reported on 12.8% of returns)
Here:
$20,600
State:
$24,724
Here:
33.7% of AGI
State:
15.9% of AGI
(% of AGI for various income ranges: 3.4% for AGIs below $25k, 7.4% for AGIs $25k-50k, 10.1% for AGIs $50k-75k, 11.9% for AGIs $75k-100k, 13.0% for AGIs $100k-200k)
Charity contributions: $6,516 (reported on 10.1% of returns)
Here:
$6,516
State:
$6,808
(% of AGI for various income ranges: 0.8% for AGIs below $25k, 1.2% for AGIs $25k-50k, 3.2% for AGIs $50k-75k, 3.5% for AGIs $75k-100k, 3.4% for AGIs $100k-200k)
Taxes paid: $3,274 (reported on 12.2% of returns)
77050:
$3,274
State:
$6,921
(% of AGI for various income ranges: 0.4% for AGIs below $25k, 0.9% for AGIs $25k-50k, 1.7% for AGIs $50k-75k, 1.9% for AGIs $75k-100k, 2.2% for AGIs $100k-200k)
Earned income credit: $2,806 (reported on 34.6% of returns)
Here:
$2,806
State:
$2,570
(% of AGI for various income ranges: 11.5% for AGIs below $25k, 1.7% for AGIs $25k-50k)
Percentage of individuals using paid preparers for their 2012 taxes: 65.4%
Here:
65%
State:
51%
(% for various income ranges: 66.0% for AGIs below $25k, 64.8% for AGIs $25k-50k, 66.7% for AGIs $50k-75k, 57.1% for AGIs $75k-100k, 66.7% for AGIs $100k-200k)
Averages for the 2004 tax year for zip code 77050, filed in 2005:
Average Adjusted Gross Income (AGI) in 2004: $28,379 (Individual Income Tax Returns)
Here:
$28,379
State:
$47,881
Salary/wage: $27,499 (reported on 85.4% of returns)
Here:
$27,499
State:
$41,947
(% of AGI for various income ranges: 96.6% for AGIs below $10k, 80.9% for AGIs $10k-25k, 90.1% for AGIs $25k-50k, 84.7% for AGIs $50k-75k, 71.9% for AGIs $75k-100k, 62.4% for AGIs over 100k)
Taxable interest for individuals: $391 (reported on 16.9% of returns)
This zip code:
$391
Texas:
$2,255
(% of AGI for various income ranges: 0.5% for AGIs below $10k, 0.3% for AGIs $10k-25k, 0.2% for AGIs $25k-50k, 0.2% for AGIs $50k-75k, 0.2% for AGIs $75k-100k, 0.3% for AGIs over 100k)
Taxable dividends: $197 (reported on 4.7% of returns)
Here:
$197
State:
$4,261
(% of AGI for various income ranges: 0.0% for AGIs $10k-25k, 0.0% for AGIs $25k-50k, 0.0% for AGIs $50k-75k, 0.1% for AGIs over 100k)
Net capital gain/loss: +$340 (reported on 2.9% of returns)
Here:
+$340
State:
+$16,110
Profit/loss from business: +$6,334 (reported on 19.2% of returns)
Here:
+$6,334
State:
+$11,013
(% of AGI for various income ranges: 13.3% for AGIs below $10k, 9.7% for AGIs $10k-25k, 2.6% for AGIs $25k-50k, 4.5% for AGIs $50k-75k, 0.4% for AGIs $75k-100k)
Total itemized deductions: $16,969 (31% of AGI, reported on 16.1% of returns)
Here:
$16,969
State:
$19,631
Here:
31.3% of AGI
State:
18.9% of AGI
(% of AGI for various income ranges: 4.8% for AGIs $10k-25k, 8.4% for AGIs $25k-50k, 15.5% for AGIs $50k-75k, 13.6% for AGIs $75k-100k, 12.0% for AGIs over 100k)
Charity contributions deductions: $5,790 (10% of AGI, reported on 14.5% of returns)
Here:
$5,790
State:
$4,753
Here:
10.4% of AGI
State:
4.2% of AGI
(% of AGI for various income ranges: 1.2% for AGIs $10k-25k, 2.6% for AGIs $25k-50k, 3.8% for AGIs $50k-75k, 4.9% for AGIs $75k-100k, 5.1% for AGIs over 100k)
Total tax: $3,473 (reported on 58.4% of returns)
77050:
$3,473
State:
$9,058
(% of AGI for various income ranges: 5.0% for AGIs below $10k, 3.0% for AGIs $10k-25k, 5.0% for AGIs $25k-50k, 9.0% for AGIs $50k-75k, 11.2% for AGIs $75k-100k, 17.1% for AGIs over 100k)
Earned income credit: $2,189 (reported on 34.0% of returns)
Here:
$2,189
State:
$2,024
Percentage of individuals using paid preparers for their 2004 taxes: 70.5%
Here:
70%
State:
57%
(% for various income ranges: 66.5% for AGIs below $10k, 74.1% for AGIs $10k-25k, 69.8% for AGIs $25k-50k, 65.3% for AGIs $50k-75k, 77.8% for AGIs $75k-100k, 70.6% for AGIs over 100k)
Household received Food Stamps/SNAP in the past 12 months: 396 Household did not receive Food Stamps/SNAP in the past 12 months: 1,419
Women who had a birth in the past 12 months: 68 (42 now married, 25 unmarried) Women who did not have a birth in the past 12 months: 1,446 (790 now married, 650 unmarried)
Housing units in zip code 77050 with a mortgage: 228 Median monthly owner costs for units with a mortgage: $1,056 Median monthly owner costs for units without a mortgage: $554
Residents with income below the poverty level in 2022:
This zip code:
50.9%
Whole state:
14.0%
Residents with income below 50% of the poverty level in 2022:
This zip code:
23.1%
Whole state:
7.4%
Median number of rooms in houses and condos:
Here:
5.9
State:
6.3
Median number of rooms in apartments:
Here:
4.2
State:
4.0
Notable locations in this zip code not listed on our city pages
Churches in zip code 77050 include: Jesus Way Baptist Church (A), Riverwood Missionary Baptist Church (B), Heart of Faith Church (C), Mount Houston Baptist Church (D), Shady Oaks Church (E). Display/hide their locations on the map
In group quarters: 1 (-1 institutionalized population)
Size of family households: 465 2-persons, 247 3-persons, 449 4-persons, 192 5-persons, 22 6-persons, 152 7-or-more-persons
Size of nonfamily households: 253 1-person, 5 2-persons
1,725 married couples with children.
236 single-parent households (83 men, 153 women).
32.5% of residents of 77050 zip code speak English at home.
66.3% of residents speak Spanish at home (46% very well, 11% well, 21% not well, 22% not at all).
0.1% of residents speak other Indo-European language at home (100% very well).
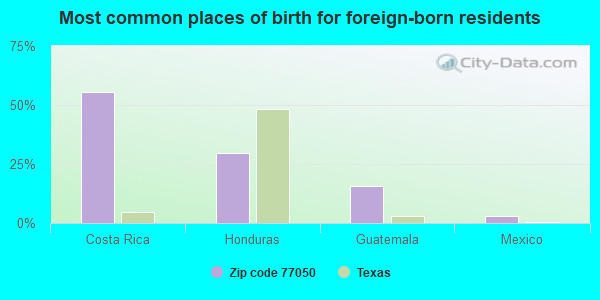
Foreign born population: 2,685 (44.0%) (10.9% of them are naturalized citizens)
Facilities with environmental interests located in this zip code:
7103 CORPORATION (7103 E MOUNT HOUSTON RD in HOUSTON, TX)
(Resource Conservation and Recovery Act (tracking hazardous waste))
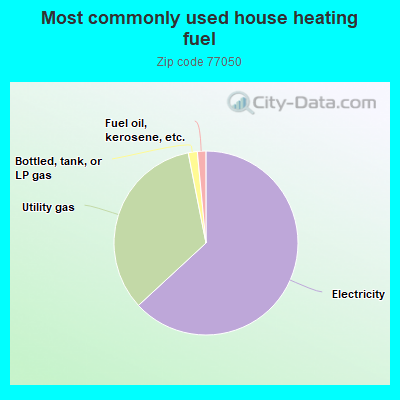
63.2%Electricity
33.8%Utility gas
1.6%Bottled, tank, or LP gas
1.5%Fuel oil, kerosene, etc.
Population in 1990: 3,709. Population change in the 1990s: +648 (+17.5%).
Place of birth for U.S.-born residents:
This state: 2,780
Northeast: 16
Midwest: 261
South: 264
61% of the 77050 zip code residents lived in the same house 5 years ago. Out of people who lived in different houses, 83% lived in this county. Out of people who lived in different counties, 50% lived in Texas.
95% of the 77050 zip code residents lived in the same house 1 year ago. Out of people who lived in different houses, 25% moved from this county. Out of people who lived in different houses, 89% moved from abroad.
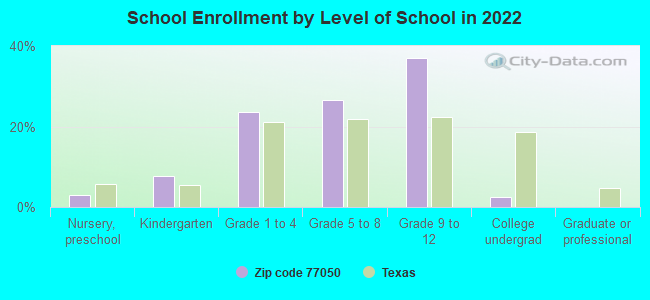
Private vs. public school enrollment:
Students in private schools in grades 1 to 8 (elementary and middle school):
Here:
0.0%
Texas:
8.8%
Students in private schools in grades 9 to 12 (high school):
Here:
0.0%
Texas:
8.0%
Students in private undergraduate colleges: 21
Here:
50.0%
Texas:
16.2%
Occupation by median earnings in the past 12 months ($)
51,019Personal care and service occupations
37,345Transportation occupations
29,783Construction and extraction occupations
28,337Office and administrative support occupations
26,709Installation, maintenance, and repair occupations
19,130Material moving occupations
Top industries in this zip code by the number of employees in 2005:
Mining: Crude Petroleum and Natural Gas Extraction (100-249 employees: 1 establishment)
Construction: Site Preparation Contractors (50-99: 1)
Construction: Water and Sewer Line and Related Structures Construction (50-99: 1)
Construction: Oil and Gas Pipeline and Related Structures Construction (10-19: 1)
Construction: Electrical Contractors (10-19: 1)
Other Services (except Public Administration): Civic and Social Organizations (10-19: 1)
Fatal accident statistics in 2014:
Fatal accident count: 2
Vehicles involved in fatal accidents: 2
Fatal accidents caused by drunken drivers: 1
Fatalities: 2
Persons involved in fatal accidents: 4
Pedestrians involved in fatal accidents: 0
Fatal accident statistics in 2013:
Fatal accident count: 2
Vehicles involved in fatal accidents: 2
Fatal accidents caused by drunken drivers: 2
Fatalities: 2
Persons involved in fatal accidents: 5
Pedestrians involved in fatal accidents: 0
Home Mortgage Disclosure Act Aggregated Statistics For Year 2009 (Based on 2 full and 4 partial tracts)
A) FHA, FSA/RHS & VA Home Purchase Loans
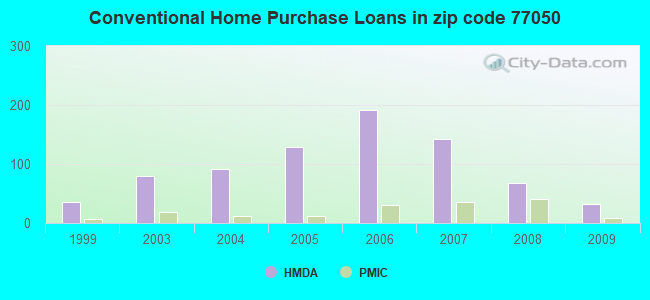
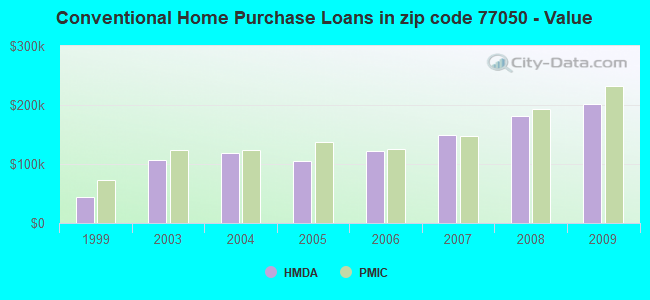
B) Conventional Home Purchase Loans
C) Refinancings
D) Home Improvement Loans
F) Non-occupant Loans on < 5 Family Dwellings (A B C & D)
G) Loans On Manufactured Home Dwelling (A B C & D)
Number
Average Value
Number
Average Value
Number
Average Value
Number
Average Value
Number
Average Value
Number
Average Value
LOANS ORIGINATED
20
$196,554
32
$201,723
57
$182,978
7
$31,390
3
$72,513
0
$0
APPLICATIONS APPROVED, NOT ACCEPTED
2
$122,485
3
$145,673
8
$144,659
0
$0
0
$0
2
$65,440
APPLICATIONS DENIED
7
$157,439
2
$131,705
43
$133,442
24
$26,236
1
$39,910
2
$37,195
APPLICATIONS WITHDRAWN
2
$172,850
5
$123,088
14
$179,182
3
$57,177
0
$0
0
$0
FILES CLOSED FOR INCOMPLETENESS
0
$0
2
$173,130
7
$128,770
7
$29,343
0
$0
0
$0
Aggregated Statistics For Year 2008 (Based on 2 full and 4 partial tracts)
A) FHA, FSA/RHS & VA Home Purchase Loans
B) Conventional Home Purchase Loans
C) Refinancings
D) Home Improvement Loans
F) Non-occupant Loans on < 5 Family Dwellings (A B C & D)
G) Loans On Manufactured Home Dwelling (A B C & D)
Number
Average Value
Number
Average Value
Number
Average Value
Number
Average Value
Number
Average Value
Number
Average Value
LOANS ORIGINATED
17
$146,493
68
$181,583
38
$126,602
14
$34,506
11
$66,759
0
$0
APPLICATIONS APPROVED, NOT ACCEPTED
2
$132,540
10
$147,116
7
$117,403
0
$0
0
$0
3
$43,413
APPLICATIONS DENIED
4
$154,935
15
$109,348
85
$93,352
43
$27,516
12
$49,000
3
$4,580
APPLICATIONS WITHDRAWN
4
$162,568
12
$176,443
27
$93,642
3
$38,647
1
$88,620
0
$0
FILES CLOSED FOR INCOMPLETENESS
0
$0
3
$301,430
11
$91,306
1
$34,450
0
$0
0
$0
Aggregated Statistics For Year 2007 (Based on 2 full and 4 partial tracts)
A) FHA, FSA/RHS & VA Home Purchase Loans
B) Conventional Home Purchase Loans
C) Refinancings
D) Home Improvement Loans
F) Non-occupant Loans on < 5 Family Dwellings (A B C & D)
G) Loans On Manufactured Home Dwelling (A B C & D)
Number
Average Value
Number
Average Value
Number
Average Value
Number
Average Value
Number
Average Value
Number
Average Value
LOANS ORIGINATED
20
$108,959
142
$149,360
49
$82,364
26
$46,910
22
$71,051
3
$28,850
APPLICATIONS APPROVED, NOT ACCEPTED
0
$0
30
$89,144
33
$80,861
3
$64,387
4
$82,930
4
$35,270
APPLICATIONS DENIED
7
$102,849
71
$155,866
157
$100,079
64
$35,672
27
$102,028
9
$43,491
APPLICATIONS WITHDRAWN
5
$132,142
25
$228,427
52
$95,574
1
$56,310
8
$81,825
2
$18,840
FILES CLOSED FOR INCOMPLETENESS
0
$0
9
$128,452
17
$132,514
2
$24,790
2
$38,615
0
$0
Aggregated Statistics For Year 2006 (Based on 2 full and 4 partial tracts)
A) FHA, FSA/RHS & VA Home Purchase Loans
B) Conventional Home Purchase Loans
C) Refinancings
D) Home Improvement Loans
F) Non-occupant Loans on < 5 Family Dwellings (A B C & D)
G) Loans On Manufactured Home Dwelling (A B C & D)
Number
Average Value
Number
Average Value
Number
Average Value
Number
Average Value
Number
Average Value
Number
Average Value
LOANS ORIGINATED
11
$144,614
191
$121,876
88
$89,700
19
$42,129
28
$69,659
5
$31,032
APPLICATIONS APPROVED, NOT ACCEPTED
1
$78,910
63
$110,466
37
$100,554
5
$24,878
13
$90,768
2
$36,680
APPLICATIONS DENIED
2
$88,565
107
$126,949
151
$85,046
56
$43,167
39
$81,530
11
$31,824
APPLICATIONS WITHDRAWN
2
$161,070
51
$121,496
60
$99,296
4
$24,710
18
$77,877
0
$0
FILES CLOSED FOR INCOMPLETENESS
1
$69,610
9
$116,030
27
$89,592
2
$64,450
3
$26,010
0
$0
Aggregated Statistics For Year 2005 (Based on 2 full and 4 partial tracts)
A) FHA, FSA/RHS & VA Home Purchase Loans
B) Conventional Home Purchase Loans
C) Refinancings
D) Home Improvement Loans
F) Non-occupant Loans on < 5 Family Dwellings (A B C & D)
G) Loans On Manufactured Home Dwelling (A B C & D)
Number
Average Value
Number
Average Value
Number
Average Value
Number
Average Value
Number
Average Value
Number
Average Value
LOANS ORIGINATED
8
$97,088
129
$104,733
115
$73,105
21
$58,201
23
$64,922
7
$34,906
APPLICATIONS APPROVED, NOT ACCEPTED
3
$136,877
26
$89,405
21
$86,274
4
$42,742
6
$85,305
2
$45,385
APPLICATIONS DENIED
2
$98,045
82
$69,287
191
$69,974
43
$35,883
21
$62,818
15
$39,105
APPLICATIONS WITHDRAWN
4
$119,620
51
$114,888
112
$102,724
16
$186,247
8
$252,740
0
$0
FILES CLOSED FOR INCOMPLETENESS
0
$0
5
$131,266
30
$88,341
2
$12,075
3
$83,047
0
$0
Aggregated Statistics For Year 2004 (Based on 2 full and 4 partial tracts)
A) FHA, FSA/RHS & VA Home Purchase Loans
B) Conventional Home Purchase Loans
C) Refinancings
D) Home Improvement Loans
E) Loans on Dwellings For 5+ Families
F) Non-occupant Loans on < 5 Family Dwellings (A B C & D)
G) Loans On Manufactured Home Dwelling (A B C & D)
Number
Average Value
Number
Average Value
Number
Average Value
Number
Average Value
Number
Average Value
Number
Average Value
Number
Average Value
LOANS ORIGINATED
14
$88,386
91
$117,829
112
$73,647
15
$21,004
0
$0
19
$59,644
1
$36,970
APPLICATIONS APPROVED, NOT ACCEPTED
1
$59,980
60
$80,625
40
$53,585
8
$87,846
0
$0
7
$58,746
6
$36,833
APPLICATIONS DENIED
3
$112,413
46
$80,344
155
$66,558
47
$27,838
2
$218,130
14
$41,881
13
$44,256
APPLICATIONS WITHDRAWN
2
$74,390
40
$89,162
102
$64,000
2
$68,985
0
$0
14
$52,859
3
$58,543
FILES CLOSED FOR INCOMPLETENESS
0
$0
10
$144,198
38
$91,558
0
$0
0
$0
0
$0
0
$0
Aggregated Statistics For Year 2003 (Based on 2 full and 4 partial tracts)
A) FHA, FSA/RHS & VA Home Purchase Loans
B) Conventional Home Purchase Loans
C) Refinancings
D) Home Improvement Loans
F) Non-occupant Loans on < 5 Family Dwellings (A B C & D)
Number
Average Value
Number
Average Value
Number
Average Value
Number
Average Value
Number
Average Value
LOANS ORIGINATED
13
$65,115
80
$106,860
94
$62,246
10
$27,501
8
$72,929
APPLICATIONS APPROVED, NOT ACCEPTED
2
$75,440
27
$100,377
32
$54,015
5
$53,784
3
$38,033
APPLICATIONS DENIED
3
$70,457
68
$55,061
216
$57,587
41
$26,361
22
$61,331
APPLICATIONS WITHDRAWN
0
$0
23
$60,164
78
$65,820
5
$9,572
4
$51,680
FILES CLOSED FOR INCOMPLETENESS
1
$73,080
8
$117,711
11
$72,372
2
$52,400
0
$0
Aggregated Statistics For Year 1999 (Based on 1 full and 2 partial tracts)
A) FHA, FSA/RHS & VA Home Purchase Loans
B) Conventional Home Purchase Loans
C) Refinancings
D) Home Improvement Loans
F) Non-occupant Loans on < 5 Family Dwellings (A B C & D)
2004 - 2018 National Fire Incident Reporting System (NFIRS) incidents
Based on the data from the years 2004 - 2018 the average number of fire incidents per year is 19. The highest number of fires - 42 took place in 2014, and the least - 2 in 2008. The data has a rising trend.
When looking into fire subcategories, the most reports belonged to: Outside Fires (50.0%), and Structure Fires (23.4%).
Fire incident types reported to NFIRS in Zip Code 77050


 Nearest zip codes: 77396, 77016, 77078, 77039, 77028, 77093.


 Based on the data from the years 2004 - 2018 the average number of fire incidents per year is 19. The highest number of fires - 42 took place in 2014, and the least - 2 in 2008. The data has a rising trend.
 When looking into fire subcategories, the most reports belonged to: Outside Fires (50.0%), and Structure Fires (23.4%).