Estimated zip code population in 2022: 20,271 Zip code population in 2010: 15,294 Zip code population in 2000: 14,267
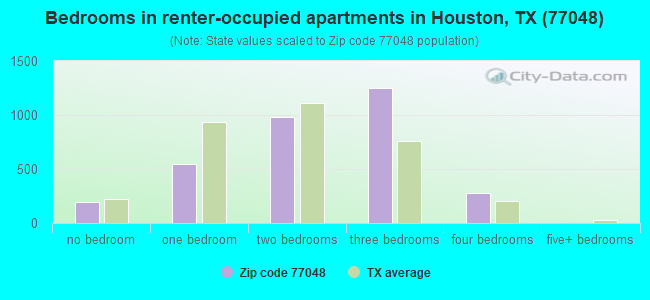
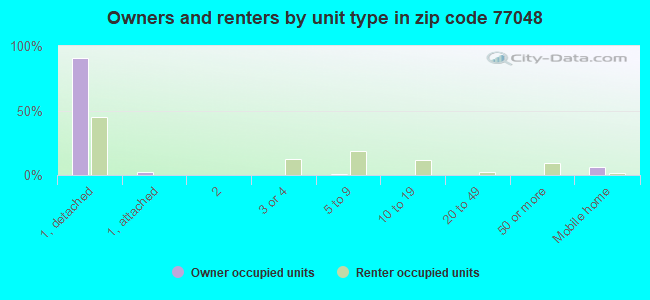
Houses and condos: 7,890 Renter-occupied apartments: 3,259
% of renters here:
43%
State:
38%
March 2022 cost of living index in zip code 77048: 96.3 (near average, U.S. average is 100)
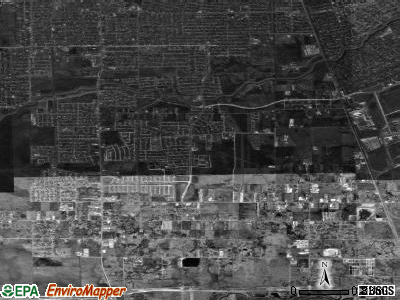
Land area: 11.1 sq. mi. Water area: 0.1 sq. mi.
Population density: 1,829 people per square mile
(low).
OSM Map
General Map
Google Map
MSN Map
OSM Map
General Map
Google Map
MSN Map
OSM Map
General Map
Google Map
MSN Map
OSM Map
General Map
Google Map
MSN Map
Please wait while loading the map...
Real estate property taxes paid for housing units in 2022:
This zip code:
1.1% ($1,993)
Texas:
1.5% ($4,050)
Median real estate property taxes paid for housing units with mortgages in 2022: $2,522 (1.1%) Median real estate property taxes paid for housing units with no mortgage in 2022: $1,179 (1.0%)
Averages for the 2020 tax year for zip code 77048, filed in 2021:
Average Adjusted Gross Income (AGI) in 2020: $36,517 (Individual Income Tax Returns)
Here:
$36,517
State:
$77,054
Salary/wage: $35,869 (reported on 84.5% of returns)
Here:
$35,869
State:
$62,766
(% of AGI for various income ranges: 1266.8% for AGIs below $25k, 3613.0% for AGIs $25k-50k, 6802.9% for AGIs $50k-75k, 9950.3% for AGIs $75k-100k, 14829.2% for AGIs $100k-200k)
Taxable interest for individuals: $351 (reported on 7.6% of returns)
This zip code:
$351
Texas:
$2,665
(% of AGI for various income ranges: 1.2% for AGIs below $25k, 1.0% for AGIs $25k-50k, 2.4% for AGIs $50k-75k, 4.5% for AGIs $75k-100k, 58.8% for AGIs $100k-200k)
Ordinary dividends: $1,612 (reported on 2.7% of returns)
Here:
$1,612
State:
$10,044
(% of AGI for various income ranges: 2.3% for AGIs below $25k, 7.1% for AGIs $25k-50k, 11.5% for AGIs $50k-75k, 2.4% for AGIs $75k-100k, 10.0% for AGIs $100k-200k)
Net capital gain/loss in AGI: +$2,679 (reported on 2.5% of returns)
Here:
+$2,679
State:
+$39,590
(% of AGI for various income ranges: 0.6% for AGIs below $25k, 1.8% for AGIs $25k-50k, 75.3% for AGIs $75k-100k, 120.0% for AGIs $100k-200k)
Taxable individual retirement arrangement distribution: $11,539 (reported on 2.9% of returns)
77048:
$11,539
Texas:
$24,740
(% of AGI for various income ranges: 15.6% for AGIs below $25k, 18.8% for AGIs $25k-50k, 109.1% for AGIs $50k-75k, 434.0% for AGIs $100k-200k)
Total itemized deductions: $27,377 (reported on 6.0% of returns)
Here:
$27,377
State:
$40,428
(% of AGI for various income ranges: 22.6% for AGIs below $25k, 165.5% for AGIs $25k-50k, 484.3% for AGIs $50k-75k, 797.6% for AGIs $75k-100k, 1034.4% for AGIs $100k-200k)
Charity contributions: $9,358 (reported on 5.0% of returns)
Here:
$9,358
State:
$18,201
(% of AGI for various income ranges: 4.6% for AGIs below $25k, 43.7% for AGIs $25k-50k, 127.0% for AGIs $50k-75k, 201.3% for AGIs $75k-100k, 459.2% for AGIs $100k-200k)
Taxes paid: $6,116 (reported on 5.2% of returns)
77048:
$6,116
State:
$7,821
(% of AGI for various income ranges: 5.2% for AGIs below $25k, 32.2% for AGIs $25k-50k, 92.1% for AGIs $50k-75k, 153.4% for AGIs $75k-100k, 208.4% for AGIs $100k-200k)
Earned income credit: $2,811 (reported on 34.8% of returns)
Here:
$2,811
State:
$2,584
(% of AGI for various income ranges: 183.0% for AGIs below $25k, 101.7% for AGIs $25k-50k, 1.5% for AGIs $50k-75k)
Percentage of individuals using paid preparers for their 2020 taxes: 92.5%
Here:
92%
State:
92%
(% for various income ranges: 92.1% for AGIs below $25k, 93.5% for AGIs $25k-50k, 92.9% for AGIs $50k-75k, 92.3% for AGIs $75k-100k, 88.6% for AGIs $100k-200k, 75.0% for AGIs over 200k)
Averages for the 2012 tax year for zip code 77048, filed in 2013:
Average Adjusted Gross Income (AGI) in 2012: $29,988 (Individual Income Tax Returns)
Here:
$29,988
State:
$65,384
Salary/wage: $28,972 (reported on 86.1% of returns)
Here:
$28,972
State:
$52,524
(% of AGI for various income ranges: 80.5% for AGIs below $25k, 87.9% for AGIs $25k-50k, 83.2% for AGIs $50k-75k, 84.7% for AGIs $75k-100k, 74.3% for AGIs $100k-200k)
Taxable interest for individuals: $385 (reported on 9.5% of returns)
This zip code:
$385
Texas:
$2,372
(% of AGI for various income ranges: 0.1% for AGIs $50k-75k, 0.4% for AGIs $100k-200k)
Ordinary dividends: $2,630 (reported on 3.8% of returns)
Here:
$2,630
State:
$9,721
(% of AGI for various income ranges: 0.5% for AGIs below $25k, 0.3% for AGIs $25k-50k, 0.4% for AGIs $50k-75k, 0.3% for AGIs $100k-200k)
Net capital gain/loss in AGI: +$300 (reported on 1.3% of returns)
Here:
+$300
State:
+$35,319
(% of AGI for various income ranges: )
Profit/loss from business: +$3,399 (reported on 21.1% of returns)
Here:
+$3,399
State:
+$13,732
(% of AGI for various income ranges: 8.9% for AGIs below $25k, 1.1% for AGIs $50k-75k, 1.0% for AGIs $100k-200k)
Taxable individual retirement arrangement distribution: $10,040 (reported on 3.5% of returns)
77048:
$10,040
Texas:
$19,511
(% of AGI for various income ranges: 0.9% for AGIs below $25k, 0.9% for AGIs $25k-50k, 1.3% for AGIs $50k-75k, 1.5% for AGIs $75k-100k, 2.1% for AGIs $100k-200k)
Total itemized deductions: $17,531 (30% of AGI, reported on 16.6% of returns)
Here:
$17,531
State:
$24,724
Here:
29.9% of AGI
State:
15.9% of AGI
(% of AGI for various income ranges: 3.6% for AGIs below $25k, 10.3% for AGIs $25k-50k, 12.7% for AGIs $50k-75k, 13.0% for AGIs $75k-100k, 12.3% for AGIs $100k-200k)
Charity contributions: $4,983 (reported on 14.0% of returns)
Here:
$4,983
State:
$6,808
(% of AGI for various income ranges: 0.6% for AGIs below $25k, 2.3% for AGIs $25k-50k, 3.2% for AGIs $50k-75k, 3.3% for AGIs $75k-100k, 3.6% for AGIs $100k-200k)
Taxes paid: $3,130 (reported on 16.0% of returns)
77048:
$3,130
State:
$6,921
(% of AGI for various income ranges: 0.5% for AGIs below $25k, 1.7% for AGIs $25k-50k, 2.2% for AGIs $50k-75k, 2.4% for AGIs $75k-100k, 2.4% for AGIs $100k-200k)
Earned income credit: $2,711 (reported on 40.7% of returns)
Here:
$2,711
State:
$2,570
(% of AGI for various income ranges: 12.9% for AGIs below $25k, 1.7% for AGIs $25k-50k)
Percentage of individuals using paid preparers for their 2012 taxes: 55.7%
Here:
56%
State:
51%
(% for various income ranges: 57.0% for AGIs below $25k, 52.8% for AGIs $25k-50k, 54.2% for AGIs $50k-75k, 55.6% for AGIs $75k-100k, 66.7% for AGIs $100k-200k)
Averages for the 2004 tax year for zip code 77048, filed in 2005:
Average Adjusted Gross Income (AGI) in 2004: $24,679 (Individual Income Tax Returns)
Here:
$24,679
State:
$47,881
Salary/wage: $23,778 (reported on 89.1% of returns)
Here:
$23,778
State:
$41,947
(% of AGI for various income ranges: 90.1% for AGIs below $10k, 85.9% for AGIs $10k-25k, 89.8% for AGIs $25k-50k, 83.0% for AGIs $50k-75k, 80.8% for AGIs $75k-100k, 73.8% for AGIs over 100k)
Taxable interest for individuals: $592 (reported on 14.1% of returns)
This zip code:
$592
Texas:
$2,255
(% of AGI for various income ranges: 0.6% for AGIs below $10k, 0.3% for AGIs $10k-25k, 0.4% for AGIs $25k-50k, 0.2% for AGIs $50k-75k, 0.3% for AGIs $75k-100k, 0.5% for AGIs over 100k)
Taxable dividends: $388 (reported on 4.3% of returns)
Here:
$388
State:
$4,261
(% of AGI for various income ranges: 0.2% for AGIs below $10k, 0.1% for AGIs $10k-25k, 0.0% for AGIs $25k-50k, 0.1% for AGIs $50k-75k, 0.0% for AGIs $75k-100k, 0.1% for AGIs over 100k)
Profit/loss from business: +$3,441 (reported on 14.3% of returns)
Here:
+$3,441
State:
+$11,013
(% of AGI for various income ranges: 16.8% for AGIs below $10k, 4.9% for AGIs $10k-25k, -0.1% for AGIs $25k-50k, -0.0% for AGIs $50k-75k, -0.4% for AGIs $75k-100k, -0.7% for AGIs over 100k)
IRA payment deduction: $2,350 (reported on 0.7% of returns)
77048:
$2,350
Texas:
$3,120
Total itemized deductions: $14,925 (31% of AGI, reported on 14.3% of returns)
Here:
$14,925
State:
$19,631
Here:
31.2% of AGI
State:
18.9% of AGI
(% of AGI for various income ranges: 2.9% for AGIs below $10k, 4.2% for AGIs $10k-25k, 9.8% for AGIs $25k-50k, 12.0% for AGIs $50k-75k, 11.8% for AGIs $75k-100k, 10.5% for AGIs over 100k)
Charity contributions deductions: $5,008 (10% of AGI, reported on 12.9% of returns)
Here:
$5,008
State:
$4,753
Here:
10.2% of AGI
State:
4.2% of AGI
(% of AGI for various income ranges: 0.4% for AGIs below $10k, 0.9% for AGIs $10k-25k, 2.9% for AGIs $25k-50k, 4.3% for AGIs $50k-75k, 3.7% for AGIs $75k-100k, 3.8% for AGIs over 100k)
Total tax: $2,978 (reported on 54.6% of returns)
77048:
$2,978
State:
$9,058
(% of AGI for various income ranges: 3.1% for AGIs below $10k, 2.6% for AGIs $10k-25k, 5.4% for AGIs $25k-50k, 9.3% for AGIs $50k-75k, 11.3% for AGIs $75k-100k, 18.5% for AGIs over 100k)
Earned income credit: $2,165 (reported on 45.1% of returns)
Here:
$2,165
State:
$2,024
Percentage of individuals using paid preparers for their 2004 taxes: 66.5%
Here:
66%
State:
57%
(% for various income ranges: 66.3% for AGIs below $10k, 71.8% for AGIs $10k-25k, 62.3% for AGIs $25k-50k, 58.1% for AGIs $50k-75k, 54.5% for AGIs $75k-100k, 69.8% for AGIs over 100k)
Household received Food Stamps/SNAP in the past 12 months: 1,993 Household did not receive Food Stamps/SNAP in the past 12 months: 5,567
Women who had a birth in the past 12 months: 445 (414 now married, 37 unmarried) Women who did not have a birth in the past 12 months: 4,488 (1,202 now married, 3,310 unmarried)
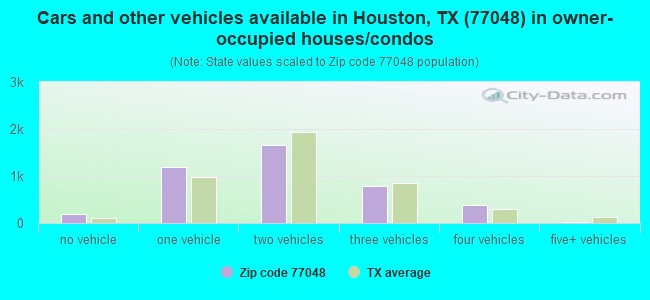
Housing units in zip code 77048 with a mortgage: 2,643 (182 second mortgage, 15 both second mortgage and home equity loan) Median monthly owner costs for units with a mortgage: $1,633 Median monthly owner costs for units without a mortgage: $479
Residents with income below the poverty level in 2022:
This zip code:
28.9%
Whole state:
14.0%
Residents with income below 50% of the poverty level in 2022:
This zip code:
14.1%
Whole state:
7.4%
Median number of rooms in houses and condos:
Here:
5.8
State:
6.3
Median number of rooms in apartments:
Here:
5.1
State:
4.0
Notable locations in this zip code not listed on our city pages
Churches in zip code 77048 include: Charity Missionary Baptist Church (A), Harmony Baptist Church (B), Cullen Baptist Church (C), Crestmont Park Church of Christ (D), Mount Pilgrim Baptist Church (E), Mount of Salvation Baptist Church (F), Mount Canaan Baptist Church (G), New Mount Pilgrim Baptist Church (H), New Jerusalem Baptist Church (I). Display/hide their locations on the map
Parks in zip code 77048 include: Crestmont Park (1), Johnny Nash Indoor Arena (2), Sterling High School Baseball Field (3), Christia Adair County Park (4). Display/hide their locations on the map
In group quarters: 16 (-1 institutionalized population)
Size of family households: 1,917 2-persons, 1,151 3-persons, 1,426 4-persons, 434 5-persons, 166 6-persons, 41 7-or-more-persons
Size of nonfamily households: 2,003 1-person, 294 2-persons, 51 3-persons
2,203 married couples with children.
2,694 single-parent households (158 men, 2,536 women).
76.4% of residents of 77048 zip code speak English at home.
19.8% of residents speak Spanish at home (61% very well, 8% well, 13% not well, 18% not at all).
0.9% of residents speak other Indo-European language at home (64% very well, 36% well).
2.5% of residents speak Asian or Pacific Island language at home (52% very well, 48% well).
0.3% of residents speak other language at home (100% very well).
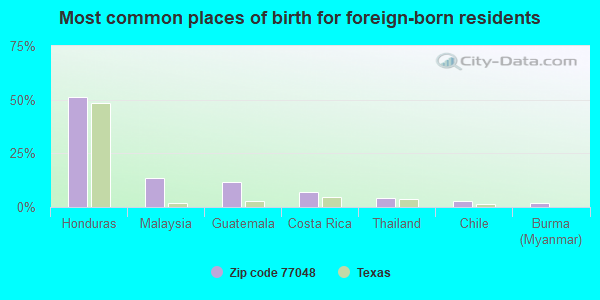
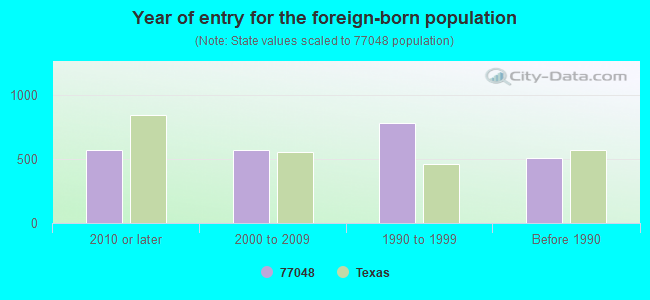
Foreign born population: 2,216 (10.9%) (33.0% of them are naturalized citizens)
ENFORCEMENT/COMPLIANCE ACTIVITY (Integrated Compliance Information System) - ICIS-06-1988-0301, FORMAL ENFORCEMENT ACTION (Integrated Compliance Information System) - ICIS-06-1988-0301, FORMAL ENFORCEMENT ACTION COMPLIANCE ACTIVITY (Tracking inspections of insecticide, fungicide, and rodenticide, and toxic substances) Large Quantity Generators, more that 1000 kg of hazardous waste/month (Resource Conservation and Recovery Act (tracking hazardous waste)) - notification TSD (Resource Conservation and Recovery Act (tracking hazardous waste)) TRI REPORTER (Tracking of toxic chemicals releasing facilities) Business SIC classification: CHEMICALS AND CHEMICAL PREPARATIONS; SPECIAL INDUSTRY MACHINERY Business NAICS classification: ALL OTHER MISCELLANEOUS CHEMICAL PRODUCT AND PREPARATION MANUFACTURING. Organizations: ASHLAND SPECIALTY CHEMICAL COMPANY (CONTACT/OPERATOR)
, ASHLAND INC (CONTACT/OWNER)
Alternative names: ASHLAND SPECIALTY CHEMICAL COMPANY, DREW CHEMICAL CORP
A & R GENERAL CONTRACTORS INC (12040 MARTINDALE RD in HOUSTON, TX)
HAZARDOUS WASTE BIENNIAL REPORTER (Resource Conservation and Recovery Act (tracking hazardous waste)) (Resource Conservation and Recovery Act (tracking hazardous waste)) Business NAICS classification: METAL COATING, ENGRAVING (EXCEPT JEWELRY AND SILVERWARE), AND ALLIED SERVICES TO MANUFACTURERS. Organizations: BRUMLEYRICK R (CONTACT/OPERATOR)
ALAMO TRANSFORMER SUPPLY COMPANY (10220 MYKAWA in HOUSTON, TX)
COMPLIANCE ACTIVITY (Tracking inspections of insecticide, fungicide, and rodenticide, and toxic substances) (Resource Conservation and Recovery Act (tracking hazardous waste)) Business SIC classification: POWER, DISTRIBUTION, AND SPECIALTY TRANSFORMERS; ELECTRICAL AND ELECTRONIC REPAIR SHOPS Business NAICS classification: ELECTRONIC COIL, TRANSFORMER, AND OTHER INDUCTOR MANUFACTURING.
A & R GENERAL CONTRACTORS INC (5225 SCHURMIER RD in HOUSTON, TX)
Small Quantity Generators, between 100 kg and 1000 kg of hazardous waste/month (Resource Conservation and Recovery Act (tracking hazardous waste)) - notification Business NAICS classification: METAL COATING, ENGRAVING (EXCEPT JEWELRY AND SILVERWARE), AND ALLIED SERVICES TO MANUFACTURERS. Organizations: BRUMLEYRICK R (CONTACT/OPERATOR)
Alternative names: A AND B GENERAL CONTRACTORS
Housing units lacking complete plumbing facilities: 2.2% Housing units lacking complete kitchen facilities: 2.5%
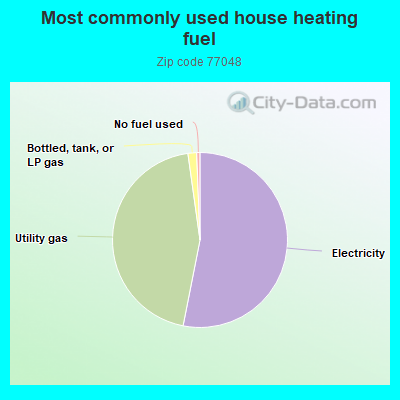
52.9%Electricity
44.5%Utility gas
1.6%Bottled, tank, or LP gas
0.6%No fuel used
Population in 1990: 13,873. Population change in the 1990s: +394 (+2.8%).
Place of birth for U.S.-born residents:
This state: 14,095
Northeast: 110
Midwest: 337
South: 2,859
West: 257
63% of the 77048 zip code residents lived in the same house 5 years ago. Out of people who lived in different houses, 83% lived in this county. Out of people who lived in different counties, 50% lived in Texas.
91% of the 77048 zip code residents lived in the same house 1 year ago. Out of people who lived in different houses, 79% moved from this county. Out of people who lived in different houses, 15% moved from different county within same state. Out of people who lived in different houses, 1% moved from different state. Out of people who lived in different houses, 0% moved from abroad.
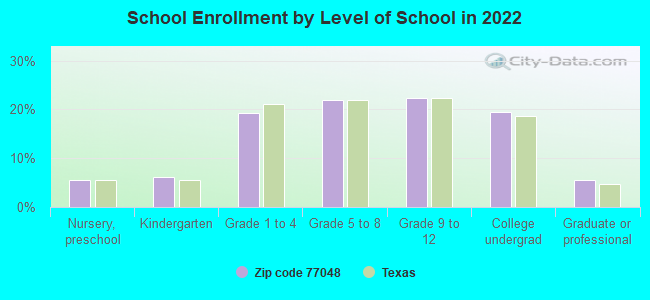
Private vs. public school enrollment:
Students in private schools in grades 1 to 8 (elementary and middle school): 251
Here:
10.7%
Texas:
8.8%
Students in private schools in grades 9 to 12 (high school): 34
Here:
2.7%
Texas:
8.0%
Students in private undergraduate colleges: 267
Here:
24.1%
Texas:
16.2%
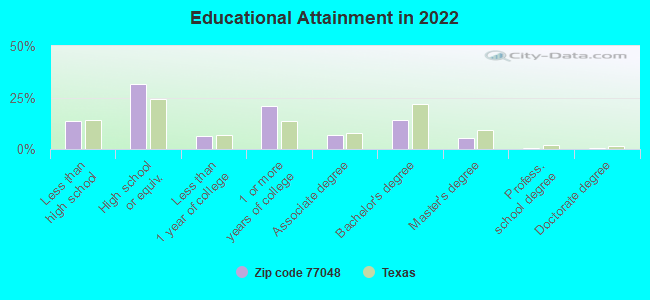
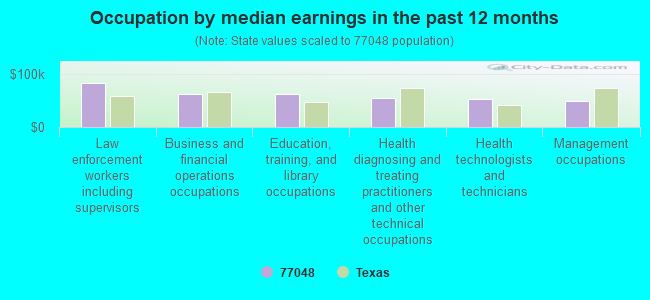
Occupation by median earnings in the past 12 months ($)
82,317Law enforcement workers including supervisors
61,184Business and financial operations occupations
60,842Education, training, and library occupations
53,759Health diagnosing and treating practitioners and other technical occupations
51,671Health technologists and technicians
48,556Management occupations
Companies with federal contracts located in this zip code (HOUSTON, TX):
IWL COMMUNICATIONS, INC (4400 S SAM HOUSTON PARKWA; small business)
$19,130 with Navy for Telephone and/or Communications Services (includes Telegraph, Telex, and Cablevision Services). Signed on 2004-09-30. Completion date: 2004-11-10.
A & R GENERAL CONTRACTORS INC (5225 SCHURMIER RD; small business)
$3,900 with Army for Maintenance, Repair and Rebuilding of Equipment -- Ground Effect Vehicles, Motor Vehicles, Trailers, and Cycles. Signed on 2004-09-24. Completion date: 2004-10-30.
CRANE RENTAL DIVISION INCORPOR (5902 ALLISON RD; small business)
$3,800 with Army for Installation of Equipment -- Service and Trade Equipment. Signed on 2006-01-08. Completion date: 2006-02-28.
C C CARLTON CONSTRUCTION COMPA (6230 CARSON RD; small business) : $120 in 3 contractsfrom 1999 to 2002
$2,000 with United States Coast Guard (disused code: now 7008) for Construction of Structures and Facilities -- Office Buildings. Signed on 2000-04-15. Completion date: 1998-06-15.
-$200 with Navy for Construction of Structures and Facilities -- Other Non-Building Facilities. Signed on 2002-06-02. Completion date: 1998-10-01.
-$1,680 with Navy for Maintenance, Repair or Alteration of Real Property -- Water Supply Facilities. Signed on 1999-10-01. Completion date: 1999-05-06.
Top industries in this zip code by the number of employees in 2005:
Construction: Poured Concrete Foundation and Structure Contractors (250-499 employees: 1 establishment)
Wholesale Trade: Other Chemical and Allied Products Merchant Wholesalers (100-249: 1)
Construction: Site Preparation Contractors (50-99: 1, 1-4: 2)
Other Services (except Public Administration): Commercial and Industrial Machinery and Equipment (except Automotive and Electronic) Repair and Maintenance (10-19: 2, 5-9: 1, 1-4: 2)
Administrative and Support and Waste Management and Remediation Services: Remediation Services (20-49: 1, 5-9: 1)
People in group quarters in 2010:
4 people in group homes intended for adults
People in group quarters in 2000:
2 people in religious group quarters
Fatal accident statistics in 2014:
Fatal accident count: 2
Vehicles involved in fatal accidents: 3
Fatal accidents caused by drunken drivers: 2
Fatalities: 2
Persons involved in fatal accidents: 3
Pedestrians involved in fatal accidents: 0
Fatal accident statistics in 2013:
Fatal accident count: 6
Vehicles involved in fatal accidents: 9
Fatal accidents caused by drunken drivers: 1
Fatalities: 7
Persons involved in fatal accidents: 10
Pedestrians involved in fatal accidents: 2
Home Mortgage Disclosure Act Aggregated Statistics For Year 2009 (Based on 4 full and 2 partial tracts)
A) FHA, FSA/RHS & VA Home Purchase Loans
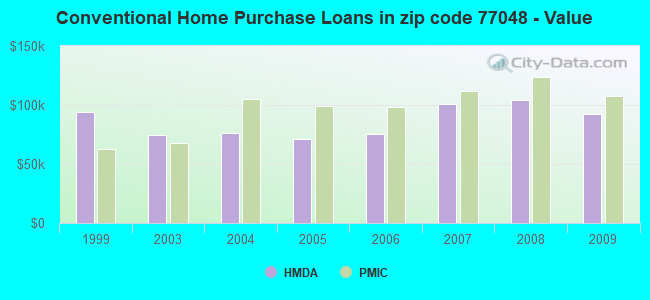
B) Conventional Home Purchase Loans
C) Refinancings
D) Home Improvement Loans
E) Loans on Dwellings For 5+ Families
F) Non-occupant Loans on < 5 Family Dwellings (A B C & D)
G) Loans On Manufactured Home Dwelling (A B C & D)
Number
Average Value
Number
Average Value
Number
Average Value
Number
Average Value
Number
Average Value
Number
Average Value
Number
Average Value
LOANS ORIGINATED
245
$120,851
45
$92,602
97
$109,124
11
$26,671
2
$522,115
24
$62,663
1
$18,060
APPLICATIONS APPROVED, NOT ACCEPTED
14
$117,125
4
$69,575
20
$108,118
4
$23,938
0
$0
2
$42,960
0
$0
APPLICATIONS DENIED
74
$115,281
17
$69,846
157
$93,883
44
$15,617
0
$0
17
$55,739
3
$66,777
APPLICATIONS WITHDRAWN
30
$126,596
5
$117,930
54
$110,382
7
$38,097
0
$0
1
$110,190
0
$0
FILES CLOSED FOR INCOMPLETENESS
11
$106,609
3
$95,137
16
$91,158
9
$37,873
0
$0
1
$57,800
0
$0
Aggregated Statistics For Year 2008 (Based on 4 full and 2 partial tracts)
A) FHA, FSA/RHS & VA Home Purchase Loans
B) Conventional Home Purchase Loans
C) Refinancings
D) Home Improvement Loans
E) Loans on Dwellings For 5+ Families
F) Non-occupant Loans on < 5 Family Dwellings (A B C & D)
G) Loans On Manufactured Home Dwelling (A B C & D)
Number
Average Value
Number
Average Value
Number
Average Value
Number
Average Value
Number
Average Value
Number
Average Value
Number
Average Value
LOANS ORIGINATED
269
$130,865
138
$104,266
99
$91,590
39
$37,069
3
$6,546,167
59
$87,385
3
$17,463
APPLICATIONS APPROVED, NOT ACCEPTED
14
$115,775
14
$115,396
35
$77,907
10
$54,333
0
$0
8
$73,648
0
$0
APPLICATIONS DENIED
119
$133,251
79
$149,038
263
$93,169
142
$28,742
0
$0
36
$62,430
2
$60,515
APPLICATIONS WITHDRAWN
59
$133,288
31
$111,920
89
$88,035
9
$47,868
0
$0
7
$74,956
0
$0
FILES CLOSED FOR INCOMPLETENESS
7
$148,641
13
$151,414
24
$97,398
5
$55,548
0
$0
2
$389,845
0
$0
Aggregated Statistics For Year 2007 (Based on 4 full and 2 partial tracts)
A) FHA, FSA/RHS & VA Home Purchase Loans
B) Conventional Home Purchase Loans
C) Refinancings
D) Home Improvement Loans
E) Loans on Dwellings For 5+ Families
F) Non-occupant Loans on < 5 Family Dwellings (A B C & D)
G) Loans On Manufactured Home Dwelling (A B C & D)
Number
Average Value
Number
Average Value
Number
Average Value
Number
Average Value
Number
Average Value
Number
Average Value
Number
Average Value
LOANS ORIGINATED
109
$126,302
381
$100,787
157
$86,599
55
$31,107
0
$0
77
$80,025
2
$14,000
APPLICATIONS APPROVED, NOT ACCEPTED
16
$101,271
105
$94,350
66
$83,305
11
$29,520
0
$0
21
$74,230
5
$84,528
APPLICATIONS DENIED
54
$131,113
330
$103,518
472
$85,420
181
$30,806
0
$0
54
$72,364
6
$88,878
APPLICATIONS WITHDRAWN
25
$132,393
127
$121,437
188
$82,762
30
$44,589
3
$520,067
17
$78,535
0
$0
FILES CLOSED FOR INCOMPLETENESS
6
$140,297
49
$119,040
50
$92,920
12
$71,127
0
$0
1
$156,250
0
$0
Aggregated Statistics For Year 2006 (Based on 4 full and 2 partial tracts)
A) FHA, FSA/RHS & VA Home Purchase Loans
B) Conventional Home Purchase Loans
C) Refinancings
D) Home Improvement Loans
E) Loans on Dwellings For 5+ Families
F) Non-occupant Loans on < 5 Family Dwellings (A B C & D)
G) Loans On Manufactured Home Dwelling (A B C & D)
Number
Average Value
Number
Average Value
Number
Average Value
Number
Average Value
Number
Average Value
Number
Average Value
Number
Average Value
LOANS ORIGINATED
75
$127,007
844
$75,340
267
$74,859
56
$38,894
2
$447,525
151
$67,372
6
$49,793
APPLICATIONS APPROVED, NOT ACCEPTED
20
$126,042
221
$76,398
59
$94,758
12
$45,285
0
$0
47
$70,347
3
$7,770
APPLICATIONS DENIED
41
$132,795
421
$75,579
464
$76,801
151
$33,559
0
$0
78
$73,125
9
$36,804
APPLICATIONS WITHDRAWN
26
$108,652
248
$83,236
268
$83,798
21
$34,403
0
$0
41
$70,332
0
$0
FILES CLOSED FOR INCOMPLETENESS
9
$116,613
46
$74,125
61
$90,218
2
$36,965
0
$0
4
$83,040
0
$0
Aggregated Statistics For Year 2005 (Based on 4 full and 2 partial tracts)
A) FHA, FSA/RHS & VA Home Purchase Loans
B) Conventional Home Purchase Loans
C) Refinancings
D) Home Improvement Loans
E) Loans on Dwellings For 5+ Families
F) Non-occupant Loans on < 5 Family Dwellings (A B C & D)
G) Loans On Manufactured Home Dwelling (A B C & D)
Number
Average Value
Number
Average Value
Number
Average Value
Number
Average Value
Number
Average Value
Number
Average Value
Number
Average Value
LOANS ORIGINATED
90
$115,244
658
$71,476
283
$66,381
82
$55,125
2
$372,940
132
$57,718
9
$29,459
APPLICATIONS APPROVED, NOT ACCEPTED
22
$122,473
197
$71,963
76
$73,559
16
$40,998
0
$0
26
$76,706
7
$63,227
APPLICATIONS DENIED
49
$128,483
445
$82,922
478
$69,764
146
$33,973
0
$0
84
$55,337
12
$41,127
APPLICATIONS WITHDRAWN
43
$115,826
251
$80,377
301
$87,399
44
$117,410
0
$0
47
$86,740
0
$0
FILES CLOSED FOR INCOMPLETENESS
4
$104,320
23
$84,386
96
$86,349
0
$0
0
$0
6
$71,068
0
$0
Aggregated Statistics For Year 2004 (Based on 4 full and 2 partial tracts)
A) FHA, FSA/RHS & VA Home Purchase Loans
B) Conventional Home Purchase Loans
C) Refinancings
D) Home Improvement Loans
E) Loans on Dwellings For 5+ Families
F) Non-occupant Loans on < 5 Family Dwellings (A B C & D)
G) Loans On Manufactured Home Dwelling (A B C & D)
Number
Average Value
Number
Average Value
Number
Average Value
Number
Average Value
Number
Average Value
Number
Average Value
Number
Average Value
LOANS ORIGINATED
62
$113,082
326
$76,520
403
$65,145
47
$38,170
2
$8,254,350
60
$60,827
18
$38,898
APPLICATIONS APPROVED, NOT ACCEPTED
11
$77,845
148
$60,824
105
$68,551
11
$39,681
0
$0
20
$50,934
11
$28,085
APPLICATIONS DENIED
33
$106,352
163
$75,115
530
$66,483
124
$32,373
0
$0
47
$66,137
9
$46,013
APPLICATIONS WITHDRAWN
17
$110,320
69
$84,649
239
$70,256
16
$39,465
0
$0
12
$87,484
2
$49,675
FILES CLOSED FOR INCOMPLETENESS
0
$0
14
$79,846
108
$79,404
2
$36,965
0
$0
4
$69,820
0
$0
Aggregated Statistics For Year 2003 (Based on 4 full and 2 partial tracts)
A) FHA, FSA/RHS & VA Home Purchase Loans
B) Conventional Home Purchase Loans
C) Refinancings
D) Home Improvement Loans
F) Non-occupant Loans on < 5 Family Dwellings (A B C & D)
Number
Average Value
Number
Average Value
Number
Average Value
Number
Average Value
Number
Average Value
LOANS ORIGINATED
49
$97,553
146
$74,474
363
$66,702
38
$26,836
48
$49,988
APPLICATIONS APPROVED, NOT ACCEPTED
24
$109,735
52
$78,318
114
$65,893
12
$22,879
18
$47,028
APPLICATIONS DENIED
11
$89,275
93
$76,560
560
$62,692
79
$29,378
35
$63,551
APPLICATIONS WITHDRAWN
4
$109,292
47
$102,288
362
$66,577
3
$13,000
4
$31,328
FILES CLOSED FOR INCOMPLETENESS
2
$19,890
31
$77,588
28
$72,359
0
$0
4
$51,218
Aggregated Statistics For Year 1999 (Based on 2 full and 1 partial tracts)
A) FHA, FSA/RHS & VA Home Purchase Loans
B) Conventional Home Purchase Loans
C) Refinancings
D) Home Improvement Loans
F) Non-occupant Loans on < 5 Family Dwellings (A B C & D)
2002 - 2018 National Fire Incident Reporting System (NFIRS) incidents
Based on the data from the years 2002 - 2018 the average number of fire incidents per year is 7. The highest number of fires - 67 took place in 2018, and the least - 0 in 2004. The data has a rising trend.
When looking into fire subcategories, the most reports belonged to: Mobile Property/Vehicle Fires (35.4%), and Structure Fires (32.3%).
Fire incident types reported to NFIRS in Zip Code 77048
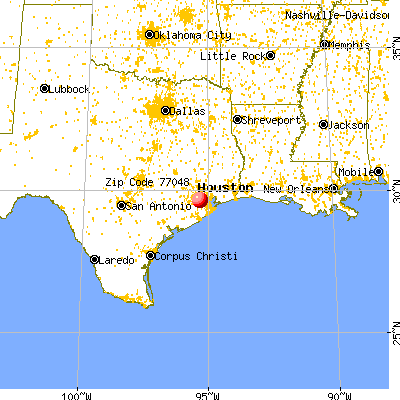


 Nearest zip codes: 77033, 77075, 77061, 77047, 77051, 77087.
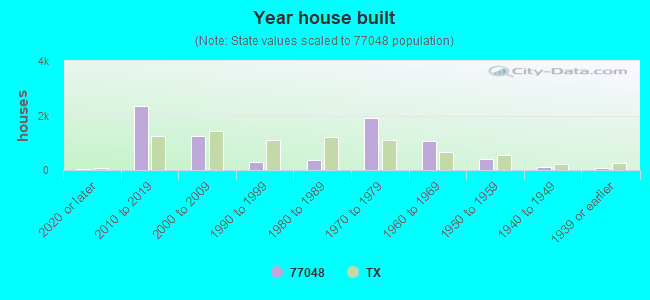


 Based on the data from the years 2002 - 2018 the average number of fire incidents per year is 7. The highest number of fires - 67 took place in 2018, and the least - 0 in 2004. The data has a rising trend.
 When looking into fire subcategories, the most reports belonged to: Mobile Property/Vehicle Fires (35.4%), and Structure Fires (32.3%).