Estimated zip code population in 2022: 4,665 Zip code population in 2010: 3,384 Zip code population in 2000: 3,135
Houses and condos: 1,839 Renter-occupied apartments: 244
% of renters here:
14%
State:
38%
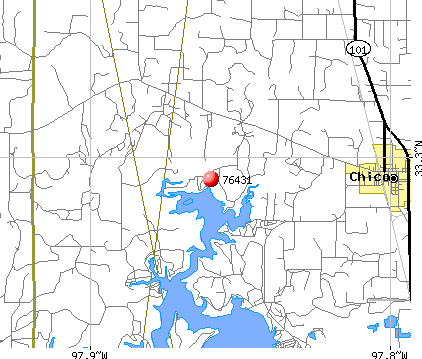
March 2022 cost of living index in zip code 76431: 80.2 (low, U.S. average is 100)
Land area: 118.7 sq. mi. Water area: 1.3 sq. mi.
Population density: 39 people per square mile
(very low).
OSM Map
General Map
Google Map
MSN Map
OSM Map
General Map
Google Map
MSN Map
OSM Map
General Map
Google Map
MSN Map
OSM Map
General Map
Google Map
MSN Map
Please wait while loading the map...
Real estate property taxes paid for housing units in 2022:
This zip code:
1.2% ($2,333)
Texas:
1.5% ($4,050)
Median real estate property taxes paid for housing units with mortgages in 2022: $2,495 (1.0%) Median real estate property taxes paid for housing units with no mortgage in 2022: $2,171 (1.7%)
Averages for the 2020 tax year for zip code 76431, filed in 2021:
Average Adjusted Gross Income (AGI) in 2020: $65,523 (Individual Income Tax Returns)
Here:
$65,523
State:
$77,054
Salary/wage: $54,617 (reported on 82.6% of returns)
Here:
$54,617
State:
$62,766
(% of AGI for various income ranges: 1192.2% for AGIs below $25k, 3606.6% for AGIs $25k-50k, 6575.0% for AGIs $50k-75k, 8914.5% for AGIs $75k-100k, 16735.0% for AGIs $100k-200k, 57380.0% for AGIs over 200k)
Taxable interest for individuals: $849 (reported on 23.4% of returns)
This zip code:
$849
Texas:
$2,665
(% of AGI for various income ranges: 5.4% for AGIs below $25k, 27.4% for AGIs $25k-50k, 21.5% for AGIs $50k-75k, 13.6% for AGIs $75k-100k, 51.4% for AGIs $100k-200k, 415.0% for AGIs over 200k)
Ordinary dividends: $4,211 (reported on 10.8% of returns)
Here:
$4,211
State:
$10,044
(% of AGI for various income ranges: 19.5% for AGIs below $25k, 8.9% for AGIs $25k-50k, 28.5% for AGIs $50k-75k, 246.4% for AGIs $100k-200k, 1225.0% for AGIs over 200k)
Net capital gain/loss in AGI: +$33,279 (reported on 11.4% of returns)
Here:
+$33,279
State:
+$39,590
(% of AGI for various income ranges: 1.2% for AGIs below $25k, 18.0% for AGIs $25k-50k, 50.0% for AGIs $75k-100k, 631.4% for AGIs $100k-200k, 26580.0% for AGIs over 200k)
Profit/loss from business: +$12,289 (reported on 22.8% of returns)
Here:
+$12,289
State:
+$10,888
(% of AGI for various income ranges: 238.0% for AGIs below $25k, 396.3% for AGIs $25k-50k, 227.0% for AGIs $50k-75k, 879.1% for AGIs $75k-100k, 632.9% for AGIs $100k-200k)
Taxable individual retirement arrangement distribution: $26,958 (reported on 7.2% of returns)
76431:
$26,958
Texas:
$24,740
(% of AGI for various income ranges: 46.6% for AGIs below $25k, 58.0% for AGIs $25k-50k, 330.0% for AGIs $50k-75k, 1557.9% for AGIs $100k-200k)
Total itemized deductions: $36,975 (reported on 4.8% of returns)
Here:
$36,975
State:
$40,428
(% of AGI for various income ranges: 449.0% for AGIs $50k-75k, 592.9% for AGIs $100k-200k, 6150.0% for AGIs over 200k)
Charity contributions: $16,160 (reported on 3.0% of returns)
Here:
$16,160
State:
$18,201
(% of AGI for various income ranges: 239.1% for AGIs $75k-100k, 2725.0% for AGIs over 200k)
Taxes paid: $6,700 (reported on 4.8% of returns)
76431:
$6,700
State:
$7,821
(% of AGI for various income ranges: 96.5% for AGIs $50k-75k, 91.4% for AGIs $100k-200k, 1075.0% for AGIs over 200k)
Earned income credit: $2,382 (reported on 20.4% of returns)
Here:
$2,382
State:
$2,584
(% of AGI for various income ranges: 120.2% for AGIs below $25k, 90.6% for AGIs $25k-50k)
Percentage of individuals using paid preparers for their 2020 taxes: 92.2%
Here:
92%
State:
92%
(% for various income ranges: 92.6% for AGIs below $25k, 93.0% for AGIs $25k-50k, 92.3% for AGIs $50k-75k, 93.3% for AGIs $75k-100k, 91.3% for AGIs $100k-200k, 83.3% for AGIs over 200k)
Averages for the 2012 tax year for zip code 76431, filed in 2013:
Average Adjusted Gross Income (AGI) in 2012: $56,529 (Individual Income Tax Returns)
Here:
$56,529
State:
$65,384
Salary/wage: $48,639 (reported on 84.0% of returns)
Here:
$48,639
State:
$52,524
(% of AGI for various income ranges: 72.3% for AGIs below $25k, 82.3% for AGIs $25k-50k, 80.6% for AGIs $50k-75k, 81.5% for AGIs $75k-100k, 78.7% for AGIs $100k-200k, 41.1% for AGIs over 200k)
Taxable interest for individuals: $920 (reported on 27.8% of returns)
This zip code:
$920
Texas:
$2,372
(% of AGI for various income ranges: 0.9% for AGIs below $25k, 0.8% for AGIs $25k-50k, 0.5% for AGIs $50k-75k, 0.1% for AGIs $75k-100k, 0.4% for AGIs $100k-200k, 0.3% for AGIs over 200k)
Ordinary dividends: $1,957 (reported on 9.7% of returns)
Here:
$1,957
State:
$9,721
(% of AGI for various income ranges: 0.5% for AGIs $25k-50k, 0.5% for AGIs $50k-75k, 0.7% for AGIs $100k-200k)
Net capital gain/loss in AGI: +$3,693 (reported on 9.7% of returns)
Here:
+$3,693
State:
+$35,319
(% of AGI for various income ranges: 0.1% for AGIs below $25k, 0.4% for AGIs $25k-50k, 2.6% for AGIs $100k-200k)
Profit/loss from business: +$12,816 (reported on 22.2% of returns)
Here:
+$12,816
State:
+$13,732
(% of AGI for various income ranges: 14.7% for AGIs below $25k, 5.7% for AGIs $25k-50k, 5.4% for AGIs $50k-75k, 2.1% for AGIs $75k-100k, 7.4% for AGIs $100k-200k)
Taxable individual retirement arrangement distribution: $14,092 (reported on 8.3% of returns)
76431:
$14,092
Texas:
$19,511
(% of AGI for various income ranges: 4.7% for AGIs below $25k, 4.5% for AGIs $50k-75k, 3.9% for AGIs $100k-200k)
Total itemized deductions: $24,207 (23% of AGI, reported on 20.1% of returns)
Here:
$24,207
State:
$24,724
Here:
23.2% of AGI
State:
15.9% of AGI
(% of AGI for various income ranges: 5.6% for AGIs below $25k, 6.6% for AGIs $25k-50k, 8.6% for AGIs $50k-75k, 9.1% for AGIs $75k-100k, 9.4% for AGIs $100k-200k, 10.1% for AGIs over 200k)
Charity contributions: $5,775 (reported on 13.9% of returns)
Here:
$5,775
State:
$6,808
(% of AGI for various income ranges: 0.9% for AGIs $25k-50k, 1.3% for AGIs $50k-75k, 1.5% for AGIs $75k-100k, 1.5% for AGIs $100k-200k, 2.3% for AGIs over 200k)
Taxes paid: $4,455 (reported on 20.1% of returns)
76431:
$4,455
State:
$6,921
(% of AGI for various income ranges: 0.8% for AGIs below $25k, 1.1% for AGIs $25k-50k, 1.7% for AGIs $50k-75k, 1.7% for AGIs $75k-100k, 1.9% for AGIs $100k-200k, 1.7% for AGIs over 200k)
Earned income credit: $2,385 (reported on 18.8% of returns)
Here:
$2,385
State:
$2,570
(% of AGI for various income ranges: 7.3% for AGIs below $25k, 1.5% for AGIs $25k-50k)
Percentage of individuals using paid preparers for their 2012 taxes: 67.4%
Here:
67%
State:
51%
(% for various income ranges: 58.8% for AGIs below $25k, 66.7% for AGIs $25k-50k, 72.0% for AGIs $50k-75k, 73.3% for AGIs $75k-100k, 78.6% for AGIs $100k-200k, 100.0% for AGIs over 200k)
Averages for the 2004 tax year for zip code 76431, filed in 2005:
Average Adjusted Gross Income (AGI) in 2004: $37,230 (Individual Income Tax Returns)
Here:
$37,230
State:
$47,881
Salary/wage: $35,044 (reported on 85.5% of returns)
Here:
$35,044
State:
$41,947
(% of AGI for various income ranges: 133.7% for AGIs below $10k, 82.3% for AGIs $10k-25k, 83.2% for AGIs $25k-50k, 85.0% for AGIs $50k-75k, 83.9% for AGIs $75k-100k, 56.9% for AGIs over 100k)
Taxable interest for individuals: $1,632 (reported on 32.4% of returns)
This zip code:
$1,632
Texas:
$2,255
(% of AGI for various income ranges: 9.9% for AGIs below $10k, 2.0% for AGIs $10k-25k, 1.8% for AGIs $25k-50k, 1.0% for AGIs $50k-75k, 0.8% for AGIs $75k-100k, 0.7% for AGIs over 100k)
Taxable dividends: $759 (reported on 11.9% of returns)
Here:
$759
State:
$4,261
(% of AGI for various income ranges: 1.4% for AGIs below $10k, 0.1% for AGIs $10k-25k, 0.4% for AGIs $25k-50k, 0.1% for AGIs $50k-75k, 0.2% for AGIs $75k-100k, 0.2% for AGIs over 100k)
Net capital gain/loss: +$4,373 (reported on 11.5% of returns)
Here:
+$4,373
State:
+$16,110
(% of AGI for various income ranges: 0.2% for AGIs below $10k, 0.6% for AGIs $10k-25k, 0.7% for AGIs $25k-50k, 1.6% for AGIs $50k-75k, 0.7% for AGIs $75k-100k, 3.4% for AGIs over 100k)
Profit/loss from business: +$8,763 (reported on 21.5% of returns)
Here:
+$8,763
State:
+$11,013
(% of AGI for various income ranges: 3.8% for AGIs below $10k, 7.3% for AGIs $10k-25k, 5.6% for AGIs $25k-50k, 2.9% for AGIs $50k-75k, 4.6% for AGIs $75k-100k, 6.9% for AGIs over 100k)
IRA payment deduction: $2,895 (reported on 1.4% of returns)
76431:
$2,895
Texas:
$3,120
Total itemized deductions: $16,147 (27% of AGI, reported on 18.6% of returns)
Here:
$16,147
State:
$19,631
Here:
26.8% of AGI
State:
18.9% of AGI
(% of AGI for various income ranges: 20.2% for AGIs below $10k, 7.9% for AGIs $10k-25k, 7.3% for AGIs $25k-50k, 7.0% for AGIs $50k-75k, 9.0% for AGIs $75k-100k, 8.7% for AGIs over 100k)
Charity contributions deductions: $3,209 (5% of AGI, reported on 12.3% of returns)
Here:
$3,209
State:
$4,753
Here:
5.2% of AGI
State:
4.2% of AGI
(% of AGI for various income ranges: 1.5% for AGIs below $10k, 0.7% for AGIs $10k-25k, 0.9% for AGIs $25k-50k, 1.0% for AGIs $50k-75k, 1.5% for AGIs $75k-100k, 1.2% for AGIs over 100k)
Total tax: $4,745 (reported on 74.3% of returns)
76431:
$4,745
State:
$9,058
(% of AGI for various income ranges: 4.0% for AGIs below $10k, 4.1% for AGIs $10k-25k, 6.4% for AGIs $25k-50k, 8.7% for AGIs $50k-75k, 11.0% for AGIs $75k-100k, 19.0% for AGIs over 100k)
Earned income credit: $1,853 (reported on 19.6% of returns)
Here:
$1,853
State:
$2,024
Percentage of individuals using paid preparers for their 2004 taxes: 70.6%
Here:
71%
State:
57%
(% for various income ranges: 61.8% for AGIs below $10k, 68.5% for AGIs $10k-25k, 72.8% for AGIs $25k-50k, 76.5% for AGIs $50k-75k, 80.2% for AGIs $75k-100k, 72.0% for AGIs over 100k)
Likely homosexual households (counted as self-reported same-sex unmarried-partner households)
Lesbian couples: 0.1% of all households
Gay men: 0.0% of all households
Household received Food Stamps/SNAP in the past 12 months: 121 Household did not receive Food Stamps/SNAP in the past 12 months: 1,575
Women who had a birth in the past 12 months: 47 (8 now married, 37 unmarried) Women who did not have a birth in the past 12 months: 849 (565 now married, 278 unmarried)
Housing units in zip code 76431 with a mortgage: 599 Median monthly owner costs for units with a mortgage: $1,569 Median monthly owner costs for units without a mortgage: $546
Residents with income below the poverty level in 2022:
This zip code:
19.9%
Whole state:
14.0%
Residents with income below 50% of the poverty level in 2022:
This zip code:
13.6%
Whole state:
7.4%
Median number of rooms in houses and condos:
Here:
5.5
State:
6.3
Median number of rooms in apartments:
Here:
5.8
State:
4.0
Notable locations in this zip code not listed on our city pages
Notable locations in zip code 76431: J T Brown Hotel (A), Chico Community Volunteer Fire Department (B), Wise County Sand Flat Volunteer Fire Department (C), Crafton Volunteer Fire Department (D). Display/hide their locations on the map
Churches in zip code 76431 include: Zion Valley Cumberland Church (A), Central Baptist Church (B), Lone Star Church (C), Red Bud Church (D). Display/hide their locations on the map
Cemeteries: Morrow Cemetery (1), Crafton Cemetery (2), Cumber Cemetery (3), Green Elm Cemetery (4), Thomas-Norwood Cemetery (5), Pleasant Grove Cemetery (6), Olive Branch Cemetery (7). Display/hide their locations on the map
Size of family households: 481 2-persons, 173 3-persons, 239 4-persons, 190 5-persons, 108 6-persons, 32 7-or-more-persons
Size of nonfamily households: 438 1-person, 28 2-persons
575 married couples with children.
394 single-parent households (50 men, 344 women).
87.3% of residents of 76431 zip code speak English at home.
10.8% of residents speak Spanish at home (67% very well, 33% well).
2.3% of residents speak other Indo-European language at home (50% very well, 25% well, 25% not at all).
Foreign born population: 424 (9.1%) (26.2% of them are naturalized citizens)
This zip code:
9.1%
Whole state:
17.2%
75%Honduras
10%Bhutan
2%Austria
0%Guyana
15%English
12%German
12%Irish
6%American
4%Danish
1%Czech
1%Scotch-Irish
Year of entry for the foreign-born population
692010 or later
3042000 to 2009
191990 to 1999
33Before 1990
Housing units lacking complete plumbing facilities: 3.1% Housing units lacking complete kitchen facilities: 3.8%
58.3%Electricity
29.9%Bottled, tank, or LP gas
9.0%Utility gas
2.9%Wood
Population in 1990: 2,657. Population change in the 1990s: +478 (+18.0%).
Place of birth for U.S.-born residents:
This state: 3,345
Northeast: 124
Midwest: 138
South: 187
West: 416
58% of the 76431 zip code residents lived in the same house 5 years ago. Out of people who lived in different houses, 47% lived in this county. Out of people who lived in different counties, 50% lived in Texas.
95% of the 76431 zip code residents lived in the same house 1 year ago. Out of people who lived in different houses, 30% moved from this county. Out of people who lived in different houses, 52% moved from different county within same state. Out of people who lived in different houses, 17% moved from different state. Out of people who lived in different houses, 7% moved from abroad.
Private vs. public school enrollment:
Students in private schools in grades 1 to 8 (elementary and middle school): 73
Here:
10.1%
Texas:
8.8%
Students in private schools in grades 9 to 12 (high school): 10
Here:
7.7%
Texas:
8.0%
Students in private undergraduate colleges:
Here:
0.0%
Texas:
16.2%
Occupation by median earnings in the past 12 months ($)
138,641Architecture and engineering occupations
101,177Installation, maintenance, and repair occupations
77,210Health technologists and technicians
76,820Business and financial operations occupations
72,215Management occupations
47,501Education, training, and library occupations
Top industries in this zip code by the number of employees in 2005:
Mining: Crushed and Broken Limestone Mining and Quarrying (100-249 employees: 1 establishment)
Mining: Natural Gas Liquid Extraction (50-99: 1)
Mining: Support Activities for Oil and Gas Operations (50-99: 1)
Mining: Crushed and Broken Granite Mining and Quarrying (50-99: 1)
Other Services (except Public Administration): Religious Organizations (5-9: 2, 1-4: 2)
Fatal accident statistics in 2014:
Fatal accident count: 3
Vehicles involved in fatal accidents: 5
Fatal accidents caused by drunken drivers: 1
Fatalities: 3
Persons involved in fatal accidents: 6
Pedestrians involved in fatal accidents: 0
Fatal accident statistics in 2013:
Fatal accident count: 1
Vehicles involved in fatal accidents: 1
Fatal accidents caused by drunken drivers: 0
Fatalities: 1
Persons involved in fatal accidents: 1
Pedestrians involved in fatal accidents: 0
Home Mortgage Disclosure Act Aggregated Statistics For Year 2009 (Based on 2 partial tracts)
A) FHA, FSA/RHS & VA Home Purchase Loans
B) Conventional Home Purchase Loans
C) Refinancings
D) Home Improvement Loans
F) Non-occupant Loans on < 5 Family Dwellings (A B C & D)
G) Loans On Manufactured Home Dwelling (A B C & D)
Number
Average Value
Number
Average Value
Number
Average Value
Number
Average Value
Number
Average Value
Number
Average Value
LOANS ORIGINATED
5
$143,432
26
$142,637
71
$196,019
8
$29,110
28
$173,304
8
$77,586
APPLICATIONS APPROVED, NOT ACCEPTED
1
$128,620
1
$145,190
1
$93,540
4
$65,040
0
$0
0
$0
APPLICATIONS DENIED
4
$218,022
5
$116,538
24
$177,462
6
$15,428
3
$192,930
4
$28,258
APPLICATIONS WITHDRAWN
1
$263,090
0
$0
17
$206,286
4
$120,338
1
$48,720
2
$32,640
FILES CLOSED FOR INCOMPLETENESS
0
$0
1
$87,700
5
$159,216
4
$31,668
0
$0
2
$46,285
Aggregated Statistics For Year 2008 (Based on 2 partial tracts)
A) FHA, FSA/RHS & VA Home Purchase Loans
B) Conventional Home Purchase Loans
C) Refinancings
D) Home Improvement Loans
E) Loans on Dwellings For 5+ Families
F) Non-occupant Loans on < 5 Family Dwellings (A B C & D)
G) Loans On Manufactured Home Dwelling (A B C & D)
Number
Average Value
Number
Average Value
Number
Average Value
Number
Average Value
Number
Average Value
Number
Average Value
Number
Average Value
LOANS ORIGINATED
10
$106,502
56
$164,882
45
$155,038
14
$45,309
1
$341,040
36
$172,956
14
$67,929
APPLICATIONS APPROVED, NOT ACCEPTED
1
$91,590
6
$88,995
9
$129,920
4
$19,488
0
$0
2
$76,980
5
$59,438
APPLICATIONS DENIED
1
$132,520
12
$137,472
23
$140,907
15
$45,862
0
$0
5
$155,904
9
$62,253
APPLICATIONS WITHDRAWN
0
$0
5
$197,998
17
$118,475
3
$47,097
0
$0
2
$122,285
3
$71,780
FILES CLOSED FOR INCOMPLETENESS
0
$0
2
$134,465
6
$144,212
0
$0
0
$0
1
$206,570
2
$41,410
Aggregated Statistics For Year 2007 (Based on 2 partial tracts)
A) FHA, FSA/RHS & VA Home Purchase Loans
B) Conventional Home Purchase Loans
C) Refinancings
D) Home Improvement Loans
F) Non-occupant Loans on < 5 Family Dwellings (A B C & D)
G) Loans On Manufactured Home Dwelling (A B C & D)
Number
Average Value
Number
Average Value
Number
Average Value
Number
Average Value
Number
Average Value
Number
Average Value
LOANS ORIGINATED
5
$129,790
47
$130,881
53
$148,219
12
$26,958
26
$144,961
15
$58,789
APPLICATIONS APPROVED, NOT ACCEPTED
1
$91,590
7
$158,270
11
$169,368
5
$48,526
4
$218,510
4
$49,695
APPLICATIONS DENIED
1
$91,590
24
$74,542
42
$138,434
21
$38,234
13
$114,379
10
$54,956
APPLICATIONS WITHDRAWN
1
$144,210
4
$64,310
19
$120,467
1
$19,490
2
$104,260
1
$144,210
FILES CLOSED FOR INCOMPLETENESS
0
$0
1
$16,560
8
$123,870
2
$21,925
3
$139,990
1
$19,490
Aggregated Statistics For Year 2006 (Based on 2 partial tracts)
A) FHA, FSA/RHS & VA Home Purchase Loans
B) Conventional Home Purchase Loans
C) Refinancings
D) Home Improvement Loans
F) Non-occupant Loans on < 5 Family Dwellings (A B C & D)
G) Loans On Manufactured Home Dwelling (A B C & D)
Number
Average Value
Number
Average Value
Number
Average Value
Number
Average Value
Number
Average Value
Number
Average Value
LOANS ORIGINATED
15
$113,615
81
$114,281
54
$129,956
17
$27,455
30
$142,977
15
$60,867
APPLICATIONS APPROVED, NOT ACCEPTED
1
$99,390
4
$111,082
14
$116,301
4
$16,565
1
$124,720
1
$76,000
APPLICATIONS DENIED
4
$77,708
36
$76,084
32
$99,237
20
$33,081
6
$71,293
14
$63,197
APPLICATIONS WITHDRAWN
1
$145,190
12
$119,607
27
$118,119
2
$48,720
0
$0
1
$61,390
FILES CLOSED FOR INCOMPLETENESS
0
$0
3
$117,903
12
$103,773
1
$41,900
0
$0
0
$0
Aggregated Statistics For Year 2005 (Based on 2 partial tracts)
A) FHA, FSA/RHS & VA Home Purchase Loans
B) Conventional Home Purchase Loans
C) Refinancings
D) Home Improvement Loans
F) Non-occupant Loans on < 5 Family Dwellings (A B C & D)
G) Loans On Manufactured Home Dwelling (A B C & D)
Number
Average Value
Number
Average Value
Number
Average Value
Number
Average Value
Number
Average Value
Number
Average Value
LOANS ORIGINATED
5
$104,456
69
$123,833
63
$154,651
16
$34,409
32
$142,689
18
$47,367
APPLICATIONS APPROVED, NOT ACCEPTED
1
$35,080
14
$128,273
16
$102,738
2
$37,025
5
$155,514
6
$43,360
APPLICATIONS DENIED
4
$111,082
28
$98,310
57
$106,705
12
$51,643
11
$127,204
14
$43,848
APPLICATIONS WITHDRAWN
2
$74,055
8
$175,879
41
$100,720
9
$118,443
4
$173,688
3
$73,730
FILES CLOSED FOR INCOMPLETENESS
0
$0
2
$91,105
13
$130,420
2
$66,260
0
$0
1
$77,950
Aggregated Statistics For Year 2004 (Based on 2 partial tracts)
A) FHA, FSA/RHS & VA Home Purchase Loans
B) Conventional Home Purchase Loans
C) Refinancings
D) Home Improvement Loans
F) Non-occupant Loans on < 5 Family Dwellings (A B C & D)
G) Loans On Manufactured Home Dwelling (A B C & D)
Detailed PMIC statistics for the following Tracts:1504.01
2002 - 2018 National Fire Incident Reporting System (NFIRS) incidents
Based on the data from the years 2002 - 2018 the average number of fires per year is 42. The highest number of fire incidents - 103 took place in 2018, and the least - 0 in 2003. The data has a growing trend.
When looking into fire subcategories, the most reports belonged to: Outside Fires (67.9%), and Structure Fires (18.0%).
Fire incident types reported to NFIRS in Zip Code 76431


 Nearest zip codes: 76426, 76270, 76225, 76230, 76073, 76458.


 Based on the data from the years 2002 - 2018 the average number of fires per year is 42. The highest number of fire incidents - 103 took place in 2018, and the least - 0 in 2003. The data has a growing trend.
 When looking into fire subcategories, the most reports belonged to: Outside Fires (67.9%), and Structure Fires (18.0%).