Estimated zip code population in 2022: 36,819
Zip code population in 2010: 33,604
Zip code population in 2000: 31,308
Houses and condos: 15,723
Renter-occupied apartments: 3,980
% of renters here:
26%State:
29%
March 2022 cost of living index in zip code 46835: 83.7
(less than average, U.S. average is 100)
Land area: 21.2
sq. mi.
Water area: 0.0
sq. mi.
Population density: 1,739 people per square mile (low).
OSM Map
General Map
Google Map
MSN Map
OSM Map
General Map
Google Map
MSN Map
OSM Map
General Map
Google Map
MSN Map
OSM Map
General Map
Google Map
MSN Map
Please wait while loading the map...
Real estate property taxes paid for housing units in 2022:
This zip code:
0.8% ($1,601)Indiana:
0.7% ($1,467)
Median real estate property taxes paid for housing units with mortgages in 2022: $1,614 (0.8%)
Median real estate property taxes paid for housing units with no mortgage in 2022: $1,616 (0.9%)
Profiles of local businesses
Business Search - 14 Million verified businesses
Males: 17,781 Females: 19,036
For population 25 years and over in 46835:
High school or higher: 95.9%Bachelor's degree or higher: 35.3%Graduate or professional degree: 12.2%Unemployed: 2.3%Mean travel time to work (commute): 22.3 minutes
For population 15 years and over in 46835:
Never married: 31.3%Now married: 51.8%Separated: 1.1%Widowed: 5.9%Divorced: 10.0%
Zip code 46835 compared to state average:
Median age below state average. Length of stay since moving in above state average. House age below state average. 28,811 78.3% White 2,622 7.1% Hispanic or Latino 2,406 6.5% Black 1,572 4.3% Two or more races 1,261 3.4% Asian 124 0.3% Some other race 11 0.03% American Indian 9 0.02% Native Hawaiian and Other
Data:
Median household income ($)
Median household income (% change since 2000)
Household income diversity
Ratio of average income to average house value (%)
Ratio of average income to average rent
Median household income ($) - White
Median household income ($) - Black or African American
Median household income ($) - Asian
Median household income ($) - Hispanic or Latino
Median household income ($) - American Indian and Alaska Native
Median household income ($) - Multirace
Median household income ($) - Other Race
Median household income for houses/condos with a mortgage ($)
Median household income for apartments without a mortgage ($)
Races - White alone (%)
Races - White alone (% change since 2000)
Races - Black alone (%)
Races - Black alone (% change since 2000)
Races - American Indian alone (%)
Races - American Indian alone (% change since 2000)
Races - Asian alone (%)
Races - Asian alone (% change since 2000)
Races - Hispanic (%)
Races - Hispanic (% change since 2000)
Races - Native Hawaiian and Other Pacific Islander alone (%)
Races - Native Hawaiian and Other Pacific Islander alone (% change since 2000)
Races - Two or more races (%)
Races - Two or more races (% change since 2000)
Races - Other race alone (%)
Races - Other race alone (% change since 2000)
Racial diversity
Unemployment (%)
Unemployment (% change since 2000)
Unemployment (%) - White
Unemployment (%) - Black or African American
Unemployment (%) - Asian
Unemployment (%) - Hispanic or Latino
Unemployment (%) - American Indian and Alaska Native
Unemployment (%) - Multirace
Unemployment (%) - Other Race
Population density (people per square mile)
Population - Males (%)
Population - Females (%)
Population - Males (%) - White
Population - Males (%) - Black or African American
Population - Males (%) - Asian
Population - Males (%) - Hispanic or Latino
Population - Males (%) - American Indian and Alaska Native
Population - Males (%) - Multirace
Population - Males (%) - Other Race
Population - Females (%) - White
Population - Females (%) - Black or African American
Population - Females (%) - Asian
Population - Females (%) - Hispanic or Latino
Population - Females (%) - American Indian and Alaska Native
Population - Females (%) - Multirace
Population - Females (%) - Other Race
Coronavirus confirmed cases (Jun 07, 2024)
Deaths caused by coronavirus (Jun 07, 2024)
Coronavirus confirmed cases (per 100k population) (Jun 07, 2024)
Deaths caused by coronavirus (per 100k population) (Jun 07, 2024)
Daily increase in number of cases (Jun 07, 2024)
Weekly increase in number of cases (Jun 07, 2024)
Cases doubled (in days) (Jun 07, 2024)
Hospitalized patients (Apr 18, 2022)
Negative test results (Apr 18, 2022)
Total test results (Apr 18, 2022)
COVID Vaccine doses distributed (per 100k population) (Sep 19, 2023)
COVID Vaccine doses administered (per 100k population) (Sep 19, 2023)
COVID Vaccine doses distributed (Sep 19, 2023)
COVID Vaccine doses administered (Sep 19, 2023)
Likely homosexual households (%)
Likely homosexual households (% change since 2000)
Likely homosexual households - Lesbian couples (%)
Likely homosexual households - Lesbian couples (% change since 2000)
Likely homosexual households - Gay men (%)
Likely homosexual households - Gay men (% change since 2000)
Cost of living index
Median gross rent ($)
Median contract rent ($)
Median monthly housing costs ($)
Median house or condo value ($)
Median house or condo value ($ change since 2000)
Mean house or condo value by units in structure - 1, detached ($)
Mean house or condo value by units in structure - 1, attached ($)
Mean house or condo value by units in structure - 2 ($)
Mean house or condo value by units in structure by units in structure - 3 or 4 ($)
Mean house or condo value by units in structure - 5 or more ($)
Mean house or condo value by units in structure - Boat, RV, van, etc. ($)
Mean house or condo value by units in structure - Mobile home ($)
Median house or condo value ($) - White
Median house or condo value ($) - Black or African American
Median house or condo value ($) - Asian
Median house or condo value ($) - Hispanic or Latino
Median house or condo value ($) - American Indian and Alaska Native
Median house or condo value ($) - Multirace
Median house or condo value ($) - Other Race
Median resident age
Resident age diversity
Median resident age - Males
Median resident age - Females
Median resident age - White
Median resident age - Black or African American
Median resident age - Asian
Median resident age - Hispanic or Latino
Median resident age - American Indian and Alaska Native
Median resident age - Multirace
Median resident age - Other Race
Median resident age - Males - White
Median resident age - Males - Black or African American
Median resident age - Males - Asian
Median resident age - Males - Hispanic or Latino
Median resident age - Males - American Indian and Alaska Native
Median resident age - Males - Multirace
Median resident age - Males - Other Race
Median resident age - Females - White
Median resident age - Females - Black or African American
Median resident age - Females - Asian
Median resident age - Females - Hispanic or Latino
Median resident age - Females - American Indian and Alaska Native
Median resident age - Females - Multirace
Median resident age - Females - Other Race
Commute - mean travel time to work (minutes)
Travel time to work - Less than 5 minutes (%)
Travel time to work - Less than 5 minutes (% change since 2000)
Travel time to work - 5 to 9 minutes (%)
Travel time to work - 5 to 9 minutes (% change since 2000)
Travel time to work - 10 to 19 minutes (%)
Travel time to work - 10 to 19 minutes (% change since 2000)
Travel time to work - 20 to 29 minutes (%)
Travel time to work - 20 to 29 minutes (% change since 2000)
Travel time to work - 30 to 39 minutes (%)
Travel time to work - 30 to 39 minutes (% change since 2000)
Travel time to work - 40 to 59 minutes (%)
Travel time to work - 40 to 59 minutes (% change since 2000)
Travel time to work - 60 to 89 minutes (%)
Travel time to work - 60 to 89 minutes (% change since 2000)
Travel time to work - 90 or more minutes (%)
Travel time to work - 90 or more minutes (% change since 2000)
Marital status - Never married (%)
Marital status - Now married (%)
Marital status - Separated (%)
Marital status - Widowed (%)
Marital status - Divorced (%)
Median family income ($)
Median family income (% change since 2000)
Median non-family income ($)
Median non-family income (% change since 2000)
Median per capita income ($)
Median per capita income (% change since 2000)
Median family income ($) - White
Median family income ($) - Black or African American
Median family income ($) - Asian
Median family income ($) - Hispanic or Latino
Median family income ($) - American Indian and Alaska Native
Median family income ($) - Multirace
Median family income ($) - Other Race
Median year house/condo built
Median year apartment built
Year house built - Built 2005 or later (%)
Year house built - Built 2000 to 2004 (%)
Year house built - Built 1990 to 1999 (%)
Year house built - Built 1980 to 1989 (%)
Year house built - Built 1970 to 1979 (%)
Year house built - Built 1960 to 1969 (%)
Year house built - Built 1950 to 1959 (%)
Year house built - Built 1940 to 1949 (%)
Year house built - Built 1939 or earlier (%)
Average household size
Household density (households per square mile)
Average household size - White
Average household size - Black or African American
Average household size - Asian
Average household size - Hispanic or Latino
Average household size - American Indian and Alaska Native
Average household size - Multirace
Average household size - Other Race
Occupied housing units (%)
Vacant housing units (%)
Owner occupied housing units (%)
Renter occupied housing units (%)
Vacancy status - For rent (%)
Vacancy status - For sale only (%)
Vacancy status - Rented or sold, not occupied (%)
Vacancy status - For seasonal, recreational, or occasional use (%)
Vacancy status - For migrant workers (%)
Vacancy status - Other vacant (%)
Residents with income below the poverty level (%)
Residents with income below 50% of the poverty level (%)
Children below poverty level (%)
Poor families by family type - Married-couple family (%)
Poor families by family type - Male, no wife present (%)
Poor families by family type - Female, no husband present (%)
Poverty status for native-born residents (%)
Poverty status for foreign-born residents (%)
Poverty among high school graduates not in families (%)
Poverty among people who did not graduate high school not in families (%)
Residents with income below the poverty level (%) - White
Residents with income below the poverty level (%) - Black or African American
Residents with income below the poverty level (%) - Asian
Residents with income below the poverty level (%) - Hispanic or Latino
Residents with income below the poverty level (%) - American Indian and Alaska Native
Residents with income below the poverty level (%) - Multirace
Residents with income below the poverty level (%) - Other Race
Air pollution - Air Quality Index (AQI)
Air pollution - CO
Air pollution - NO2
Air pollution - SO2
Air pollution - Ozone
Air pollution - PM10
Air pollution - PM25
Air pollution - Pb
Crime - Murders per 100,000 population
Crime - Rapes per 100,000 population
Crime - Robberies per 100,000 population
Crime - Assaults per 100,000 population
Crime - Burglaries per 100,000 population
Crime - Thefts per 100,000 population
Crime - Auto thefts per 100,000 population
Crime - Arson per 100,000 population
Crime - City-data.com crime index
Crime - Violent crime index
Crime - Property crime index
Crime - Murders per 100,000 population (5 year average)
Crime - Rapes per 100,000 population (5 year average)
Crime - Robberies per 100,000 population (5 year average)
Crime - Assaults per 100,000 population (5 year average)
Crime - Burglaries per 100,000 population (5 year average)
Crime - Thefts per 100,000 population (5 year average)
Crime - Auto thefts per 100,000 population (5 year average)
Crime - Arson per 100,000 population (5 year average)
Crime - City-data.com crime index (5 year average)
Crime - Violent crime index (5 year average)
Crime - Property crime index (5 year average)
1996 Presidential Elections Results (%) - Democratic Party (Clinton)
1996 Presidential Elections Results (%) - Republican Party (Dole)
1996 Presidential Elections Results (%) - Other
2000 Presidential Elections Results (%) - Democratic Party (Gore)
2000 Presidential Elections Results (%) - Republican Party (Bush)
2000 Presidential Elections Results (%) - Other
2004 Presidential Elections Results (%) - Democratic Party (Kerry)
2004 Presidential Elections Results (%) - Republican Party (Bush)
2004 Presidential Elections Results (%) - Other
2008 Presidential Elections Results (%) - Democratic Party (Obama)
2008 Presidential Elections Results (%) - Republican Party (McCain)
2008 Presidential Elections Results (%) - Other
2012 Presidential Elections Results (%) - Democratic Party (Obama)
2012 Presidential Elections Results (%) - Republican Party (Romney)
2012 Presidential Elections Results (%) - Other
2016 Presidential Elections Results (%) - Democratic Party (Clinton)
2016 Presidential Elections Results (%) - Republican Party (Trump)
2016 Presidential Elections Results (%) - Other
2020 Presidential Elections Results (%) - Democratic Party (Biden)
2020 Presidential Elections Results (%) - Republican Party (Trump)
2020 Presidential Elections Results (%) - Other
Ancestries Reported - Arab (%)
Ancestries Reported - Czech (%)
Ancestries Reported - Danish (%)
Ancestries Reported - Dutch (%)
Ancestries Reported - English (%)
Ancestries Reported - French (%)
Ancestries Reported - French Canadian (%)
Ancestries Reported - German (%)
Ancestries Reported - Greek (%)
Ancestries Reported - Hungarian (%)
Ancestries Reported - Irish (%)
Ancestries Reported - Italian (%)
Ancestries Reported - Lithuanian (%)
Ancestries Reported - Norwegian (%)
Ancestries Reported - Polish (%)
Ancestries Reported - Portuguese (%)
Ancestries Reported - Russian (%)
Ancestries Reported - Scotch-Irish (%)
Ancestries Reported - Scottish (%)
Ancestries Reported - Slovak (%)
Ancestries Reported - Subsaharan African (%)
Ancestries Reported - Swedish (%)
Ancestries Reported - Swiss (%)
Ancestries Reported - Ukrainian (%)
Ancestries Reported - United States (%)
Ancestries Reported - Welsh (%)
Ancestries Reported - West Indian (%)
Ancestries Reported - Other (%)
Educational Attainment - No schooling completed (%)
Educational Attainment - Less than high school (%)
Educational Attainment - High school or equivalent (%)
Educational Attainment - Less than 1 year of college (%)
Educational Attainment - 1 or more years of college (%)
Educational Attainment - Associate degree (%)
Educational Attainment - Bachelor's degree (%)
Educational Attainment - Master's degree (%)
Educational Attainment - Professional school degree (%)
Educational Attainment - Doctorate degree (%)
School Enrollment - Nursery, preschool (%)
School Enrollment - Kindergarten (%)
School Enrollment - Grade 1 to 4 (%)
School Enrollment - Grade 5 to 8 (%)
School Enrollment - Grade 9 to 12 (%)
School Enrollment - College undergrad (%)
School Enrollment - Graduate or professional (%)
School Enrollment - Not enrolled in school (%)
School enrollment - Public schools (%)
School enrollment - Private schools (%)
School enrollment - Not enrolled (%)
Median number of rooms in houses and condos
Median number of rooms in apartments
Housing units lacking complete plumbing facilities (%)
Housing units lacking complete kitchen facilities (%)
Density of houses
Urban houses (%)
Rural houses (%)
Households with people 60 years and over (%)
Households with people 65 years and over (%)
Households with people 75 years and over (%)
Households with one or more nonrelatives (%)
Households with no nonrelatives (%)
Population in households (%)
Family households (%)
Nonfamily households (%)
Population in families (%)
Family households with own children (%)
Median number of bedrooms in owner occupied houses
Mean number of bedrooms in owner occupied houses
Median number of bedrooms in renter occupied houses
Mean number of bedrooms in renter occupied houses
Median number of vehichles in owner occupied houses
Mean number of vehichles in owner occupied houses
Median number of vehichles in renter occupied houses
Mean number of vehichles in renter occupied houses
Mortgage status - with mortgage (%)
Mortgage status - with second mortgage (%)
Mortgage status - with home equity loan (%)
Mortgage status - with both second mortgage and home equity loan (%)
Mortgage status - without a mortgage (%)
Average family size
Average family size - White
Average family size - Black or African American
Average family size - Asian
Average family size - Hispanic or Latino
Average family size - American Indian and Alaska Native
Average family size - Multirace
Average family size - Other Race
Geographical mobility - Same house 1 year ago (%)
Geographical mobility - Moved within same county (%)
Geographical mobility - Moved from different county within same state (%)
Geographical mobility - Moved from different state (%)
Geographical mobility - Moved from abroad (%)
Place of birth - Born in state of residence (%)
Place of birth - Born in other state (%)
Place of birth - Native, outside of US (%)
Place of birth - Foreign born (%)
Housing units in structures - 1, detached (%)
Housing units in structures - 1, attached (%)
Housing units in structures - 2 (%)
Housing units in structures - 3 or 4 (%)
Housing units in structures - 5 to 9 (%)
Housing units in structures - 10 to 19 (%)
Housing units in structures - 20 to 49 (%)
Housing units in structures - 50 or more (%)
Housing units in structures - Mobile home (%)
Housing units in structures - Boat, RV, van, etc. (%)
House/condo owner moved in on average (years ago)
Renter moved in on average (years ago)
Year householder moved into unit - Moved in 1999 to March 2000 (%)
Year householder moved into unit - Moved in 1995 to 1998 (%)
Year householder moved into unit - Moved in 1990 to 1994 (%)
Year householder moved into unit - Moved in 1980 to 1989 (%)
Year householder moved into unit - Moved in 1970 to 1979 (%)
Year householder moved into unit - Moved in 1969 or earlier (%)
Means of transportation to work - Drove car alone (%)
Means of transportation to work - Carpooled (%)
Means of transportation to work - Public transportation (%)
Means of transportation to work - Bus or trolley bus (%)
Means of transportation to work - Streetcar or trolley car (%)
Means of transportation to work - Subway or elevated (%)
Means of transportation to work - Railroad (%)
Means of transportation to work - Ferryboat (%)
Means of transportation to work - Taxicab (%)
Means of transportation to work - Motorcycle (%)
Means of transportation to work - Bicycle (%)
Means of transportation to work - Walked (%)
Means of transportation to work - Other means (%)
Working at home (%)
Industry diversity
Most Common Industries - Agriculture, forestry, fishing and hunting, and mining (%)
Most Common Industries - Agriculture, forestry, fishing and hunting (%)
Most Common Industries - Mining, quarrying, and oil and gas extraction (%)
Most Common Industries - Construction (%)
Most Common Industries - Manufacturing (%)
Most Common Industries - Wholesale trade (%)
Most Common Industries - Retail trade (%)
Most Common Industries - Transportation and warehousing, and utilities (%)
Most Common Industries - Transportation and warehousing (%)
Most Common Industries - Utilities (%)
Most Common Industries - Information (%)
Most Common Industries - Finance and insurance, and real estate and rental and leasing (%)
Most Common Industries - Finance and insurance (%)
Most Common Industries - Real estate and rental and leasing (%)
Most Common Industries - Professional, scientific, and management, and administrative and waste management services (%)
Most Common Industries - Professional, scientific, and technical services (%)
Most Common Industries - Management of companies and enterprises (%)
Most Common Industries - Administrative and support and waste management services (%)
Most Common Industries - Educational services, and health care and social assistance (%)
Most Common Industries - Educational services (%)
Most Common Industries - Health care and social assistance (%)
Most Common Industries - Arts, entertainment, and recreation, and accommodation and food services (%)
Most Common Industries - Arts, entertainment, and recreation (%)
Most Common Industries - Accommodation and food services (%)
Most Common Industries - Other services, except public administration (%)
Most Common Industries - Public administration (%)
Occupation diversity
Most Common Occupations - Management, business, science, and arts occupations (%)
Most Common Occupations - Management, business, and financial occupations (%)
Most Common Occupations - Management occupations (%)
Most Common Occupations - Business and financial operations occupations (%)
Most Common Occupations - Computer, engineering, and science occupations (%)
Most Common Occupations - Computer and mathematical occupations (%)
Most Common Occupations - Architecture and engineering occupations (%)
Most Common Occupations - Life, physical, and social science occupations (%)
Most Common Occupations - Education, legal, community service, arts, and media occupations (%)
Most Common Occupations - Community and social service occupations (%)
Most Common Occupations - Legal occupations (%)
Most Common Occupations - Education, training, and library occupations (%)
Most Common Occupations - Arts, design, entertainment, sports, and media occupations (%)
Most Common Occupations - Healthcare practitioners and technical occupations (%)
Most Common Occupations - Health diagnosing and treating practitioners and other technical occupations (%)
Most Common Occupations - Health technologists and technicians (%)
Most Common Occupations - Service occupations (%)
Most Common Occupations - Healthcare support occupations (%)
Most Common Occupations - Protective service occupations (%)
Most Common Occupations - Fire fighting and prevention, and other protective service workers including supervisors (%)
Most Common Occupations - Law enforcement workers including supervisors (%)
Most Common Occupations - Food preparation and serving related occupations (%)
Most Common Occupations - Building and grounds cleaning and maintenance occupations (%)
Most Common Occupations - Personal care and service occupations (%)
Most Common Occupations - Sales and office occupations (%)
Most Common Occupations - Sales and related occupations (%)
Most Common Occupations - Office and administrative support occupations (%)
Most Common Occupations - Natural resources, construction, and maintenance occupations (%)
Most Common Occupations - Farming, fishing, and forestry occupations (%)
Most Common Occupations - Construction and extraction occupations (%)
Most Common Occupations - Installation, maintenance, and repair occupations (%)
Most Common Occupations - Production, transportation, and material moving occupations (%)
Most Common Occupations - Production occupations (%)
Most Common Occupations - Transportation occupations (%)
Most Common Occupations - Material moving occupations (%)
People in Group quarters - Institutionalized population (%)
People in Group quarters - Correctional institutions (%)
People in Group quarters - Federal prisons and detention centers (%)
People in Group quarters - Halfway houses (%)
People in Group quarters - Local jails and other confinement facilities (including police lockups) (%)
People in Group quarters - Military disciplinary barracks (%)
People in Group quarters - State prisons (%)
People in Group quarters - Other types of correctional institutions (%)
People in Group quarters - Nursing homes (%)
People in Group quarters - Hospitals/wards, hospices, and schools for the handicapped (%)
People in Group quarters - Hospitals/wards and hospices for chronically ill (%)
People in Group quarters - Hospices or homes for chronically ill (%)
People in Group quarters - Military hospitals or wards for chronically ill (%)
People in Group quarters - Other hospitals or wards for chronically ill (%)
People in Group quarters - Hospitals or wards for drug/alcohol abuse (%)
People in Group quarters - Mental (Psychiatric) hospitals or wards (%)
People in Group quarters - Schools, hospitals, or wards for the mentally retarded (%)
People in Group quarters - Schools, hospitals, or wards for the physically handicapped (%)
People in Group quarters - Institutions for the deaf (%)
People in Group quarters - Institutions for the blind (%)
People in Group quarters - Orthopedic wards and institutions for the physically handicapped (%)
People in Group quarters - Wards in general hospitals for patients who have no usual home elsewhere (%)
People in Group quarters - Wards in military hospitals for patients who have no usual home elsewhere (%)
People in Group quarters - Juvenile institutions (%)
People in Group quarters - Long-term care (%)
People in Group quarters - Homes for abused, dependent, and neglected children (%)
People in Group quarters - Residential treatment centers for emotionally disturbed children (%)
People in Group quarters - Training schools for juvenile delinquents (%)
People in Group quarters - Short-term care, detention or diagnostic centers for delinquent children (%)
People in Group quarters - Type of juvenile institution unknown (%)
People in Group quarters - Noninstitutionalized population (%)
People in Group quarters - College dormitories (includes college quarters off campus) (%)
People in Group quarters - Military quarters (%)
People in Group quarters - On base (%)
People in Group quarters - Barracks, unaccompanied personnel housing (UPH), (Enlisted/Officer), ;and similar group living quarters for military personnel (%)
People in Group quarters - Transient quarters for temporary residents (%)
People in Group quarters - Military ships (%)
People in Group quarters - Group homes (%)
People in Group quarters - Homes or halfway houses for drug/alcohol abuse (%)
People in Group quarters - Homes for the mentally ill (%)
People in Group quarters - Homes for the mentally retarded (%)
People in Group quarters - Homes for the physically handicapped (%)
People in Group quarters - Other group homes (%)
People in Group quarters - Religious group quarters (%)
People in Group quarters - Dormitories (%)
People in Group quarters - Agriculture workers' dormitories on farms (%)
People in Group quarters - Job Corps and vocational training facilities (%)
People in Group quarters - Other workers' dormitories (%)
People in Group quarters - Crews of maritime vessels (%)
People in Group quarters - Other nonhousehold living situations (%)
People in Group quarters - Other noninstitutional group quarters (%)
Residents speaking English at home (%)
Residents speaking English at home - Born in the United States (%)
Residents speaking English at home - Native, born elsewhere (%)
Residents speaking English at home - Foreign born (%)
Residents speaking Spanish at home (%)
Residents speaking Spanish at home - Born in the United States (%)
Residents speaking Spanish at home - Native, born elsewhere (%)
Residents speaking Spanish at home - Foreign born (%)
Residents speaking other language at home (%)
Residents speaking other language at home - Born in the United States (%)
Residents speaking other language at home - Native, born elsewhere (%)
Residents speaking other language at home - Foreign born (%)
Class of Workers - Employee of private company (%)
Class of Workers - Self-employed in own incorporated business (%)
Class of Workers - Private not-for-profit wage and salary workers (%)
Class of Workers - Local government workers (%)
Class of Workers - State government workers (%)
Class of Workers - Federal government workers (%)
Class of Workers - Self-employed workers in own not incorporated business and Unpaid family workers (%)
House heating fuel used in houses and condos - Utility gas (%)
House heating fuel used in houses and condos - Bottled, tank, or LP gas (%)
House heating fuel used in houses and condos - Electricity (%)
House heating fuel used in houses and condos - Fuel oil, kerosene, etc. (%)
House heating fuel used in houses and condos - Coal or coke (%)
House heating fuel used in houses and condos - Wood (%)
House heating fuel used in houses and condos - Solar energy (%)
House heating fuel used in houses and condos - Other fuel (%)
House heating fuel used in houses and condos - No fuel used (%)
House heating fuel used in apartments - Utility gas (%)
House heating fuel used in apartments - Bottled, tank, or LP gas (%)
House heating fuel used in apartments - Electricity (%)
House heating fuel used in apartments - Fuel oil, kerosene, etc. (%)
House heating fuel used in apartments - Coal or coke (%)
House heating fuel used in apartments - Wood (%)
House heating fuel used in apartments - Solar energy (%)
House heating fuel used in apartments - Other fuel (%)
House heating fuel used in apartments - No fuel used (%)
Armed forces status - In Armed Forces (%)
Armed forces status - Civilian (%)
Armed forces status - Civilian - Veteran (%)
Armed forces status - Civilian - Nonveteran (%)
Fatal accidents locations in years 2005-2021
Fatal accidents locations in 2005
Fatal accidents locations in 2006
Fatal accidents locations in 2007
Fatal accidents locations in 2008
Fatal accidents locations in 2009
Fatal accidents locations in 2010
Fatal accidents locations in 2011
Fatal accidents locations in 2012
Fatal accidents locations in 2013
Fatal accidents locations in 2014
Fatal accidents locations in 2015
Fatal accidents locations in 2016
Fatal accidents locations in 2017
Fatal accidents locations in 2018
Fatal accidents locations in 2019
Fatal accidents locations in 2020
Fatal accidents locations in 2021
Alcohol use - People drinking some alcohol every month (%)
Alcohol use - People not drinking at all (%)
Alcohol use - Average days/month drinking alcohol
Alcohol use - Average drinks/week
Alcohol use - Average days/year people drink much
Audiometry - Average condition of hearing (%)
Audiometry - People that can hear a whisper from across a quiet room (%)
Audiometry - People that can hear normal voice from across a quiet room (%)
Audiometry - Ears ringing, roaring, buzzing (%)
Audiometry - Had a job exposure to loud noise (%)
Audiometry - Had off-work exposure to loud noise (%)
Blood Pressure & Cholesterol - Has high blood pressure (%)
Blood Pressure & Cholesterol - Checking blood pressure at home (%)
Blood Pressure & Cholesterol - Frequently checking blood cholesterol (%)
Blood Pressure & Cholesterol - Has high cholesterol level (%)
Consumer Behavior - Money monthly spent on food at supermarket/grocery store
Consumer Behavior - Money monthly spent on food at other stores
Consumer Behavior - Money monthly spent on eating out
Consumer Behavior - Money monthly spent on carryout/delivered foods
Consumer Behavior - Income spent on food at supermarket/grocery store (%)
Consumer Behavior - Income spent on food at other stores (%)
Consumer Behavior - Income spent on eating out (%)
Consumer Behavior - Income spent on carryout/delivered foods (%)
Current Health Status - General health condition (%)
Current Health Status - Blood donors (%)
Current Health Status - Has blood ever tested for HIV virus (%)
Current Health Status - Left-handed people (%)
Dermatology - People using sunscreen (%)
Diabetes - Diabetics (%)
Diabetes - Had a blood test for high blood sugar (%)
Diabetes - People taking insulin (%)
Diet Behavior & Nutrition - Diet health (%)
Diet Behavior & Nutrition - Milk product consumption (# of products/month)
Diet Behavior & Nutrition - Meals not home prepared (#/week)
Diet Behavior & Nutrition - Meals from fast food or pizza place (#/week)
Diet Behavior & Nutrition - Ready-to-eat foods (#/month)
Diet Behavior & Nutrition - Frozen meals/pizza (#/month)
Drug Use - People that ever used marijuana or hashish (%)
Drug Use - Ever used hard drugs (%)
Drug Use - Ever used any form of cocaine (%)
Drug Use - Ever used heroin (%)
Drug Use - Ever used methamphetamine (%)
Health Insurance - People covered by health insurance (%)
Kidney Conditions-Urology - Avg. # of times urinating at night
Medical Conditions - People with asthma (%)
Medical Conditions - People with anemia (%)
Medical Conditions - People with psoriasis (%)
Medical Conditions - People with overweight (%)
Medical Conditions - Elderly people having difficulties in thinking or remembering (%)
Medical Conditions - People who ever received blood transfusion (%)
Medical Conditions - People having trouble seeing even with glass/contacts (%)
Medical Conditions - People with arthritis (%)
Medical Conditions - People with gout (%)
Medical Conditions - People with congestive heart failure (%)
Medical Conditions - People with coronary heart disease (%)
Medical Conditions - People with angina pectoris (%)
Medical Conditions - People who ever had heart attack (%)
Medical Conditions - People who ever had stroke (%)
Medical Conditions - People with emphysema (%)
Medical Conditions - People with thyroid problem (%)
Medical Conditions - People with chronic bronchitis (%)
Medical Conditions - People with any liver condition (%)
Medical Conditions - People who ever had cancer or malignancy (%)
Mental Health - People who have little interest in doing things (%)
Mental Health - People feeling down, depressed, or hopeless (%)
Mental Health - People who have trouble sleeping or sleeping too much (%)
Mental Health - People feeling tired or having little energy (%)
Mental Health - People with poor appetite or overeating (%)
Mental Health - People feeling bad about themself (%)
Mental Health - People who have trouble concentrating on things (%)
Mental Health - People moving or speaking slowly or too fast (%)
Mental Health - People having thoughts they would be better off dead (%)
Oral Health - Average years since last visit a dentist
Oral Health - People embarrassed because of mouth (%)
Oral Health - People with gum disease (%)
Oral Health - General health of teeth and gums (%)
Oral Health - Average days a week using dental floss/device
Oral Health - Average days a week using mouthwash for dental problem
Oral Health - Average number of teeth
Pesticide Use - Households using pesticides to control insects (%)
Pesticide Use - Households using pesticides to kill weeds (%)
Physical Activity - People doing vigorous-intensity work activities (%)
Physical Activity - People doing moderate-intensity work activities (%)
Physical Activity - People walking or bicycling (%)
Physical Activity - People doing vigorous-intensity recreational activities (%)
Physical Activity - People doing moderate-intensity recreational activities (%)
Physical Activity - Average hours a day doing sedentary activities
Physical Activity - Average hours a day watching TV or videos
Physical Activity - Average hours a day using computer
Physical Functioning - People having limitations keeping them from working (%)
Physical Functioning - People limited in amount of work they can do (%)
Physical Functioning - People that need special equipment to walk (%)
Physical Functioning - People experiencing confusion/memory problems (%)
Physical Functioning - People requiring special healthcare equipment (%)
Prescription Medications - Average number of prescription medicines taking
Preventive Aspirin Use - Adults 40+ taking low-dose aspirin (%)
Reproductive Health - Vaginal deliveries (%)
Reproductive Health - Cesarean deliveries (%)
Reproductive Health - Deliveries resulted in a live birth (%)
Reproductive Health - Pregnancies resulted in a delivery (%)
Reproductive Health - Women breastfeeding newborns (%)
Reproductive Health - Women that had a hysterectomy (%)
Reproductive Health - Women that had both ovaries removed (%)
Reproductive Health - Women that have ever taken birth control pills (%)
Reproductive Health - Women taking birth control pills (%)
Reproductive Health - Women that have ever used Depo-Provera or injectables (%)
Reproductive Health - Women that have ever used female hormones (%)
Sexual Behavior - People 18+ that ever had sex (vaginal, anal, or oral) (%)
Sexual Behavior - Males 18+ that ever had vaginal sex with a woman (%)
Sexual Behavior - Males 18+ that ever performed oral sex on a woman (%)
Sexual Behavior - Males 18+ that ever had anal sex with a woman (%)
Sexual Behavior - Males 18+ that ever had any sex with a man (%)
Sexual Behavior - Females 18+ that ever had vaginal sex with a man (%)
Sexual Behavior - Females 18+ that ever performed oral sex on a man (%)
Sexual Behavior - Females 18+ that ever had anal sex with a man (%)
Sexual Behavior - Females 18+ that ever had any kind of sex with a woman (%)
Sexual Behavior - Average age people first had sex
Sexual Behavior - Average number of female sex partners in lifetime (males 18+)
Sexual Behavior - Average number of female vaginal sex partners in lifetime (males 18+)
Sexual Behavior - Average age people first performed oral sex on a woman (18+)
Sexual Behavior - Average number of woman performed oral sex on in lifetime (18+)
Sexual Behavior - Average number of male sex partners in lifetime (males 18+)
Sexual Behavior - Average number of male anal sex partners in lifetime (males 18+)
Sexual Behavior - Average age people first performed oral sex on a man (18+)
Sexual Behavior - Average number of male oral sex partners in lifetime (18+)
Sexual Behavior - People using protection when performing oral sex (%)
Sexual Behavior - Average number of times people have vaginal or anal sex a year
Sexual Behavior - People having sex without condom (%)
Sexual Behavior - Average number of male sex partners in lifetime (females 18+)
Sexual Behavior - Average number of male vaginal sex partners in lifetime (females 18+)
Sexual Behavior - Average number of female sex partners in lifetime (females 18+)
Sexual Behavior - Circumcised males 18+ (%)
Sleep Disorders - Average hours sleeping at night
Sleep Disorders - People that has trouble sleeping (%)
Smoking-Cigarette Use - People smoking cigarettes (%)
Taste & Smell - People 40+ having problems with smell (%)
Taste & Smell - People 40+ having problems with taste (%)
Taste & Smell - People 40+ that ever had wisdom teeth removed (%)
Taste & Smell - People 40+ that ever had tonsils teeth removed (%)
Taste & Smell - People 40+ that ever had a loss of consciousness because of a head injury (%)
Taste & Smell - People 40+ that ever had a broken nose or other serious injury to face or skull (%)
Taste & Smell - People 40+ that ever had two or more sinus infections (%)
Weight - Average height (inches)
Weight - Average weight (pounds)
Weight - Average BMI
Weight - People that are obese (%)
Weight - People that ever were obese (%)
Weight - People trying to lose weight (%)
Urban population: 35,181
Rural population: 1,637
Estimated median house/condo value in 2022: $200,175
46835:
$200,175Indiana:
$208,700
Median resident age: This zip code:
34.2 yearsIndiana median age:
38.2 years
Average household size: This zip code:
2.4 peopleIndiana:
2.4 people
Averages for the 2020 tax year for zip code 46835, filed in 2021:
Average Adjusted Gross Income (AGI) in 2020: $63,167 (Individual Income Tax Returns) Here:
$63,167State:
$64,978
Salary/wage: $54,265 (reported on 83.2% of returns )Here:
$54,265State:
$55,245
(% of AGI for various income ranges: 1125.9% for AGIs below $25k , 3571.2% for AGIs $25k-50k , 6253.9% for AGIs $50k-75k , 9259.9% for AGIs $75k-100k , 15963.1% for AGIs $100k-200k , 61534.2% for AGIs over 200k ) Taxable interest for individuals: $1,195 (reported on 30.8% of returns )This zip code:
$1,195Indiana:
$1,351
(% of AGI for various income ranges: 14.6% for AGIs below $25k , 16.2% for AGIs $25k-50k , 34.1% for AGIs $50k-75k , 53.2% for AGIs $75k-100k , 107.1% for AGIs $100k-200k , 1230.5% for AGIs over 200k ) Ordinary dividends: $4,798 (reported on 19.3% of returns )(% of AGI for various income ranges: 25.7% for AGIs below $25k , 35.7% for AGIs $25k-50k , 82.2% for AGIs $50k-75k , 97.5% for AGIs $75k-100k , 311.2% for AGIs $100k-200k , 3428.9% for AGIs over 200k ) Net capital gain/loss in AGI: +$8,959 (reported on 17.5% of returns )Here:
+$8,959State:
+$17,730
(% of AGI for various income ranges: 6.0% for AGIs below $25k , 27.1% for AGIs $25k-50k , 64.9% for AGIs $50k-75k , 100.4% for AGIs $75k-100k , 476.2% for AGIs $100k-200k , 9190.0% for AGIs over 200k ) Profit/loss from business: +$11,473 (reported on 12.2% of returns )Here:
+$11,473State:
+$12,144
(% of AGI for various income ranges: 69.3% for AGIs below $25k , 85.2% for AGIs $25k-50k , 149.4% for AGIs $50k-75k , 243.9% for AGIs $75k-100k , 388.5% for AGIs $100k-200k , 3513.2% for AGIs over 200k ) Taxable individual retirement arrangement distribution: $17,995 (reported on 12.1% of returns )46835:
$17,995Indiana:
$18,302
(% of AGI for various income ranges: 82.5% for AGIs below $25k , 128.2% for AGIs $25k-50k , 245.9% for AGIs $50k-75k , 412.1% for AGIs $75k-100k , 863.6% for AGIs $100k-200k , 3424.2% for AGIs over 200k ) Self-employed (Keogh) retirement plans: $23,260 (reported on 0.3% of returns )46835:
$23,260Indiana:
$27,160
(% of AGI for various income ranges: 19.0% for AGIs $75k-100k , 464.2% for AGIs over 200k ) Total itemized deductions: $34,962 (reported on 4.9% of returns )Here:
$34,962State:
$35,601
(% of AGI for various income ranges: 36.5% for AGIs below $25k , 63.4% for AGIs $25k-50k , 189.2% for AGIs $50k-75k , 202.6% for AGIs $75k-100k , 531.6% for AGIs $100k-200k , 6286.3% for AGIs over 200k ) Charity contributions: $14,459 (reported on 3.9% of returns )Here:
$14,459State:
$15,596
(% of AGI for various income ranges: 1.7% for AGIs below $25k , 9.6% for AGIs $25k-50k , 34.1% for AGIs $50k-75k , 54.0% for AGIs $75k-100k , 186.3% for AGIs $100k-200k , 2928.4% for AGIs over 200k ) Taxes paid: $7,103 (reported on 4.9% of returns )(% of AGI for various income ranges: 3.2% for AGIs below $25k , 8.8% for AGIs $25k-50k , 33.8% for AGIs $50k-75k , 47.0% for AGIs $75k-100k , 148.7% for AGIs $100k-200k , 1128.9% for AGIs over 200k ) Earned income credit: $2,021 (reported on 11.2% of returns )(% of AGI for various income ranges: 59.4% for AGIs below $25k , 44.6% for AGIs $25k-50k , 1.5% for AGIs $50k-75k ) Percentage of individuals using paid preparers for their 2020 taxes: 94.3%(% for various income ranges: 92.9% for AGIs below $25k , 94.8% for AGIs $25k-50k , 95.2% for AGIs $50k-75k , 94.6% for AGIs $75k-100k , 94.1% for AGIs $100k-200k , 96.5% for AGIs over 200k )
Averages for the 2012 tax year for zip code 46835, filed in 2013:
Average Adjusted Gross Income (AGI) in 2012: $52,389 (Individual Income Tax Returns) Here:
$52,389State:
$52,932
Salary/wage: $45,541 (reported on 84.7% of returns )Here:
$45,541State:
$45,173
(% of AGI for various income ranges: 73.7% for AGIs below $25k , 79.8% for AGIs $25k-50k , 81.4% for AGIs $50k-75k , 79.1% for AGIs $75k-100k , 76.1% for AGIs $100k-200k , 48.1% for AGIs over 200k ) Taxable interest for individuals: $966 (reported on 35.7% of returns )This zip code:
$966Indiana:
$1,311
(% of AGI for various income ranges: 1.2% for AGIs below $25k , 0.6% for AGIs $25k-50k , 0.5% for AGIs $50k-75k , 0.5% for AGIs $75k-100k , 0.6% for AGIs $100k-200k , 0.9% for AGIs over 200k ) Ordinary dividends: $3,627 (reported on 21.4% of returns )(% of AGI for various income ranges: 1.6% for AGIs below $25k , 1.0% for AGIs $25k-50k , 0.9% for AGIs $50k-75k , 1.1% for AGIs $75k-100k , 1.5% for AGIs $100k-200k , 3.1% for AGIs over 200k ) Net capital gain/loss in AGI: +$6,106 (reported on 15.9% of returns )Here:
+$6,106State:
+$10,406
(% of AGI for various income ranges: 0.1% for AGIs $25k-50k , 0.3% for AGIs $50k-75k , 0.5% for AGIs $75k-100k , 1.5% for AGIs $100k-200k , 8.6% for AGIs over 200k ) Profit/loss from business: +$11,429 (reported on 11.6% of returns )Here:
+$11,429State:
+$11,105
(% of AGI for various income ranges: 4.9% for AGIs below $25k , 2.4% for AGIs $25k-50k , 1.7% for AGIs $50k-75k , 1.7% for AGIs $75k-100k , 2.2% for AGIs $100k-200k , 3.8% for AGIs over 200k ) Taxable individual retirement arrangement distribution: $13,944 (reported on 12.6% of returns )46835:
$13,944Indiana:
$13,841
(% of AGI for various income ranges: 4.7% for AGIs below $25k , 3.3% for AGIs $25k-50k , 2.8% for AGIs $50k-75k , 3.4% for AGIs $75k-100k , 4.1% for AGIs $100k-200k , 2.3% for AGIs over 200k ) Self-employment retirement plans: $18,486 (reported on 0.4% of returns )46835:
$18,486Indiana:
$21,482
Total itemized deductions: $18,529 (19% of AGI, reported on 28.6% of returns )Here:
$18,529State:
$20,913
Here:
18.8% of AGIState:
18.2% of AGI
(% of AGI for various income ranges: 7.8% for AGIs below $25k , 8.8% for AGIs $25k-50k , 9.2% for AGIs $50k-75k , 10.1% for AGIs $75k-100k , 12.4% for AGIs $100k-200k , 10.6% for AGIs over 200k ) Charity contributions: $4,532 (reported on 23.2% of returns )(% of AGI for various income ranges: 0.7% for AGIs below $25k , 1.2% for AGIs $25k-50k , 1.6% for AGIs $50k-75k , 2.0% for AGIs $75k-100k , 2.7% for AGIs $100k-200k , 3.0% for AGIs over 200k ) Taxes paid: $6,198 (reported on 28.5% of returns )(% of AGI for various income ranges: 1.1% for AGIs below $25k , 2.0% for AGIs $25k-50k , 2.6% for AGIs $50k-75k , 3.1% for AGIs $75k-100k , 4.7% for AGIs $100k-200k , 5.3% for AGIs over 200k ) Earned income credit: $2,043 (reported on 13.2% of returns )(% of AGI for various income ranges: 4.4% for AGIs below $25k , 0.9% for AGIs $25k-50k ) Percentage of individuals using paid preparers for their 2012 taxes: 45.4%(% for various income ranges: 39.1% for AGIs below $25k , 44.2% for AGIs $25k-50k , 48.6% for AGIs $50k-75k , 50.0% for AGIs $75k-100k , 55.7% for AGIs $100k-200k , 77.1% for AGIs over 200k )
Averages for the 2004 tax year for zip code 46835, filed in 2005:
Average Adjusted Gross Income (AGI) in 2004: $47,583 (Individual Income Tax Returns) Here:
$47,583State:
$44,790
Salary/wage: $42,790 (reported on 87.2% of returns )Here:
$42,790State:
$39,615
(% of AGI for various income ranges: 103.9% for AGIs below $10k , 73.7% for AGIs $10k-25k , 83.5% for AGIs $25k-50k , 85.4% for AGIs $50k-75k , 85.3% for AGIs $75k-100k , 66.5% for AGIs over 100k ) Taxable interest for individuals: $1,290 (reported on 49.9% of returns )This zip code:
$1,290Indiana:
$1,535
(% of AGI for various income ranges: 4.5% for AGIs below $10k , 2.9% for AGIs $10k-25k , 1.2% for AGIs $25k-50k , 1.0% for AGIs $50k-75k , 0.9% for AGIs $75k-100k , 1.4% for AGIs over 100k ) Taxable dividends: $2,501 (reported on 27.8% of returns )(% of AGI for various income ranges: 4.1% for AGIs below $10k , 1.9% for AGIs $10k-25k , 1.0% for AGIs $25k-50k , 0.9% for AGIs $50k-75k , 1.1% for AGIs $75k-100k , 2.1% for AGIs over 100k ) Net capital gain/loss: +$5,798 (reported on 21.2% of returns )Here:
+$5,798State:
+$8,619
(% of AGI for various income ranges: -1.3% for AGIs below $10k , 0.8% for AGIs $10k-25k , 0.6% for AGIs $25k-50k , 0.4% for AGIs $50k-75k , 1.0% for AGIs $75k-100k , 6.8% for AGIs over 100k ) Profit/loss from business: +$9,500 (reported on 12.2% of returns )Here:
+$9,500State:
+$10,071
(% of AGI for various income ranges: 2.7% for AGIs below $10k , 2.8% for AGIs $10k-25k , 2.1% for AGIs $25k-50k , 1.9% for AGIs $50k-75k , 2.1% for AGIs $75k-100k , 3.2% for AGIs over 100k ) IRA payment deduction: $3,015 (reported on 3.0% of returns )46835:
$3,015Indiana:
$2,840
(% of AGI for various income ranges: 0.3% for AGIs $10k-25k , 0.3% for AGIs $25k-50k , 0.2% for AGIs $50k-75k , 0.2% for AGIs $75k-100k , 0.1% for AGIs over 100k ) Self-employed pension: $11,923 (reported on 0.7% of returns )Here:
$11,923Indiana:
$15,305
Total itemized deductions: $16,027 (20% of AGI, reported on 39.6% of returns )Here:
$16,027State:
$17,065
Here:
20.2% of AGIState:
19.5% of AGI
(% of AGI for various income ranges: 9.8% for AGIs below $10k , 10.6% for AGIs $10k-25k , 12.3% for AGIs $25k-50k , 13.9% for AGIs $50k-75k , 14.6% for AGIs $75k-100k , 13.7% for AGIs over 100k ) Charity contributions deductions: $3,493 (4% of AGI, reported on 34.8% of returns )Here:
4.2% of AGIState:
3.8% of AGI
(% of AGI for various income ranges: 0.8% for AGIs below $10k , 1.4% for AGIs $10k-25k , 1.7% for AGIs $25k-50k , 2.3% for AGIs $50k-75k , 2.8% for AGIs $75k-100k , 3.5% for AGIs over 100k ) Total tax: $6,714 (reported on 78.5% of returns )(% of AGI for various income ranges: 3.3% for AGIs below $10k , 4.2% for AGIs $10k-25k , 7.1% for AGIs $25k-50k , 8.7% for AGIs $50k-75k , 10.2% for AGIs $75k-100k , 17.7% for AGIs over 100k ) Earned income credit: $1,473 (reported on 8.7% of returns )Percentage of individuals using paid preparers for their 2004 taxes: 49.4%(% for various income ranges: 39.7% for AGIs below $10k , 51.7% for AGIs $10k-25k , 50.0% for AGIs $25k-50k , 50.1% for AGIs $50k-75k , 52.0% for AGIs $75k-100k , 58.6% for AGIs over 100k )
Estimated median household income in 2022: This zip code:
$71,227Indiana:
$66,785
Nearest zip codes: 46815 ,
46765 ,
46825 ,
46845 ,
46805 ,
46774 .
Fort Wayne Zip Code Map
Percentage of family households: This zip code:
43.8%Indiana:
46.2%
Percentage of households with unmarried partners: This zip code:
5.7%Indiana:
48.0%
Likely homosexual households (counted as self-reported same-sex unmarried-partner households)
Lesbian couples: 0.1% of all households Gay men: 0.0% of all households
Household received Food Stamps/SNAP in the past 12 months: 569Household did not receive Food Stamps/SNAP in the past 12 months: 14,765
Women who had a birth in the past 12 months: 493 (475 now married , 45 unmarried) Women who did not have a birth in the past 12 months: 8,683 (3,881 now married , 4,804 unmarried)
Housing units in zip code 46835 with a mortgage: 7,544 (649
second mortgage , 31
home equity loan , 590
both second mortgage and home equity loan )
Houses without a mortgage: 84
Median monthly owner costs for units with a mortgage: $1,189
Median monthly owner costs for units without a mortgage: $473
Residents with income below the poverty level in 2022:
This zip code:
9.5%Whole state:
12.6%
Residents with income below 50% of the poverty level in 2022:
This zip code:
4.6%Whole state:
6.3%
Median number of rooms in houses and condos: Median number of rooms in apartments:
Year house built (houses)
78 2020 or later1,367 2010 to 20192,090 2000 to 20092,395 1990 to 19991,920 1980 to 19893,638 1970 to 19792,332 1960 to 19691,350 1950 to 1959194 1940 to 1949159 1939 or earlier
Zip code 46835 household income distribution in 2022 540 Less than $10,000167 $10,000 to $14,999460 $15,000 to $19,999292 $20,000 to $24,999643 $25,000 to $29,999636 $30,000 to $34,999770 $35,000 to $39,999837 $40,000 to $44,999530 $45,000 to $49,9991,136 $50,000 to $59,9992,067 $60,000 to $74,9992,578 $75,000 to $99,9991,524 $100,000 to $124,9991,138 $125,000 to $149,9991,074 $150,000 to $199,999932 $200,000 or moreEstimate of home value of owner-occupied houses/condos in 2022 in zip code 46835 16 Less than $10,00046 $10,000 to $14,99996 $15,000 to $19,99944 $20,000 to $24,9998 $25,000 to $29,99922 $30,000 to $34,99914 $50,000 to $59,99915 $60,000 to $69,99950 $70,000 to $79,999133 $80,000 to $89,999140 $90,000 to $99,9991,133 $100,000 to $124,9991,379 $125,000 to $149,9991,692 $150,000 to $174,9991,390 $175,000 to $199,9991,330 $200,000 to $249,9991,160 $250,000 to $299,9991,289 $300,000 to $399,999553 $400,000 to $499,999143 $500,000 to $749,999276 $750,000 to $999,99955 $1,000,000 to $1,499,999Rent paid by renters in 2022 in zip code 46835 42 Less than $10015 $350 to $39911 $400 to $44912 $450 to $49923 $500 to $549196 $550 to $599236 $600 to $649356 $650 to $699514 $700 to $749192 $750 to $799611 $800 to $899429 $900 to $999663 $1,000 to $1,249183 $1,250 to $1,499355 $1,500 to $1,99995 $2,000 to $2,49973 No cash rent
Median gross rent in 2022: $1,064.
Median price asked for vacant for-sale houses and condos in 2022: $134,109.
Estimated median house (or condo) value in 2022 for: White Non-Hispanic householders: $199,542Black or African American householders: $215,345American Indian or Alaska Native householders: $145,390Asian householders: $213,660Some other race householders: $204,599Two or more races householders: $185,635Hispanic or Latino householders: $207,128Estimated median house or condo value in 2022: $200,175
46835:
$200,175Indiana:
$208,700
Lower value quartile - upper value quartile: $151,256 - $283,665
Mean price in 2022: Detached houses: $199,291Here:
$199,291State:
$257,916
Townhouses or other attached units: $129,527Here:
$129,527State:
$224,114
In 2-unit structures: $40,699Here:
$40,699State:
$175,375
In 3-to-4-unit structures: $282,620Here:
$282,620State:
$151,116
In 5-or-more-unit structures: $128,347Here:
$128,347State:
$200,844
Mobile homes: $49,266Here:
$49,266State:
$67,116
Housing units in structures:
One, detached: 11,662One, attached: 628Two: 1483 or 4: 2395 to 9: 1,16810 to 19: 71920 to 49: 84350 or more: 304Mobile homes: 31Unemployment : 2.3%
Means of transportation to work in zip code 46835 79.5% 15,114 Drove a car alone7.0% 1,325 Carpooled0.6% 106 Bus or trolley bus0.1% 18 Bicycle1.2% 229 Walked0.5% 90 Other means10.8% 2,061 Worked at homeTravel time to work (commute) in zip code 46835 281 Less than 5 minutes1,293 5 to 9 minutes2,522 10 to 14 minutes4,149 15 to 19 minutes3,478 20 to 24 minutes1,616 25 to 29 minutes1,924 30 to 34 minutes217 35 to 39 minutes425 40 to 44 minutes405 45 to 59 minutes251 60 to 89 minutes391 90 or more minutes
Percentage of zip code residents living and working in this county: 91.0%
Household type by relationship:
Households: 36,819
Male householders: 7,689 (1,921 living alone ), Female householders: 7,668 (2,835 living alone )7,201 spouses (7,141 opposite-sex spouses ), 1,181 unmarried partners , (1,066 opposite-sex unmarried partners ), 9,560 children (8,796 natural , 157 adopted , 605 stepchildren ), 670 grandchildren , 490 brothers or sisters , 295 parents , 19 foster children , 392 other relatives , 1,346 non-relatives In group quarters: 255 (-1 institutionalized population )
Size of family households: 4,287 2-persons , 2,076 3-persons , 1,468 4-persons , 644 5-persons , 364 6-persons , 346 7-or-more-persons
Size of nonfamily households: 4,760 1-person , 1,131 2-persons , 96 3-persons , 173 4-persons
6,619 married couples with children. single-parent households (434 men , 831 women ).
89.2% of residents of 46835 zip code speak English at home. of residents speak Spanish at home (67% very well, 10% well, 8% not well, 15% not at all ).of residents speak other Indo-European language at home (93% very well, 4% well, 2% not well ).of residents speak Asian or Pacific Island language at home (65% very well, 15% well, 14% not well, 6% not at all ).of residents speak other language at home (29% very well, 63% well, 8% not well ).
Foreign born population: 2,649 (7.2%)
(49.2%
of them are naturalized citizens )
This zip code:
7.2%Whole state:
6.1%
18% Bhutan 15% Honduras 8% Zimbabwe 6% Singapore 5% Eritrea 4% El Salvador 4% Thailand 27% German 10% English 7% American 5% European 4% Irish 2% Italian 1% Scottish
Year of entry for the foreign-born population
1,535 2010 or later 572 2000 to 2009 543 1990 to 1999 374 Before 1990
There are
73 Medical Specialists in Zip Code 46835 .
Facilities with environmental interests located in this zip code:
PARKERDALE 66 SERVICE STATION (6925 ST JOE RD in FT WAYNE, IN)
STATE MASTER (Indiana facility tracking) - LUST-199410520, LEAKING STORAGE TANK, UST-6168, UNDERGROUND STORAGE TANK PROGRAM Conditionally Exempt Small Quantity Generators, less than 100 kg/month of hazardous waste (Resource Conservation and Recovery Act (tracking hazardous waste)) - notification Organizations: JIM MUNRO (CONTACT/OWNER)
MEIJER #138 GAS STATION (10305 SR 37 (MAYSVILLE RD) in FORT WAYNE, IN)
STATE MASTER (Indiana facility tracking) - CRTK-21266, EPCRA, UST-19645, UNDERGROUND STORAGE TANK PROGRAM Conditionally Exempt Small Quantity Generators, less than 100 kg/month of hazardous waste (Resource Conservation and Recovery Act (tracking hazardous waste)) - notification Organizations: MEIJER STORES LTD PARTNERSHIP (CONTACT/OWNER)
Alternative names: MEIJER GAS STA 138
ARLINGTON ELEMENTARY SCHOOL (8118 ST JO CTR RD in FORT WAYNE, IN)
(National Center for Education Statistics) - STATE ID-0275 Organizations: FORT WAYNE COMMUNITY SCHOOLS (SCHOOL DISTRICT)
ROBERT C HARRIS ELEM SCH (4501 THORNGATE DR in FORT WAYNE, IN)
(National Center for Education Statistics) - STATE ID-0239 Organizations: FORT WAYNE COMMUNITY SCHOOLS (SCHOOL DISTRICT)
SAINT JOSEPH CENTRAL SCHOOL (6341 ST JOE CTR RD in FORT WAYNE, IN)
(National Center for Education Statistics) - STATE ID-0233 Organizations: FORT WAYNE COMMUNITY SCHOOLS (SCHOOL DISTRICT)
NORTH STAR TRUCKING, LLC (6628 REVERE PLACE in FORT WAYNE, IN)
STATE MASTER (Indiana facility tracking) TRANSPORTER (Resource Conservation and Recovery Act (tracking hazardous waste)) USED OIL PROGRAM (Resource Conservation and Recovery Act (tracking hazardous waste)) Organizations: SILVIA JIMENEZ (CONTACT/OPERATOR)
GOODYEAR ASC #6729 (4512 MAPLECREST in FT WAYNE, IN)
STATE MASTER (Indiana facility tracking) Conditionally Exempt Small Quantity Generators, less than 100 kg/month of hazardous waste (Resource Conservation and Recovery Act (tracking hazardous waste)) Business NAICS classification: GENERAL AUTOMOTIVE REPAIR.; AUTOMOTIVE TRANSMISSION REPAIR.Organizations: GOODYEAR TIRE & RUBBER CO (CONTACT/OWNER)
Alternative names: GOODYEAR 6729
AQUALIFE POOLS & SPAR (6652 ST JOE RD in FT WAYNE, IN)
STATE MASTER (Indiana facility tracking) COMPLIANCE ACTIVITY (Tracking inspections of insecticide, fungicide, and rodenticide, and toxic substances)
Housing units lacking complete plumbing facilities: 0.3%
Housing units lacking complete kitchen facilities: 1.1%
66.2% Utility gas 32.0% Electricity 1.1% Bottled, tank, or LP gas
Population in 1990: 26,758. Population change in the 1990s: +4,550 (+17.0%).
Place of birth for U.S.-born residents:
This state: 24,398Northeast: 1,129Midwest: 5,635South: 1,678West: 1,098
54% of the 46835 zip code residents lived in the same house 5 years ago.
Out of people who lived in different houses, 65% lived in this county.
Out of people who lived in different counties, 50% lived in Indiana.
89% of the 46835 zip code residents lived in the same house 1 year ago.
Out of people who lived in different houses, 67% moved from this county.
Out of people who lived in different houses, 9% moved from different county within same state.
Out of people who lived in different houses, 18% moved from different state.
Out of people who lived in different houses, 5% moved from abroad.
Private vs. public school enrollment:
Students in private schools in grades 1 to 8 (elementary and middle school): 1,743
Students in private schools in grades 9 to 12 (high school): 953
Students in private undergraduate colleges: 255
Occupation by median earnings in the past 12 months ($)
82,617 Health diagnosing and treating practitioners and other technical occupations 75,103 Legal occupations 72,296 Law enforcement workers including supervisors 67,567 Business and financial operations occupations 65,237 Architecture and engineering occupations 61,122 Computer and mathematical occupations
Companies with federal contracts located in this zip code:
LEWTECH COMPANY, INC (7112 NIGHTHAWK DR in FORT WAYNE, IN; small business) in 3 contracts from 2005 to 2006
$99,005 with Office of Policy, Management and Budget/Chief Financial Officer for Other Research and Development -- Engineering Development (R&D). Signed on 2005-12-13. Effective on 2005-12-15. Completion date: 2006-06-30.
with Navy for Other Defense -- Operational Systems Development (R&D). Signed on 2005-08-02. Completion date: 2006-05-31.
, same as above. Signed on 2006-06-05. Completion date: 2006-08-31.
Top industries in this zip code by the number of employees in 2005:
Accommodation and Food Services: Full-Service Restaurants (50-99 employees: 5 establishments, 20-49 employees: 1 establishment, 10-19 employees: 1 establishment, 5-9 employees: 1 establishment, 1-4 employees: 3 establishments)Accommodation and Food Services: Limited-Service Restaurants (50-99: 2, 20-49: 4, 10-19: 1, 5-9: 1, 1-4: 1)Accommodation and Food Services: Drinking Places (Alcoholic Beverages) (100-249: 1, 10-19: 1, 1-4: 2)Finance and Insurance: Reinsurance Carriers (100-249: 1, 10-19: 1)Health Care and Social Assistance: Nursing Care Facilities (100-249: 1)Other Services (except Public Administration): Religious Organizations (20-49: 2, 10-19: 4, 5-9: 1, 1-4: 7)
People in group quarters in 2010:
128 people in nursing facilities/skilled-nursing facilities
19 people in group homes intended for adults
12 people in group homes for juveniles (non-correctional)
11 people in correctional residential facilities
4 people in residential treatment centers for adults
People in group quarters in 2000:
379 people in homes for the mentally retarded
140 people in nursing homes
Fatal accident statistics in 2014:
Fatal accident count: 1Vehicles involved in fatal accidents: 3Fatal accidents caused by drunken drivers: 0Fatalities: 1Persons involved in fatal accidents: 3Pedestrians involved in fatal accidents: 0
Fatal accident statistics in 2012:
Fatal accident count: 2Vehicles involved in fatal accidents: 2Fatal accidents caused by drunken drivers: 1Fatalities: 3Persons involved in fatal accidents: 3Pedestrians involved in fatal accidents: 0
Home Mortgage Disclosure Act Aggregated Statistics For Year 2009(Based on 4 full and 14 partial tracts) A) FHA, FSA/RHS & VA B) Conventional C) Refinancings D) Home Improvement Loans F) Non-occupant Loans on G) Loans On Manufactured Number Average Value Number Average Value Number Average Value Number Average Value Number Average Value Number Average Value
LOANS ORIGINATED 593 $107,894 346 $115,539 1,838 $119,652 79 $30,698 80 $72,286 0 $0 APPLICATIONS APPROVED, NOT ACCEPTED 34 $110,906 8 $87,815 128 $119,254 7 $35,960 7 $42,566 2 $38,170 APPLICATIONS DENIED 55 $102,476 45 $114,965 414 $118,738 58 $41,315 23 $75,411 0 $0 APPLICATIONS WITHDRAWN 28 $97,311 9 $78,019 363 $118,626 16 $46,022 15 $78,760 0 $0 FILES CLOSED FOR INCOMPLETENESS 13 $102,209 7 $80,557 116 $125,882 6 $82,980 5 $114,770 0 $0
Aggregated Statistics For Year 2008(Based on 3 full and 14 partial tracts) A) FHA, FSA/RHS & VA B) Conventional C) Refinancings D) Home Improvement Loans E) Loans on Dwellings For 5+ Families F) Non-occupant Loans on G) Loans On Manufactured Number Average Value Number Average Value Number Average Value Number Average Value Number Average Value Number Average Value Number Average Value
LOANS ORIGINATED 406 $109,224 474 $115,758 764 $113,060 113 $25,201 3 $1,881,050 68 $87,251 3 $50,750 APPLICATIONS APPROVED, NOT ACCEPTED 11 $175,727 39 $99,325 71 $113,117 33 $17,201 0 $0 2 $35,315 0 $0 APPLICATIONS DENIED 47 $114,416 73 $99,311 469 $120,198 102 $29,552 0 $0 17 $61,590 9 $42,910 APPLICATIONS WITHDRAWN 29 $109,465 45 $147,524 234 $118,888 15 $39,637 0 $0 4 $137,578 0 $0 FILES CLOSED FOR INCOMPLETENESS 7 $91,974 8 $105,179 55 $128,164 1 $26,700 0 $0 0 $0 0 $0
Aggregated Statistics For Year 2007(Based on 3 full and 14 partial tracts) A) FHA, FSA/RHS & VA B) Conventional C) Refinancings D) Home Improvement Loans E) Loans on Dwellings For 5+ Families F) Non-occupant Loans on G) Loans On Manufactured Number Average Value Number Average Value Number Average Value Number Average Value Number Average Value Number Average Value Number Average Value
LOANS ORIGINATED 214 $106,459 927 $105,462 796 $104,372 140 $33,249 2 $3,585,515 77 $76,794 3 $24,047 APPLICATIONS APPROVED, NOT ACCEPTED 5 $120,750 109 $121,123 166 $108,475 28 $24,602 0 $0 13 $80,538 1 $25,230 APPLICATIONS DENIED 32 $97,414 129 $88,601 604 $102,199 133 $29,700 0 $0 35 $86,665 3 $24,580 APPLICATIONS WITHDRAWN 11 $110,973 49 $107,840 273 $115,796 18 $53,124 0 $0 16 $102,769 0 $0 FILES CLOSED FOR INCOMPLETENESS 7 $119,446 21 $147,796 105 $119,145 3 $60,957 0 $0 8 $98,298 0 $0
Aggregated Statistics For Year 2006(Based on 3 full and 14 partial tracts) A) FHA, FSA/RHS & VA B) Conventional C) Refinancings D) Home Improvement Loans E) Loans on Dwellings For 5+ Families F) Non-occupant Loans on G) Loans On Manufactured Number Average Value Number Average Value Number Average Value Number Average Value Number Average Value Number Average Value Number Average Value
LOANS ORIGINATED 206 $106,319 1,247 $96,064 867 $103,885 170 $31,588 1 $2,154,030 114 $92,463 4 $51,032 APPLICATIONS APPROVED, NOT ACCEPTED 18 $122,952 131 $93,097 183 $101,225 27 $24,389 0 $0 20 $59,196 1 $20,800 APPLICATIONS DENIED 21 $119,874 203 $85,549 721 $109,062 143 $27,084 0 $0 46 $63,143 12 $35,594 APPLICATIONS WITHDRAWN 9 $102,200 106 $97,711 503 $109,402 22 $56,041 0 $0 21 $90,667 4 $114,262 FILES CLOSED FOR INCOMPLETENESS 8 $116,968 72 $90,146 165 $139,295 0 $0 0 $0 12 $80,395 0 $0
Aggregated Statistics For Year 2005(Based on 4 full and 14 partial tracts) A) FHA, FSA/RHS & VA B) Conventional C) Refinancings D) Home Improvement Loans E) Loans on Dwellings For 5+ Families F) Non-occupant Loans on G) Loans On Manufactured Number Average Value Number Average Value Number Average Value Number Average Value Number Average Value Number Average Value Number Average Value
LOANS ORIGINATED 265 $105,012 1,263 $94,284 1,275 $99,826 151 $29,218 2 $3,384,575 132 $86,243 6 $39,668 APPLICATIONS APPROVED, NOT ACCEPTED 15 $100,937 152 $84,437 222 $100,619 21 $21,746 0 $0 11 $115,703 3 $59,703 APPLICATIONS DENIED 29 $105,934 208 $82,887 922 $102,175 144 $38,508 0 $0 30 $75,849 16 $31,150 APPLICATIONS WITHDRAWN 4 $107,458 114 $99,344 658 $115,841 63 $105,773 0 $0 21 $87,044 0 $0 FILES CLOSED FOR INCOMPLETENESS 10 $114,596 63 $106,030 135 $115,981 9 $34,390 0 $0 5 $115,702 0 $0
Aggregated Statistics For Year 2004(Based on 3 full and 14 partial tracts) A) FHA, FSA/RHS & VA B) Conventional C) Refinancings D) Home Improvement Loans F) Non-occupant Loans on G) Loans On Manufactured Number Average Value Number Average Value Number Average Value Number Average Value Number Average Value Number Average Value
LOANS ORIGINATED 315 $101,361 968 $103,182 1,436 $105,464 142 $31,784 114 $90,065 10 $34,546 APPLICATIONS APPROVED, NOT ACCEPTED 22 $112,940 137 $106,894 259 $99,627 26 $37,776 13 $77,312 5 $39,914 APPLICATIONS DENIED 24 $107,302 159 $95,090 823 $99,718 143 $30,784 40 $119,202 15 $27,943 APPLICATIONS WITHDRAWN 13 $107,596 82 $97,347 545 $111,728 57 $28,000 14 $75,040 3 $69,660 FILES CLOSED FOR INCOMPLETENESS 14 $121,854 37 $97,246 93 $124,533 3 $16,447 4 $35,450 0 $0
Aggregated Statistics For Year 2003(Based on 4 full and 14 partial tracts) A) FHA, FSA/RHS & VA B) Conventional C) Refinancings D) Home Improvement Loans F) Non-occupant Loans on Number Average Value Number Average Value Number Average Value Number Average Value Number Average Value
LOANS ORIGINATED 433 $101,712 1,047 $106,168 4,068 $103,263 100 $22,387 150 $82,123 APPLICATIONS APPROVED, NOT ACCEPTED 8 $85,266 89 $95,477 451 $98,619 24 $15,623 14 $69,141 APPLICATIONS DENIED 34 $105,719 120 $94,700 919 $93,257 92 $20,445 23 $64,645 APPLICATIONS WITHDRAWN 11 $119,145 72 $106,361 647 $99,800 9 $29,980 18 $70,877 FILES CLOSED FOR INCOMPLETENESS 13 $97,278 26 $108,964 140 $103,724 11 $27,495 4 $85,660
Aggregated Statistics For Year 2002(Based on 2 full and 12 partial tracts) A) FHA, FSA/RHS & VA B) Conventional C) Refinancings D) Home Improvement Loans E) Loans on Dwellings For 5+ Families F) Non-occupant Loans on Number Average Value Number Average Value Number Average Value Number Average Value Number Average Value Number Average Value
LOANS ORIGINATED 293 $93,635 546 $97,718 1,874 $89,422 117 $19,857 2 $41,910 84 $84,659 APPLICATIONS APPROVED, NOT ACCEPTED 7 $104,490 44 $87,921 239 $89,513 26 $15,298 0 $0 4 $62,470 APPLICATIONS DENIED 32 $99,648 53 $81,441 462 $87,376 61 $15,128 0 $0 6 $49,868 APPLICATIONS WITHDRAWN 9 $85,857 34 $103,857 197 $105,839 9 $13,808 0 $0 2 $166,440 FILES CLOSED FOR INCOMPLETENESS 5 $98,080 12 $70,438 152 $92,924 0 $0 0 $0 3 $83,060
Aggregated Statistics For Year 2001(Based on 1 full and 12 partial tracts) A) FHA, FSA/RHS & VA B) Conventional C) Refinancings D) Home Improvement Loans E) Loans on Dwellings For 5+ Families F) Non-occupant Loans on Number Average Value Number Average Value Number Average Value Number Average Value Number Average Value Number Average Value
LOANS ORIGINATED 324 $93,778 481 $90,167 1,484 $82,055 150 $18,579 1 $1,195,980 61 $77,340 APPLICATIONS APPROVED, NOT ACCEPTED 17 $106,248 42 $91,324 199 $66,776 23 $15,339 0 $0 7 $60,720 APPLICATIONS DENIED 23 $91,099 64 $56,488 512 $73,441 88 $14,573 0 $0 17 $52,591 APPLICATIONS WITHDRAWN 5 $93,362 35 $104,163 212 $84,060 15 $20,385 0 $0 3 $81,033 FILES CLOSED FOR INCOMPLETENESS 2 $72,005 6 $102,932 53 $81,906 4 $18,182 0 $0 1 $110,150
Aggregated Statistics For Year 2000(Based on 2 full and 12 partial tracts) A) FHA, FSA/RHS & VA B) Conventional C) Refinancings D) Home Improvement Loans F) Non-occupant Loans on Number Average Value Number Average Value Number Average Value Number Average Value Number Average Value
LOANS ORIGINATED 256 $87,111 501 $88,916 439 $69,289 206 $16,996 29 $80,051 APPLICATIONS APPROVED, NOT ACCEPTED 6 $88,855 55 $85,392 163 $55,939 38 $19,823 8 $69,299 APPLICATIONS DENIED 25 $82,958 90 $59,154 358 $65,172 113 $15,127 26 $65,653 APPLICATIONS WITHDRAWN 15 $83,547 32 $81,408 176 $71,336 23 $23,309 2 $70,830 FILES CLOSED FOR INCOMPLETENESS 5 $97,766 6 $89,482 25 $79,722 0 $0 2 $61,320
Aggregated Statistics For Year 1999(Based on 2 full and 7 partial tracts) A) FHA, FSA/RHS & VA B) Conventional C) Refinancings D) Home Improvement Loans E) Loans on Dwellings For 5+ Families F) Non-occupant Loans on Number Average Value Number Average Value Number Average Value Number Average Value Number Average Value Number Average Value
LOANS ORIGINATED 181 $86,489 541 $98,495 611 $72,638 122 $14,255 1 $20,114,700 28 $86,415 APPLICATIONS APPROVED, NOT ACCEPTED 5 $78,194 43 $78,266 137 $61,555 32 $16,382 0 $0 3 $46,453 APPLICATIONS DENIED 15 $91,137 141 $57,172 291 $60,375 65 $187,431 0 $0 8 $44,726 APPLICATIONS WITHDRAWN 8 $92,250 36 $90,345 212 $64,873 23 $30,309 0 $0 4 $61,238 FILES CLOSED FOR INCOMPLETENESS 1 $58,000 6 $127,928 35 $69,481 1 $25,640 0 $0 2 $42,825
Private Mortgage Insurance Companies Aggregated Statistics For Year 2009(Based on 3 full and 14 partial tracts) A) Conventional B) Refinancings Number Average Value Number Average Value
LOANS ORIGINATED 108 $134,682 103 $140,322 APPLICATIONS APPROVED, NOT ACCEPTED 23 $134,871 27 $123,690 APPLICATIONS DENIED 11 $115,639 15 $126,243 APPLICATIONS WITHDRAWN 3 $195,620 5 $104,082 FILES CLOSED FOR INCOMPLETENESS 4 $162,242 1 $107,000
Aggregated Statistics For Year 2008(Based on 3 full and 14 partial tracts) A) Conventional B) Refinancings C) Non-occupant Loans on D) Loans On Manufactured Number Average Value Number Average Value Number Average Value Number Average Value
LOANS ORIGINATED 202 $119,117 93 $123,812 13 $75,078 0 $0 APPLICATIONS APPROVED, NOT ACCEPTED 51 $119,824 37 $132,051 2 $88,955 2 $80,335 APPLICATIONS DENIED 24 $184,998 5 $121,874 6 $81,018 0 $0 APPLICATIONS WITHDRAWN 7 $137,261 2 $101,930 0 $0 0 $0 FILES CLOSED FOR INCOMPLETENESS 3 $119,073 3 $94,590 2 $120,100 0 $0
Aggregated Statistics For Year 2007(Based on 3 full and 14 partial tracts) A) Conventional B) Refinancings C) Non-occupant Loans on D) Loans On Manufactured Number Average Value Number Average Value Number Average Value Number Average Value
LOANS ORIGINATED 398 $104,672 123 $116,939 20 $95,954 0 $0 APPLICATIONS APPROVED, NOT ACCEPTED 52 $110,515 33 $116,486 0 $0 1 $61,960 APPLICATIONS DENIED 8 $190,974 1 $175,110 0 $0 0 $0 APPLICATIONS WITHDRAWN 12 $81,483 11 $108,182 2 $88,110 0 $0 FILES CLOSED FOR INCOMPLETENESS 4 $89,438 1 $125,690 0 $0 0 $0
Aggregated Statistics For Year 2006(Based on 3 full and 14 partial tracts) A) Conventional B) Refinancings C) Non-occupant Loans on Number Average Value Number Average Value Number Average Value
LOANS ORIGINATED 317 $101,635 102 $115,434 15 $88,989 APPLICATIONS APPROVED, NOT ACCEPTED 43 $141,630 30 $143,469 4 $68,612 APPLICATIONS DENIED 3 $88,917 1 $624,190 1 $68,070 APPLICATIONS WITHDRAWN 15 $93,015 7 $108,359 0 $0 FILES CLOSED FOR INCOMPLETENESS 0 $0 0 $0 0 $0
Aggregated Statistics For Year 2005(Based on 3 full and 14 partial tracts) A) Conventional B) Refinancings C) Non-occupant Loans on D) Loans On Manufactured Number Average Value Number Average Value Number Average Value Number Average Value
LOANS ORIGINATED 269 $106,047 181 $119,766 22 $83,434 1 $99,720 APPLICATIONS APPROVED, NOT ACCEPTED 49 $128,295 48 $141,565 4 $61,975 0 $0 APPLICATIONS DENIED 3 $108,907 0 $0 0 $0 0 $0 APPLICATIONS WITHDRAWN 12 $140,166 14 $97,253 0 $0 0 $0 FILES CLOSED FOR INCOMPLETENESS 2 $112,975 3 $136,350 0 $0 0 $0
Aggregated Statistics For Year 2004(Based on 3 full and 14 partial tracts) A) Conventional B) Refinancings C) Non-occupant Loans on Number Average Value Number Average Value Number Average Value
LOANS ORIGINATED 339 $104,058 259 $115,699 47 $87,152 APPLICATIONS APPROVED, NOT ACCEPTED 96 $112,872 129 $115,694 8 $71,914 APPLICATIONS DENIED 8 $103,630 0 $0 3 $86,753 APPLICATIONS WITHDRAWN 13 $139,668 20 $108,814 1 $79,000 FILES CLOSED FOR INCOMPLETENESS 3 $90,540 7 $104,880 0 $0
Aggregated Statistics For Year 2003(Based on 3 full and 14 partial tracts) A) Conventional B) Refinancings C) Non-occupant Loans on Number Average Value Number Average Value Number Average Value
LOANS ORIGINATED 373 $108,606 674 $107,020 36 $99,390 APPLICATIONS APPROVED, NOT ACCEPTED 48 $102,299 177 $109,476 10 $79,961 APPLICATIONS DENIED 0 $0 2 $99,980 0 $0 APPLICATIONS WITHDRAWN 15 $103,105 46 $106,697 6 $132,890 FILES CLOSED FOR INCOMPLETENESS 0 $0 3 $80,350 0 $0
Aggregated Statistics For Year 2002(Based on 1 full and 12 partial tracts) A) Conventional B) Refinancings C) Non-occupant Loans on Number Average Value Number Average Value Number Average Value
LOANS ORIGINATED 252 $104,389 332 $100,746 28 $92,196 APPLICATIONS APPROVED, NOT ACCEPTED 33 $136,445 87 $91,481 7 $67,316 APPLICATIONS DENIED 1 $196,220 6 $95,740 1 $136,450 APPLICATIONS WITHDRAWN 7 $150,334 19 $91,227 1 $110,150 FILES CLOSED FOR INCOMPLETENESS 1 $207,850 1 $117,000 0 $0
Aggregated Statistics For Year 2001(Based on 1 full and 12 partial tracts) A) Conventional B) Refinancings C) Non-occupant Loans on Number Average Value Number Average Value Number Average Value
LOANS ORIGINATED 207 $97,754 280 $103,768 6 $98,612 APPLICATIONS APPROVED, NOT ACCEPTED 27 $99,581 32 $101,538 2 $120,615 APPLICATIONS DENIED 0 $0 8 $83,084 0 $0 APPLICATIONS WITHDRAWN 1 $104,510 8 $92,376 0 $0 FILES CLOSED FOR INCOMPLETENESS 0 $0 1 $139,810 0 $0
Aggregated Statistics For Year 2000(Based on 1 full and 12 partial tracts) A) Conventional B) Refinancings C) Non-occupant Loans on Number Average Value Number Average Value Number Average Value
LOANS ORIGINATED 208 $97,002 44 $95,110 4 $70,682 APPLICATIONS APPROVED, NOT ACCEPTED 32 $94,755 6 $78,015 3 $91,030 APPLICATIONS DENIED 3 $101,983 0 $0 0 $0 APPLICATIONS WITHDRAWN 2 $110,945 1 $65,000 0 $0 FILES CLOSED FOR INCOMPLETENESS 1 $84,000 2 $76,015 0 $0
Aggregated Statistics For Year 1999(Based on 1 full and 7 partial tracts) A) Conventional B) Refinancings C) Non-occupant Loans on Number Average Value Number Average Value Number Average Value
LOANS ORIGINATED 181 $102,182 85 $86,359 2 $61,015 APPLICATIONS APPROVED, NOT ACCEPTED 21 $94,260 18 $90,169 1 $41,890 APPLICATIONS DENIED 6 $93,895 6 $98,967 0 $0 APPLICATIONS WITHDRAWN 5 $83,132 1 $126,770 0 $0 FILES CLOSED FOR INCOMPLETENESS 2 $91,100 3 $115,020 0 $0
2002 - 2018 National Fire Incident Reporting System (NFIRS) incidents See full 2006 National Fire Incident Reporting System statistics for zip code 46835, Indiana
Most common first names in zip code 46835 among deceased individuals Name Count Lived (average)
Robert 95 75.9 years Mary 78 82.8 years James 68 72.0 years John 58 73.8 years Richard 56 72.2 years William 53 76.8 years Helen 48 85.0 years Charles 47 76.1 years Ruth 45 85.6 years Donald 41 74.4 years
Most common last names in zip code 46835 among deceased individuals Last name Count Lived (average)
Miller 39 81.5 years Smith 32 80.4 years Johnson 25 75.6 years Brown 17 75.6 years Taylor 14 76.6 years Jones 11 65.7 years Jackson 9 80.0 years Wright 8 77.3 years Lewis 8 74.5 years Davis 8 71.9 years
Businesses in zip code 46835
Name Count Name Count
AT&T 1 Marshalls 1 Applebee's 1 MasterBrand Cabinets 1 AutoZone 1 McDonald's 1 Blockbuster 1 Meijer 1 Buffalo Wild Wings 1 Menards 1 Burger King 1 Nike 2 CVS 1 Office Depot 1 Cracker Barrel 1 PetSmart 1 Dairy Queen 2 Pizza Hut 1 Discount Tire 1 Sprint Nextel 1 Dunkin Donuts 1 Steak 'n Shake 1 FedEx 3 Subway 3 GameStop 1 T-Mobile 1 Goodwill 1 Taco Bell 1 H&R Block 1 UPS 4 KFC 1 Walgreens 1 Kohl's 1 Walmart 1 Kroger 1 Wendy's 1 Little Caesars Pizza 1

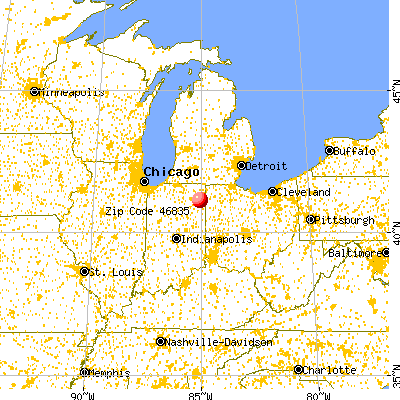


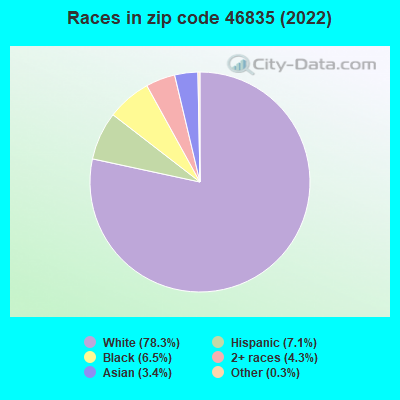


 Nearest zip codes: 46815, 46765, 46825, 46845, 46805, 46774.
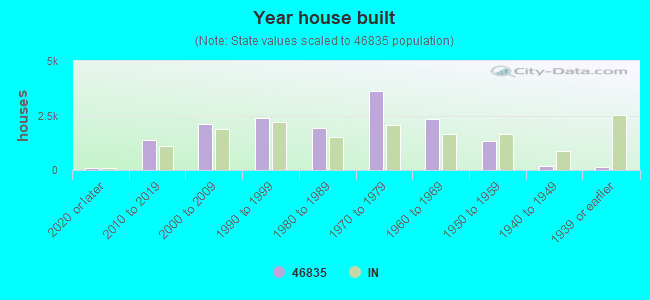
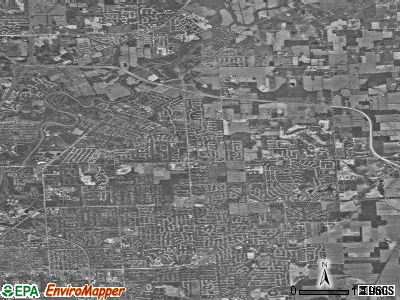
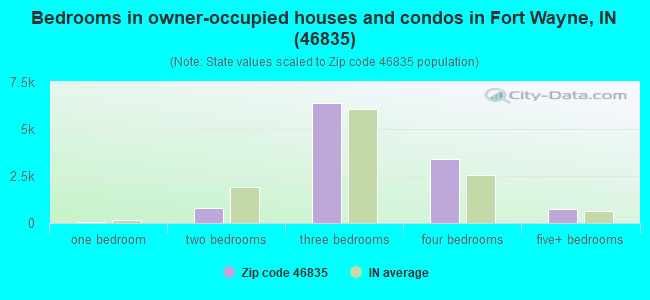
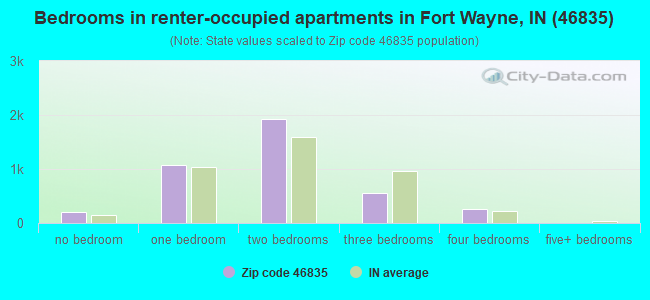
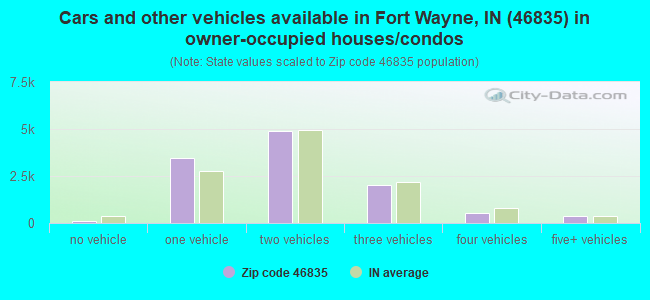
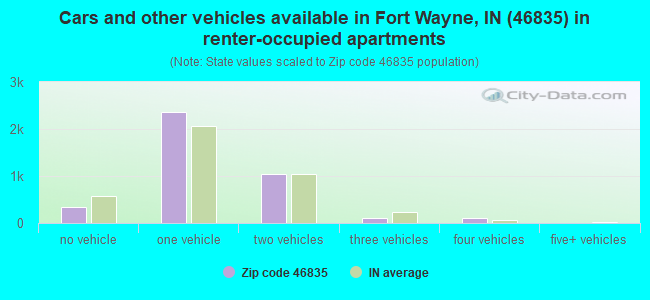


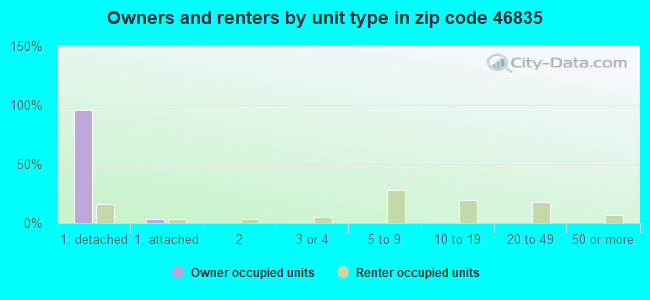
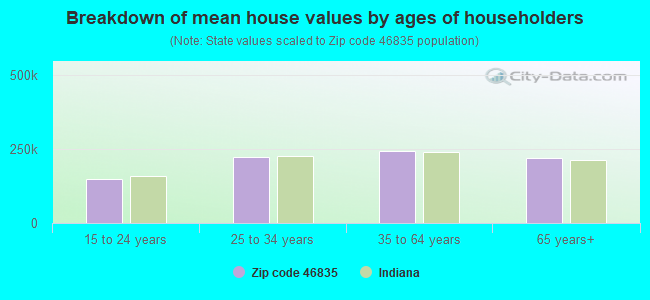


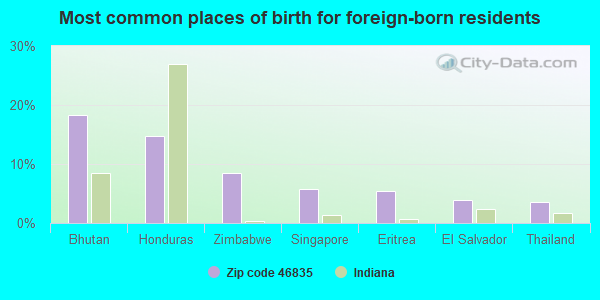
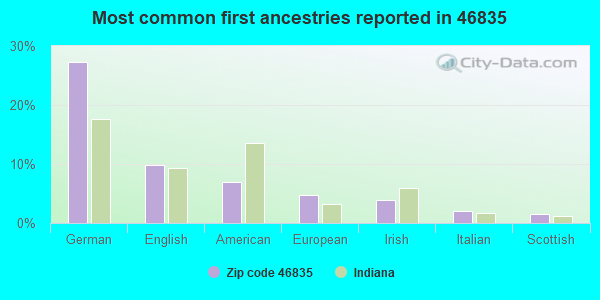
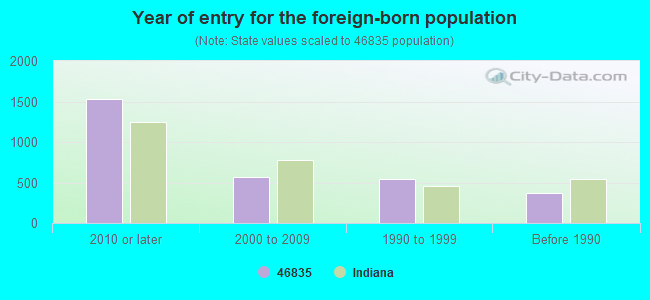


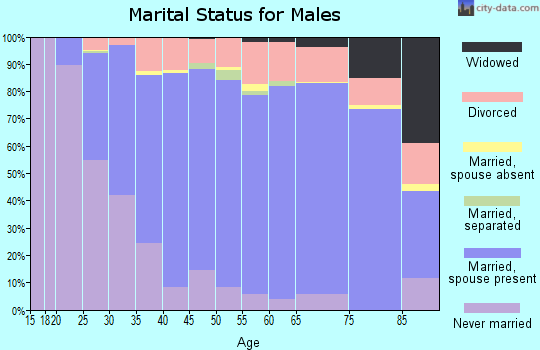

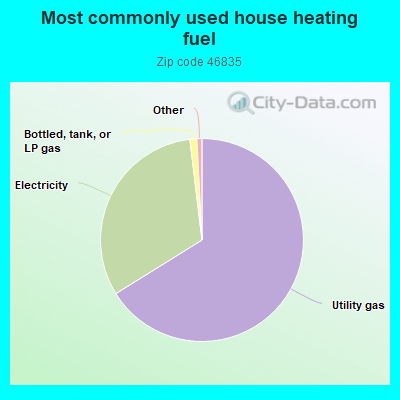
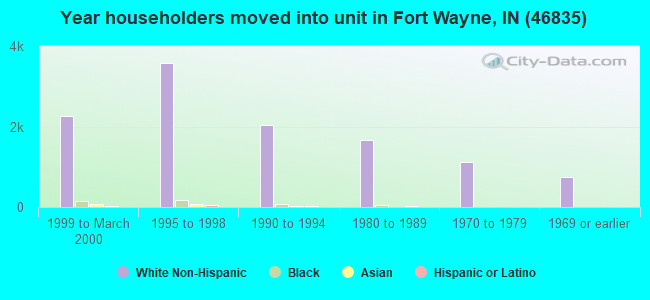
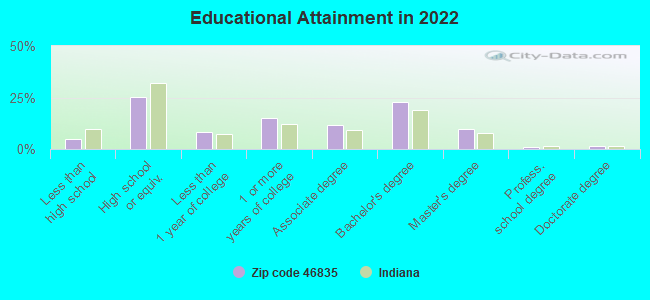
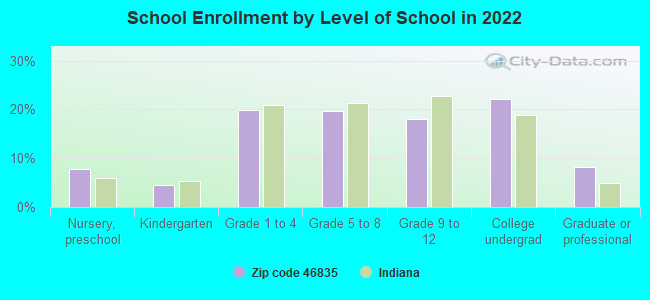
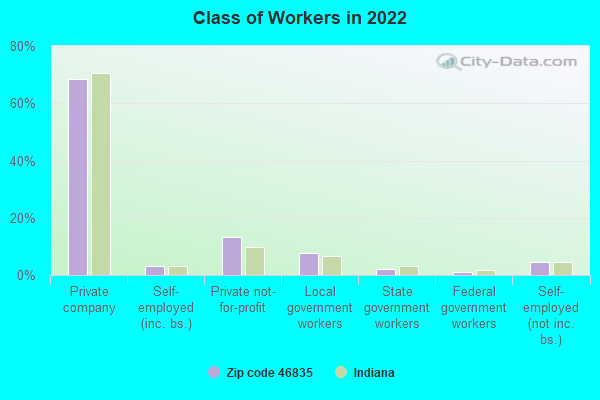
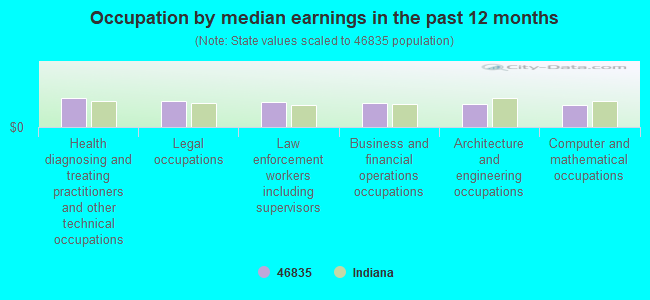
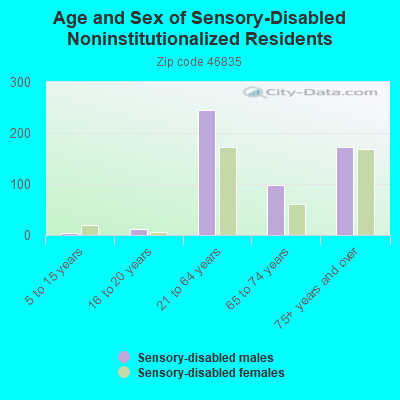

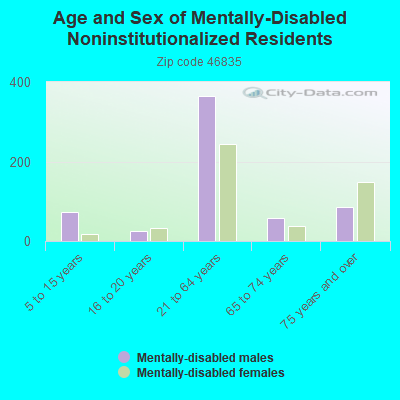
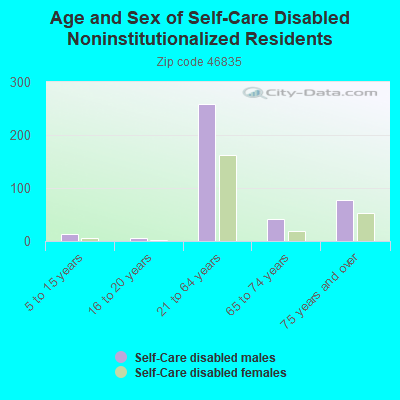
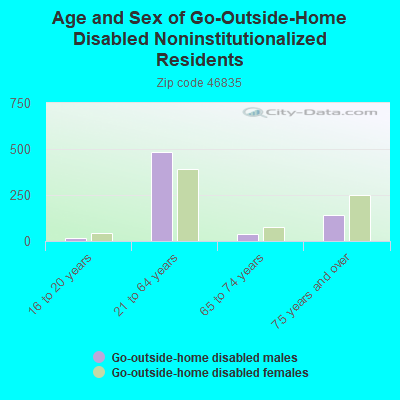
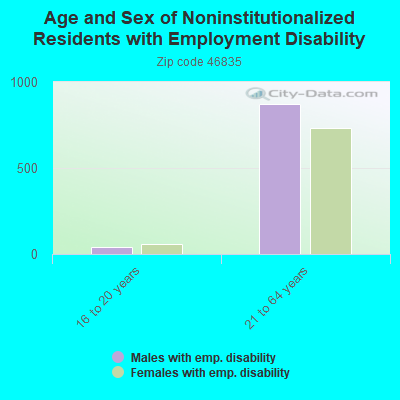
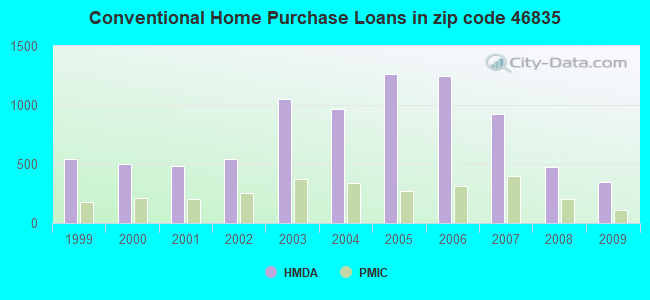
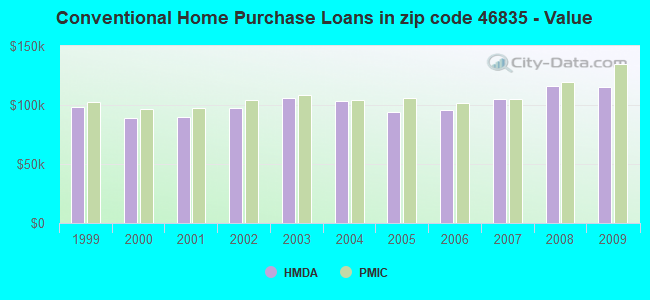
 Based on the data from the years 2002 - 2018 the average number of fire incidents per year is 70. The highest number of fires - 139 took place in 2005, and the least - 9 in 2014. The data has a rising trend.
 When looking into fire subcategories, the most reports belonged to: Outside Fires (38.3%), and Structure Fires (37.6%).