Races in Winchester, Massachusetts (MA) Detailed Stats
Data:
Races - White alone (%)
Races - White alone (% change since 2000)
Races - Black alone (%)
Races - Black alone (% change since 2000)
Races - American Indian alone (%)
Races - American Indian alone (% change since 2000)
Races - Asian alone (%)
Races - Asian alone (% change since 2000)
Races - Hispanic (%)
Races - Hispanic (% change since 2000)
Races - Native Hawaiian and Other Pacific Islander alone (%)
Races - Native Hawaiian and Other Pacific Islander alone (% change since 2000)
Races - Two or more races(%)
Races - Two or more races(% change since 2000)
Races - Other race alone (%)
Races - Other race alone (% change since 2000)
Racial diversity
Place of birth - Born in state of residence (%)
Place of birth - Born in state of residence (%) - White
Place of birth - Born in state of residence (%) - Black or African American
Place of birth - Born in state of residence (%) - Asian
Place of birth - Born in state of residence (%) - Hispanic or Latino
Place of birth - Born in state of residence (%) - American Indian and Alaska Native
Place of birth - Born in state of residence (%) - Multirace
Place of birth - Born in state of residence (%) - Other Race
Place of birth - Born in other state (%)
Place of birth - Born in other state (%) - White
Place of birth - Born in other state (%) - Black or African American
Place of birth - Born in other state (%) - Asian
Place of birth - Born in other state (%) - Hispanic or Latino
Place of birth - Born in other state (%) - American Indian and Alaska Native
Place of birth - Born in other state (%) - Multirace
Place of birth - Born in other state (%) - Other Race
Place of birth - Native, outside of US (%)
Place of birth - Native, outside of US (%) - White
Place of birth - Native, outside of US (%) - Black or African American
Place of birth - Native, outside of US (%) - Asian
Place of birth - Native, outside of US (%) - Hispanic or Latino
Place of birth - Native, outside of US (%) - American Indian and Alaska Native
Place of birth - Native, outside of US (%) - Multirace
Place of birth - Native, outside of US (%) - Other Race
Place of birth - Foreign born (%)
Place of birth - Foreign born (%) - White
Place of birth - Foreign born (%) - Black or African American
Place of birth - Foreign born (%) - Asian
Place of birth - Foreign born (%) - Hispanic or Latino
Place of birth - Foreign born (%) - American Indian and Alaska Native
Place of birth - Foreign born (%) - Multirace
Place of birth - Foreign born (%) - Other Race
Residents speaking English at home (%)
Residents speaking English at home - Born in the United States (%)
Residents speaking English at home - Native, born elsewhere (%)
Residents speaking English at home - Foreign born (%)
Residents speaking Spanish at home (%)
Residents speaking Spanish at home - Born in the United States (%)
Residents speaking Spanish at home - Native, born elsewhere (%)
Residents speaking Spanish at home - Foreign born (%)
Residents speaking other language at home (%)
Residents speaking other language at home - Born in the United States (%)
Residents speaking other language at home - Native, born elsewhere (%)
Residents speaking other language at home - Foreign born (%)
Marital status - Never married (%)
Marital status - Now married (%)
Marital status - Separated (%)
Marital status - Widowed (%)
Marital status - Divorced (%)
Ancestries Reported - Arab (%)
Ancestries Reported - Czech (%)
Ancestries Reported - Danish (%)
Ancestries Reported - Dutch (%)
Ancestries Reported - English (%)
Ancestries Reported - French (%)
Ancestries Reported - French Canadian (%)
Ancestries Reported - German (%)
Ancestries Reported - Greek (%)
Ancestries Reported - Hungarian (%)
Ancestries Reported - Irish (%)
Ancestries Reported - Italian (%)
Ancestries Reported - Lithuanian (%)
Ancestries Reported - Norwegian (%)
Ancestries Reported - Polish (%)
Ancestries Reported - Portuguese (%)
Ancestries Reported - Russian (%)
Ancestries Reported - Scotch-Irish (%)
Ancestries Reported - Scottish (%)
Ancestries Reported - Slovak (%)
Ancestries Reported - Subsaharan African (%)
Ancestries Reported - Swedish (%)
Ancestries Reported - Swiss (%)
Ancestries Reported - Ukrainian (%)
Ancestries Reported - United States (%)
Ancestries Reported - Welsh (%)
Ancestries Reported - West Indian (%)
Ancestries Reported - Other (%)
Geographical mobility - Same house 1 year ago (%)
Geographical mobility - Same house 1 year ago (%) - White
Geographical mobility - Same house 1 year ago (%) - Black or African American
Geographical mobility - Same house 1 year ago (%) - Asian
Geographical mobility - Same house 1 year ago (%) - Hispanic or Latino
Geographical mobility - Same house 1 year ago (%) - American Indian and Alaska Native
Geographical mobility - Same house 1 year ago (%) - Multirace
Geographical mobility - Same house 1 year ago (%) - Other Race
Geographical mobility - Moved within same county (%)
Geographical mobility - Moved within same county (%) - White
Geographical mobility - Moved within same county (%) - Black or African American
Geographical mobility - Moved within same county (%) - Asian
Geographical mobility - Moved within same county (%) - Hispanic or Latino
Geographical mobility - Moved within same county (%) - American Indian and Alaska Native
Geographical mobility - Moved within same county (%) - Multirace
Geographical mobility - Moved within same county (%) - Other Race
Geographical mobility - Moved from different county within same state (%)
Geographical mobility - Moved from different county within same state (%) - White
Geographical mobility - Moved from different county within same state (%) - Black or African American
Geographical mobility - Moved from different county within same state (%) - Asian
Geographical mobility - Moved from different county within same state (%) - Hispanic or Latino
Geographical mobility - Moved from different county within same state (%) - American Indian and Alaska Native
Geographical mobility - Moved from different county within same state (%) - Multirace
Geographical mobility - Moved from different county within same state (%) - Other Race
Geographical mobility - Moved from different state (%)
Geographical mobility - Moved from different state (%) - White
Geographical mobility - Moved from different state (%) - Black or African American
Geographical mobility - Moved from different state (%) - Asian
Geographical mobility - Moved from different state (%) - Hispanic or Latino
Geographical mobility - Moved from different state (%) - American Indian and Alaska Native
Geographical mobility - Moved from different state (%) - Multirace
Geographical mobility - Moved from different state (%) - Other Race
Geographical mobility - Moved from abroad (%)
Geographical mobility - Moved from abroad (%) - White
Geographical mobility - Moved from abroad (%) - Black or African American
Geographical mobility - Moved from abroad (%) - Asian
Geographical mobility - Moved from abroad (%) - Hispanic or Latino
Geographical mobility - Moved from abroad (%) - American Indian and Alaska Native
Geographical mobility - Moved from abroad (%) - Multirace
Geographical mobility - Moved from abroad (%) - Other Race
Place of birth for the foreign-born population - Ireland (%)
Place of birth for the foreign-born population - Denmark (%)
Place of birth for the foreign-born population - Norway (%)
Place of birth for the foreign-born population - Sweden (%)
Place of birth for the foreign-born population - United Kingdom (%)
Place of birth for the foreign-born population - England (%)
Place of birth for the foreign-born population - Scotland (%)
Place of birth for the foreign-born population - Other Northern Europe (%)
Place of birth for the foreign-born population - Austria (%)
Place of birth for the foreign-born population - Belgium (%)
Place of birth for the foreign-born population - France (%)
Place of birth for the foreign-born population - Germany (%)
Place of birth for the foreign-born population - Netherlands (%)
Place of birth for the foreign-born population - Switzerland (%)
Place of birth for the foreign-born population - Other Western Europe (%)
Place of birth for the foreign-born population - Greece (%)
Place of birth for the foreign-born population - Italy (%)
Place of birth for the foreign-born population - Portugal (%)
Place of birth for the foreign-born population - Spain (%)
Place of birth for the foreign-born population - Other Southern Europe (%)
Place of birth for the foreign-born population - Albania (%)
Place of birth for the foreign-born population - Belarus (%)
Place of birth for the foreign-born population - Bosnia and Herzegovina (%)
Place of birth for the foreign-born population - Bulgaria (%)
Place of birth for the foreign-born population - Croatia (%)
Place of birth for the foreign-born population - Czechoslovakia (%)
Place of birth for the foreign-born population - Hungary (%)
Place of birth for the foreign-born population - Latvia (%)
Place of birth for the foreign-born population - Lithuania (%)
Place of birth for the foreign-born population - North Macedonia (Macedonia) (%)
Place of birth for the foreign-born population - Moldova (%)
Place of birth for the foreign-born population - Poland (%)
Place of birth for the foreign-born population - Romania (%)
Place of birth for the foreign-born population - Russia (%)
Place of birth for the foreign-born population - Serbia (%)
Place of birth for the foreign-born population - Ukraine (%)
Place of birth for the foreign-born population - Other Eastern Europe (%)
Place of birth for the foreign-born population - China (%)
Place of birth for the foreign-born population - Hong Kong (%)
Place of birth for the foreign-born population - Taiwan (%)
Place of birth for the foreign-born population - Japan (%)
Place of birth for the foreign-born population - Korea (%)
Place of birth for the foreign-born population - Other Eastern Asia (%)
Place of birth for the foreign-born population - Afghanistan (%)
Place of birth for the foreign-born population - Bangladesh (%)
Place of birth for the foreign-born population - India (%)
Place of birth for the foreign-born population - Iran (%)
Place of birth for the foreign-born population - Kazakhstan (%)
Place of birth for the foreign-born population - Nepal (%)
Place of birth for the foreign-born population - Pakistan (%)
Place of birth for the foreign-born population - Sri Lanka (%)
Place of birth for the foreign-born population - Uzbekistan (%)
Place of birth for the foreign-born population - Other South Central Asia (%)
Place of birth for the foreign-born population - Burma (%)
Place of birth for the foreign-born population - Cambodia (%)
Place of birth for the foreign-born population - Indonesia (%)
Place of birth for the foreign-born population - Laos (%)
Place of birth for the foreign-born population - Malaysia (%)
Place of birth for the foreign-born population - Philippines (%)
Place of birth for the foreign-born population - Singapore (%)
Place of birth for the foreign-born population - Thailand (%)
Place of birth for the foreign-born population - Vietnam (%)
Place of birth for the foreign-born population - Other South Eastern Asia (%)
Place of birth for the foreign-born population - Armenia (%)
Place of birth for the foreign-born population - Iraq (%)
Place of birth for the foreign-born population - Israel (%)
Place of birth for the foreign-born population - Jordan (%)
Place of birth for the foreign-born population - Kuwait (%)
Place of birth for the foreign-born population - Lebanon (%)
Place of birth for the foreign-born population - Saudi Arabia (%)
Place of birth for the foreign-born population - Syria (%)
Place of birth for the foreign-born population - Turkey (%)
Place of birth for the foreign-born population - Yemen (%)
Place of birth for the foreign-born population - Other Western Asia (%)
Place of birth for the foreign-born population - Eritrea (%)
Place of birth for the foreign-born population - Ethiopia (%)
Place of birth for the foreign-born population - Kenya (%)
Place of birth for the foreign-born population - Somalia (%)
Place of birth for the foreign-born population - Uganda (%)
Place of birth for the foreign-born population - Zimbabwe (%)
Place of birth for the foreign-born population - Other Eastern Africa (%)
Place of birth for the foreign-born population - Cameroon (%)
Place of birth for the foreign-born population - Congo (%)
Place of birth for the foreign-born population - Democratic Republic of Congo (Zaire) (%)
Place of birth for the foreign-born population - Other Middle Africa (%)
Place of birth for the foreign-born population - Egypt (%)
Place of birth for the foreign-born population - Morocco (%)
Place of birth for the foreign-born population - Sudan (%)
Place of birth for the foreign-born population - Other Northern Africa (%)
Place of birth for the foreign-born population - South Africa (%)
Place of birth for the foreign-born population - Other Southern Africa (%)
Place of birth for the foreign-born population - Cabo Verde (%)
Place of birth for the foreign-born population - Ghana (%)
Place of birth for the foreign-born population - Liberia (%)
Place of birth for the foreign-born population - Nigeria (%)
Place of birth for the foreign-born population - Senegal (%)
Place of birth for the foreign-born population - Sierra Leone (%)
Place of birth for the foreign-born population - Other Western Africa (%)
Place of birth for the foreign-born population - Australia (%)
Place of birth for the foreign-born population - New Zealand (%)
Place of birth for the foreign-born population - Fiji (%)
Place of birth for the foreign-born population - Micronesia (%)
Place of birth for the foreign-born population - Bahamas (%)
Place of birth for the foreign-born population - Barbados (%)
Place of birth for the foreign-born population - Cuba (%)
Place of birth for the foreign-born population - Dominica (%)
Place of birth for the foreign-born population - Dominican Republic (%)
Place of birth for the foreign-born population - Grenada (%)
Place of birth for the foreign-born population - Haiti (%)
Place of birth for the foreign-born population - Jamaica (%)
Place of birth for the foreign-born population - St. Vincent and the Grenadines (%)
Place of birth for the foreign-born population - Trinidad and Tobago (%)
Place of birth for the foreign-born population - West Indies (%)
Place of birth for the foreign-born population - Other Caribbean (%)
Place of birth for the foreign-born population - Belize (%)
Place of birth for the foreign-born population - Costa Rica (%)
Place of birth for the foreign-born population - El Salvador (%)
Place of birth for the foreign-born population - Guatemala (%)
Place of birth for the foreign-born population - Honduras (%)
Place of birth for the foreign-born population - Mexico (%)
Place of birth for the foreign-born population - Nicaragua (%)
Place of birth for the foreign-born population - Panama (%)
Place of birth for the foreign-born population - Other Central America (%)
Place of birth for the foreign-born population - Argentina (%)
Place of birth for the foreign-born population - Bolivia (%)
Place of birth for the foreign-born population - Brazil (%)
Place of birth for the foreign-born population - Chile (%)
Place of birth for the foreign-born population - Colombia (%)
Place of birth for the foreign-born population - Ecuador (%)
Place of birth for the foreign-born population - Guyana (%)
Place of birth for the foreign-born population - Peru (%)
Place of birth for the foreign-born population - Uruguay (%)
Place of birth for the foreign-born population - Venezuela (%)
Place of birth for the foreign-born population - Other South America (%)
Place of birth for the foreign-born population - Canada (%)
Place of birth for the foreign-born population - Other Northern America (%)
Place of birth for the foreign-born population - Other (%)
Latest news about races in Winchester, MA collected exclusively by city-data.com from local newspapers, TV, and radio stations
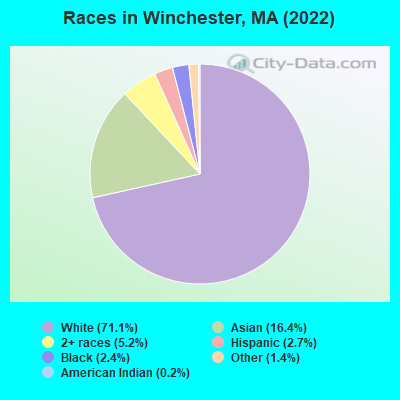
According to 2022 data, the most numerous races in Winchester, MA are White alone (16,156 residents), Hispanic (610 residents), and Asian alone (3,736 residents). 73.5% of Winchester residents speak English at home. 20.4% of Winchester, MA residents are foreign-born (10.1% born in Asia, 6.1% born in Europe, 2.1% born in Latin America), which is 11.7% greater than the foreign-born rate of 18.0% across the entire state of Massachusetts.
Race distribution in Winchester
2000 2022
5,198,359 81.9% White alone 428,729 6.8% Hispanic 318,329 5.0% Black alone 236,786 3.7% Asian alone 110,338 1.7% Two or more races 43,586 0.7% Other race alone 11,264 0.2% American Indian alone 1,706 0.03% Native Hawaiian and Other
4,676,627 67.0% White alone 911,038 13.0% Hispanic 501,463 7.2% Asian alone 459,740 6.6% Black alone 341,889 4.9% Two or more races 84,403 1.2% Other race alone 5,838 0.08% American Indian alone 976 0.01% Native Hawaiian and Other
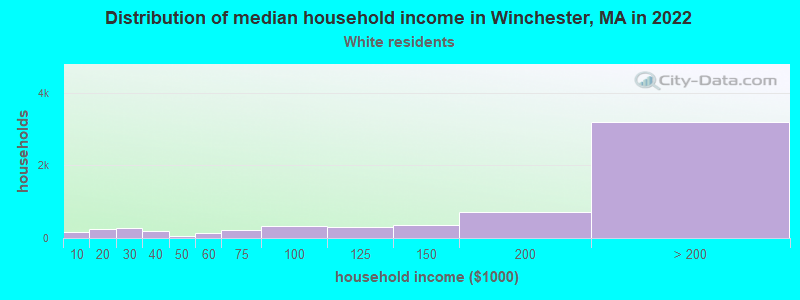
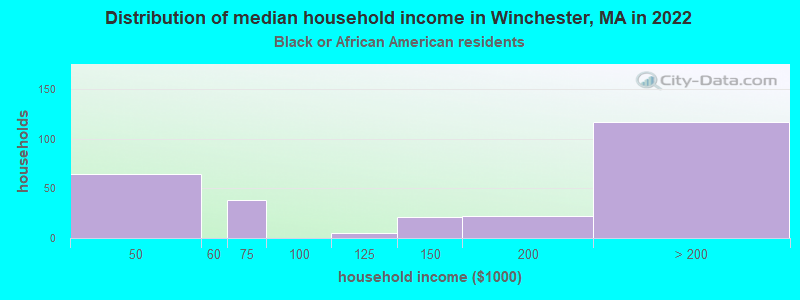
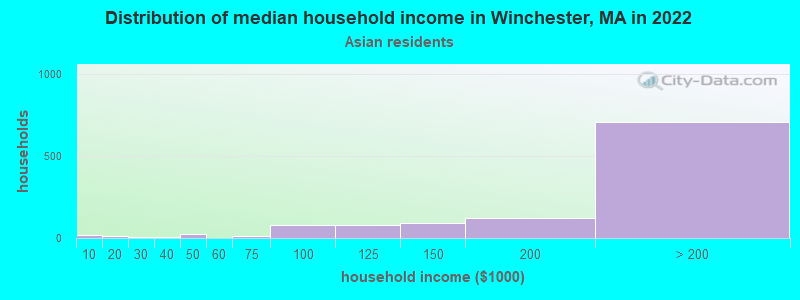
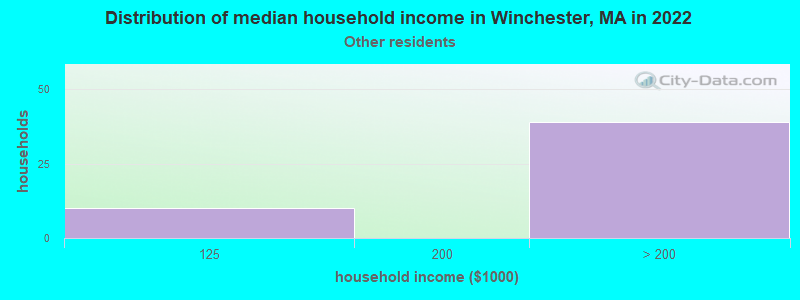
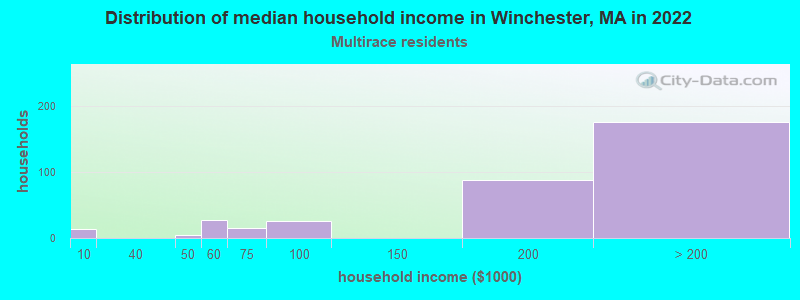
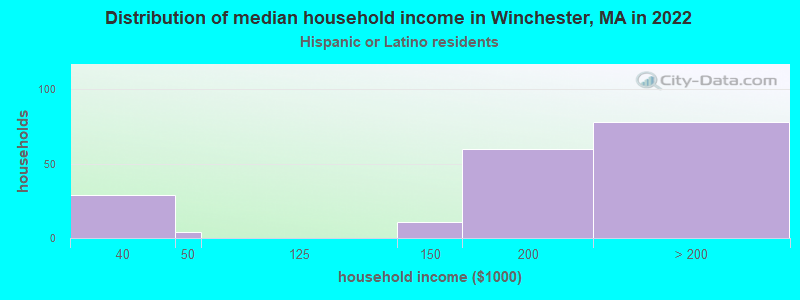
Income and house value in Winchester Median household income in 2022 over $200,000 White non-Hispanic householdersover $200,000 Asian householdersover $200,000 Some other race householdersover $200,000 Two or more races householdersover $200,000 Hispanic or Latino race householdersMedian 2022 house value over $1,000,000 White Non-Hispanic householdersover $1,000,000 Black or African American householders over $1,000,000 Asian householders$918,265 Two or more races householders$833,974 Hispanic or Latino householders
Median age by race in Winchester
46.3 Median age for White residents44.9 47.1 49.3 Median age for Black or African American residents38.9 50.4 32.1 Median age for American Indian / Alaska Native residents31.8 -1,078,313,251.9 40.5 Median age for Asian residents41.7 39.7 -514,227,641.8 Median age for Native Hawaiian / Pacific Islander residents-513,131,312.6 -508,717,948.2 19.6 Median age for Other race residents12.6 21.6 23.9 Median age for Two or more races residents19.0 24.8 46.4 Median age for White alone residents44.8 47.3 39.7 Median age for Hispanic or Latino residents40.2 39.4
Owner/renter occupied households by race in Winchester
House owners and renters - White residents 5,224 83.6% Owner occupied1,026 16.4% Renter occupiedHouse owners and renters - Black or African American residents 147 57.9% Owner occupied107 42.1% Renter occupiedHouse owners and renters - American Indian / Alaska Native residents 13 100.0% Owner occupiedHouse owners and renters - Asian residents 1,098 90.5% Owner occupied115 9.5% Renter occupiedHouse owners and renters - Other race residents 42 100.0% Owner occupiedHouse owners and renters - Two or more races residents 274 80.0% Owner occupied69 20.0% Renter occupiedHouse owners and renters - White alone residents 5,151 83.2% Owner occupied1,042 16.8% Renter occupiedHouse owners and renters - Hispanic or Latino residents 138 80.9% Owner occupied33 19.1% Renter occupied
Language usage in Winchester
English speakers - Total 73.5% of residents of Winchester speak English at home.
2.2% of residents speak Spanish at home 416 89.8% Speak English very well47 10.2% Speak English less than very well24.2% of residents speak other language at home 3,986 77.0% Speak English very well1,190 23.0% Speak English less than very well
English speakers - Born in the United States 89.8% of residents of Winchester speak English at home.
0.5% of residents speak Spanish at home 32 100.0% Speak English very well10.1% of residents speak other language at home 598 94.6% Speak English very well34 5.4% Speak English less than very well
English speakers - Native, born elsewhere 60.0% of residents of Winchester speak English at home.
14.7% of residents speak Spanish at home 60 85.7% Speak English very well10 14.3% Speak English less than very well20.0% of residents speak other language at home 95 100.0% Speak English very well
English speakers - Foreign-born 18.5% of residents of Winchester speak English at home.
7.1% of residents speak Spanish at home 288 88.9% Speak English very well36 11.1% Speak English less than very well73.9% of residents speak other language at home 2,348 69.3% Speak English very well1,038 30.7% Speak English less than very well
White (Caucasian) - Speak only English Native:
93.8% (12,842)Foreign-born:
33.1% (514)
White (Caucasian) - Speak another language Native:
6.1% (830)Foreign-born:
66.5% (1,030)
Black or African American - Speak only English Native:
69.6% (239)Foreign-born:
23.5% (48)
Black or African American - Speak another language Native:
32.5% (112)Foreign-born:
76.3% (156)
Asian - Speak only English Native:
48.1% (643)Foreign-born:
9.4% (213)
Asian - Speak another language Native:
51.9% (695)Foreign-born:
90.9% (2,061)
Other race - Speak only English Native:
100.0% (193)Foreign-born:
36.9% (29)
Other race - Speak another language Native:
13.3% (26)Foreign-born:
66.2% (53)
Two or more races - Speak only English Native:
83.2% (997)Foreign-born:
4.9% (14)
Two or more races - Speak another language Native:
14.7% (176)Foreign-born:
95.3% (265)
White alone - Speak only English Native:
93.3% (12,829)Foreign-born:
33.8% (514)
White alone - Speak another language Native:
6.7% (917)Foreign-born:
65.4% (994)
Hispanic or Latino - Speak only English Native:
62.4% (177)Foreign-born:
1.7% (4)
Hispanic or Latino - Speak another language Native:
39.4% (112)Foreign-born:
98.3% (251)
Foreign-born residents in Winchester 4,630 residents are foreign born (10.1% Asia , 6.1% Europe , 2.1% Latin America ).
This city:
20.4%Massachusetts:
17.6%
Marital status for residents in Winchester Marital status - White (Caucasian) population 15 years and over
Males 25.6% Never married67.9% Now married0.9% Separated1.7% Widowed4.0% DivorcedFemales 21.8% Never married57.1% Now married0.3% Separated11.0% Widowed9.8% DivorcedWomen who gave birth in the past 12 months Now married:
100.0% (160)Unmarried:
0.0% (0)
Women who did not give birth in the past 12 months Now married:
52.5% (1,438)Unmarried:
47.5% (1,301)
Marital status - Black or African American population 15 years and over
Males 45.8% Never married54.2% Now married0.0% Separated0.0% Widowed0.0% DivorcedFemales 18.0% Never married61.3% Now married0.0% Separated9.0% Widowed11.7% DivorcedWomen who did not give birth in the past 12 months Now married:
51.1% (70)Unmarried:
48.9% (67)
Marital status - American Indian / Alaska Native population 15 years and over
Males 74.4% Never married25.6% Now married0.0% Separated0.0% Widowed0.0% DivorcedFemales 53.8% Never married46.2% Now married0.0% Separated0.0% Widowed0.0% DivorcedWomen who did not give birth in the past 12 months Now married:
0.0% (0)Unmarried:
100.0% (8)
Marital status - Asian population 15 years and over
Males 12.7% Never married80.2% Now married0.5% Separated0.8% Widowed5.8% DivorcedFemales 16.9% Never married72.2% Now married0.0% Separated7.2% Widowed3.8% DivorcedWomen who gave birth in the past 12 months Now married:
100.0% (39)Unmarried:
0.0% (0)
Women who did not give birth in the past 12 months Now married:
73.2% (735)Unmarried:
26.8% (270)
Marital status - Other race population 15 years and over
Males 53.7% Never married46.3% Now married0.0% Separated0.0% Widowed0.0% DivorcedFemales 18.0% Never married72.0% Now married0.0% Separated0.0% Widowed10.0% DivorcedWomen who did not give birth in the past 12 months Now married:
78.0% (75)Unmarried:
22.0% (21)
Marital status - Two or more races population 15 years and over
Males 55.0% Never married41.5% Now married0.0% Separated0.0% Widowed3.5% DivorcedFemales 43.8% Never married20.8% Now married0.0% Separated11.6% Widowed23.8% DivorcedWomen who did not give birth in the past 12 months Now married:
21.1% (108)Unmarried:
78.9% (404)
Marital status - White alone, not Hispanic / Latino population 15 years and over
Males 25.9% Never married67.5% Now married0.9% Separated1.7% Widowed4.0% DivorcedFemales 22.0% Never married57.3% Now married0.3% Separated10.9% Widowed9.4% DivorcedWomen who gave birth in the past 12 months Now married:
100.0% (163)Unmarried:
0.0% (0)
Women who did not give birth in the past 12 months Now married:
52.7% (1,436)Unmarried:
47.3% (1,286)
Marital status - Hispanic or Latino population 15 years and over
Males 48.2% Never married51.8% Now married0.0% Separated0.0% Widowed0.0% DivorcedFemales 16.7% Never married41.2% Now married0.0% Separated16.3% Widowed25.8% DivorcedWomen who did not give birth in the past 12 months Now married:
46.7% (80)Unmarried:
53.3% (91)
Ancestries in Winchester
1,457 13.5% Irish1,284 11.9% Italian458 4.3% English316 2.9% Greek315 2.9% American309 2.9% European268 2.5% German174 1.6% Armenian155 1.4% Eastern European131 1.2% Bulgarian129 1.2% Haitian126 1.2% Jamaican106 1.0% French Canadian98 0.9% French96 0.9% Polish94 0.9% Russian89 0.8% Scottish88 0.8% Romanian84 0.8% Nigerian78 0.7% Brazilian73 0.7% Portuguese69 0.6% British68 0.6% Swedish62 0.6% Northern European62 0.6% Dutch55 0.5% Turkish54 0.5% Scotch-Irish47 0.4% Ukrainian38 0.4% Danish26 0.2% Canadian24 0.2% Iraqi24 0.2% Egyptian23 0.2% Finnish17 0.2% Syrian17 0.2% British West Indian16 0.1% Belgian14 0.1% Iranian11 0.1% Norwegian10 0.09% Moroccan8 0.07% South African6 0.06% Welsh4 0.04% Croatian
Children Nativity (place of birth) in Winchester
Children under 6 years - Living with two parents Both parents native 1,094 100.0% NativeBoth parents foreign-born 241 88.5% Native31 11.5% Foreign-bornOne native, one foreign-born parent 162 100.0% NativeChildren under 6 years - Living with one parent Native parent 179 100.0% NativeForeign-born parent 92 100.0% NativeChildren 6 to 17 years - Living with two parents Both parents native 2,055 100.0% NativeBoth parents foreign-born 881 82.4% Native189 17.6% Foreign-bornOne native, one foreign-born parent 608 100.0% NativeChildren 6 to 17 years - Living with one parent Native parent 271 100.0% NativeForeign-born parent 152 58.5% Native107 41.5% Foreign-born
Grandparents responsible for own grandchildren in Winchester
Grandparents (30 to 59 years) White / Caucasian 14 100.0% Not responsible for grandchildrenAsian 23 100.0% Not responsible for grandchildrenWhite alone, not Hispanic / Latino 16 100.0% Not responsible for grandchildrenGrandparents (60 years and over) White / Caucasian 49 28.9% Responsible for grandchildren122 71.1% Not responsible for grandchildrenAsian 27 13.6% Responsible for grandchildren173 86.4% Not responsible for grandchildrenWhite alone, not Hispanic / Latino 50 29.1% Responsible for grandchildren121 70.9% Not responsible for grandchildren