Races in Wade Hampton, South Carolina (SC) Detailed Stats
Data:
Races - White alone (%)
Races - White alone (% change since 2000)
Races - Black alone (%)
Races - Black alone (% change since 2000)
Races - American Indian alone (%)
Races - American Indian alone (% change since 2000)
Races - Asian alone (%)
Races - Asian alone (% change since 2000)
Races - Hispanic (%)
Races - Hispanic (% change since 2000)
Races - Native Hawaiian and Other Pacific Islander alone (%)
Races - Native Hawaiian and Other Pacific Islander alone (% change since 2000)
Races - Two or more races(%)
Races - Two or more races(% change since 2000)
Races - Other race alone (%)
Races - Other race alone (% change since 2000)
Racial diversity
Place of birth - Born in state of residence (%)
Place of birth - Born in state of residence (%) - White
Place of birth - Born in state of residence (%) - Black or African American
Place of birth - Born in state of residence (%) - Asian
Place of birth - Born in state of residence (%) - Hispanic or Latino
Place of birth - Born in state of residence (%) - American Indian and Alaska Native
Place of birth - Born in state of residence (%) - Multirace
Place of birth - Born in state of residence (%) - Other Race
Place of birth - Born in other state (%)
Place of birth - Born in other state (%) - White
Place of birth - Born in other state (%) - Black or African American
Place of birth - Born in other state (%) - Asian
Place of birth - Born in other state (%) - Hispanic or Latino
Place of birth - Born in other state (%) - American Indian and Alaska Native
Place of birth - Born in other state (%) - Multirace
Place of birth - Born in other state (%) - Other Race
Place of birth - Native, outside of US (%)
Place of birth - Native, outside of US (%) - White
Place of birth - Native, outside of US (%) - Black or African American
Place of birth - Native, outside of US (%) - Asian
Place of birth - Native, outside of US (%) - Hispanic or Latino
Place of birth - Native, outside of US (%) - American Indian and Alaska Native
Place of birth - Native, outside of US (%) - Multirace
Place of birth - Native, outside of US (%) - Other Race
Place of birth - Foreign born (%)
Place of birth - Foreign born (%) - White
Place of birth - Foreign born (%) - Black or African American
Place of birth - Foreign born (%) - Asian
Place of birth - Foreign born (%) - Hispanic or Latino
Place of birth - Foreign born (%) - American Indian and Alaska Native
Place of birth - Foreign born (%) - Multirace
Place of birth - Foreign born (%) - Other Race
Residents speaking English at home (%)
Residents speaking English at home - Born in the United States (%)
Residents speaking English at home - Native, born elsewhere (%)
Residents speaking English at home - Foreign born (%)
Residents speaking Spanish at home (%)
Residents speaking Spanish at home - Born in the United States (%)
Residents speaking Spanish at home - Native, born elsewhere (%)
Residents speaking Spanish at home - Foreign born (%)
Residents speaking other language at home (%)
Residents speaking other language at home - Born in the United States (%)
Residents speaking other language at home - Native, born elsewhere (%)
Residents speaking other language at home - Foreign born (%)
Marital status - Never married (%)
Marital status - Now married (%)
Marital status - Separated (%)
Marital status - Widowed (%)
Marital status - Divorced (%)
Ancestries Reported - Arab (%)
Ancestries Reported - Czech (%)
Ancestries Reported - Danish (%)
Ancestries Reported - Dutch (%)
Ancestries Reported - English (%)
Ancestries Reported - French (%)
Ancestries Reported - French Canadian (%)
Ancestries Reported - German (%)
Ancestries Reported - Greek (%)
Ancestries Reported - Hungarian (%)
Ancestries Reported - Irish (%)
Ancestries Reported - Italian (%)
Ancestries Reported - Lithuanian (%)
Ancestries Reported - Norwegian (%)
Ancestries Reported - Polish (%)
Ancestries Reported - Portuguese (%)
Ancestries Reported - Russian (%)
Ancestries Reported - Scotch-Irish (%)
Ancestries Reported - Scottish (%)
Ancestries Reported - Slovak (%)
Ancestries Reported - Subsaharan African (%)
Ancestries Reported - Swedish (%)
Ancestries Reported - Swiss (%)
Ancestries Reported - Ukrainian (%)
Ancestries Reported - United States (%)
Ancestries Reported - Welsh (%)
Ancestries Reported - West Indian (%)
Ancestries Reported - Other (%)
Geographical mobility - Same house 1 year ago (%)
Geographical mobility - Same house 1 year ago (%) - White
Geographical mobility - Same house 1 year ago (%) - Black or African American
Geographical mobility - Same house 1 year ago (%) - Asian
Geographical mobility - Same house 1 year ago (%) - Hispanic or Latino
Geographical mobility - Same house 1 year ago (%) - American Indian and Alaska Native
Geographical mobility - Same house 1 year ago (%) - Multirace
Geographical mobility - Same house 1 year ago (%) - Other Race
Geographical mobility - Moved within same county (%)
Geographical mobility - Moved within same county (%) - White
Geographical mobility - Moved within same county (%) - Black or African American
Geographical mobility - Moved within same county (%) - Asian
Geographical mobility - Moved within same county (%) - Hispanic or Latino
Geographical mobility - Moved within same county (%) - American Indian and Alaska Native
Geographical mobility - Moved within same county (%) - Multirace
Geographical mobility - Moved within same county (%) - Other Race
Geographical mobility - Moved from different county within same state (%)
Geographical mobility - Moved from different county within same state (%) - White
Geographical mobility - Moved from different county within same state (%) - Black or African American
Geographical mobility - Moved from different county within same state (%) - Asian
Geographical mobility - Moved from different county within same state (%) - Hispanic or Latino
Geographical mobility - Moved from different county within same state (%) - American Indian and Alaska Native
Geographical mobility - Moved from different county within same state (%) - Multirace
Geographical mobility - Moved from different county within same state (%) - Other Race
Geographical mobility - Moved from different state (%)
Geographical mobility - Moved from different state (%) - White
Geographical mobility - Moved from different state (%) - Black or African American
Geographical mobility - Moved from different state (%) - Asian
Geographical mobility - Moved from different state (%) - Hispanic or Latino
Geographical mobility - Moved from different state (%) - American Indian and Alaska Native
Geographical mobility - Moved from different state (%) - Multirace
Geographical mobility - Moved from different state (%) - Other Race
Geographical mobility - Moved from abroad (%)
Geographical mobility - Moved from abroad (%) - White
Geographical mobility - Moved from abroad (%) - Black or African American
Geographical mobility - Moved from abroad (%) - Asian
Geographical mobility - Moved from abroad (%) - Hispanic or Latino
Geographical mobility - Moved from abroad (%) - American Indian and Alaska Native
Geographical mobility - Moved from abroad (%) - Multirace
Geographical mobility - Moved from abroad (%) - Other Race
Place of birth for the foreign-born population - Ireland (%)
Place of birth for the foreign-born population - Denmark (%)
Place of birth for the foreign-born population - Norway (%)
Place of birth for the foreign-born population - Sweden (%)
Place of birth for the foreign-born population - United Kingdom (%)
Place of birth for the foreign-born population - England (%)
Place of birth for the foreign-born population - Scotland (%)
Place of birth for the foreign-born population - Other Northern Europe (%)
Place of birth for the foreign-born population - Austria (%)
Place of birth for the foreign-born population - Belgium (%)
Place of birth for the foreign-born population - France (%)
Place of birth for the foreign-born population - Germany (%)
Place of birth for the foreign-born population - Netherlands (%)
Place of birth for the foreign-born population - Switzerland (%)
Place of birth for the foreign-born population - Other Western Europe (%)
Place of birth for the foreign-born population - Greece (%)
Place of birth for the foreign-born population - Italy (%)
Place of birth for the foreign-born population - Portugal (%)
Place of birth for the foreign-born population - Spain (%)
Place of birth for the foreign-born population - Other Southern Europe (%)
Place of birth for the foreign-born population - Albania (%)
Place of birth for the foreign-born population - Belarus (%)
Place of birth for the foreign-born population - Bosnia and Herzegovina (%)
Place of birth for the foreign-born population - Bulgaria (%)
Place of birth for the foreign-born population - Croatia (%)
Place of birth for the foreign-born population - Czechoslovakia (%)
Place of birth for the foreign-born population - Hungary (%)
Place of birth for the foreign-born population - Latvia (%)
Place of birth for the foreign-born population - Lithuania (%)
Place of birth for the foreign-born population - North Macedonia (Macedonia) (%)
Place of birth for the foreign-born population - Moldova (%)
Place of birth for the foreign-born population - Poland (%)
Place of birth for the foreign-born population - Romania (%)
Place of birth for the foreign-born population - Russia (%)
Place of birth for the foreign-born population - Serbia (%)
Place of birth for the foreign-born population - Ukraine (%)
Place of birth for the foreign-born population - Other Eastern Europe (%)
Place of birth for the foreign-born population - China (%)
Place of birth for the foreign-born population - Hong Kong (%)
Place of birth for the foreign-born population - Taiwan (%)
Place of birth for the foreign-born population - Japan (%)
Place of birth for the foreign-born population - Korea (%)
Place of birth for the foreign-born population - Other Eastern Asia (%)
Place of birth for the foreign-born population - Afghanistan (%)
Place of birth for the foreign-born population - Bangladesh (%)
Place of birth for the foreign-born population - India (%)
Place of birth for the foreign-born population - Iran (%)
Place of birth for the foreign-born population - Kazakhstan (%)
Place of birth for the foreign-born population - Nepal (%)
Place of birth for the foreign-born population - Pakistan (%)
Place of birth for the foreign-born population - Sri Lanka (%)
Place of birth for the foreign-born population - Uzbekistan (%)
Place of birth for the foreign-born population - Other South Central Asia (%)
Place of birth for the foreign-born population - Burma (%)
Place of birth for the foreign-born population - Cambodia (%)
Place of birth for the foreign-born population - Indonesia (%)
Place of birth for the foreign-born population - Laos (%)
Place of birth for the foreign-born population - Malaysia (%)
Place of birth for the foreign-born population - Philippines (%)
Place of birth for the foreign-born population - Singapore (%)
Place of birth for the foreign-born population - Thailand (%)
Place of birth for the foreign-born population - Vietnam (%)
Place of birth for the foreign-born population - Other South Eastern Asia (%)
Place of birth for the foreign-born population - Armenia (%)
Place of birth for the foreign-born population - Iraq (%)
Place of birth for the foreign-born population - Israel (%)
Place of birth for the foreign-born population - Jordan (%)
Place of birth for the foreign-born population - Kuwait (%)
Place of birth for the foreign-born population - Lebanon (%)
Place of birth for the foreign-born population - Saudi Arabia (%)
Place of birth for the foreign-born population - Syria (%)
Place of birth for the foreign-born population - Turkey (%)
Place of birth for the foreign-born population - Yemen (%)
Place of birth for the foreign-born population - Other Western Asia (%)
Place of birth for the foreign-born population - Eritrea (%)
Place of birth for the foreign-born population - Ethiopia (%)
Place of birth for the foreign-born population - Kenya (%)
Place of birth for the foreign-born population - Somalia (%)
Place of birth for the foreign-born population - Uganda (%)
Place of birth for the foreign-born population - Zimbabwe (%)
Place of birth for the foreign-born population - Other Eastern Africa (%)
Place of birth for the foreign-born population - Cameroon (%)
Place of birth for the foreign-born population - Congo (%)
Place of birth for the foreign-born population - Democratic Republic of Congo (Zaire) (%)
Place of birth for the foreign-born population - Other Middle Africa (%)
Place of birth for the foreign-born population - Egypt (%)
Place of birth for the foreign-born population - Morocco (%)
Place of birth for the foreign-born population - Sudan (%)
Place of birth for the foreign-born population - Other Northern Africa (%)
Place of birth for the foreign-born population - South Africa (%)
Place of birth for the foreign-born population - Other Southern Africa (%)
Place of birth for the foreign-born population - Cabo Verde (%)
Place of birth for the foreign-born population - Ghana (%)
Place of birth for the foreign-born population - Liberia (%)
Place of birth for the foreign-born population - Nigeria (%)
Place of birth for the foreign-born population - Senegal (%)
Place of birth for the foreign-born population - Sierra Leone (%)
Place of birth for the foreign-born population - Other Western Africa (%)
Place of birth for the foreign-born population - Australia (%)
Place of birth for the foreign-born population - New Zealand (%)
Place of birth for the foreign-born population - Fiji (%)
Place of birth for the foreign-born population - Micronesia (%)
Place of birth for the foreign-born population - Bahamas (%)
Place of birth for the foreign-born population - Barbados (%)
Place of birth for the foreign-born population - Cuba (%)
Place of birth for the foreign-born population - Dominica (%)
Place of birth for the foreign-born population - Dominican Republic (%)
Place of birth for the foreign-born population - Grenada (%)
Place of birth for the foreign-born population - Haiti (%)
Place of birth for the foreign-born population - Jamaica (%)
Place of birth for the foreign-born population - St. Vincent and the Grenadines (%)
Place of birth for the foreign-born population - Trinidad and Tobago (%)
Place of birth for the foreign-born population - West Indies (%)
Place of birth for the foreign-born population - Other Caribbean (%)
Place of birth for the foreign-born population - Belize (%)
Place of birth for the foreign-born population - Costa Rica (%)
Place of birth for the foreign-born population - El Salvador (%)
Place of birth for the foreign-born population - Guatemala (%)
Place of birth for the foreign-born population - Honduras (%)
Place of birth for the foreign-born population - Mexico (%)
Place of birth for the foreign-born population - Nicaragua (%)
Place of birth for the foreign-born population - Panama (%)
Place of birth for the foreign-born population - Other Central America (%)
Place of birth for the foreign-born population - Argentina (%)
Place of birth for the foreign-born population - Bolivia (%)
Place of birth for the foreign-born population - Brazil (%)
Place of birth for the foreign-born population - Chile (%)
Place of birth for the foreign-born population - Colombia (%)
Place of birth for the foreign-born population - Ecuador (%)
Place of birth for the foreign-born population - Guyana (%)
Place of birth for the foreign-born population - Peru (%)
Place of birth for the foreign-born population - Uruguay (%)
Place of birth for the foreign-born population - Venezuela (%)
Place of birth for the foreign-born population - Other South America (%)
Place of birth for the foreign-born population - Canada (%)
Place of birth for the foreign-born population - Other Northern America (%)
Place of birth for the foreign-born population - Other (%)
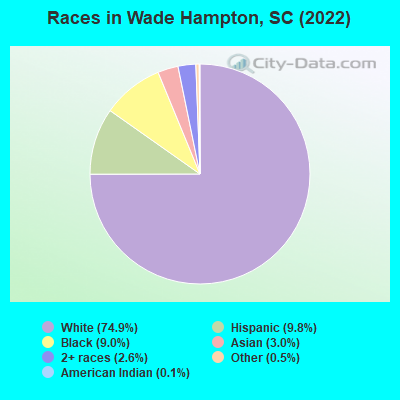
According to 2022 data, the most numerous races in Wade Hampton, SC are White alone (16,330 residents), Black alone (1,955 residents), and Hispanic (2,134 residents). 87.7% of Wade Hampton residents speak English at home. 8.3% of Wade Hampton, SC residents are foreign-born (4.8% born in Latin America, 2.9% born in Asia), which is 39.5% greater than the foreign-born rate of 5.0% across the entire state of South Carolina.
Race distribution in Wade Hampton
2000 2022
2,652,291 66.1% White alone 1,178,486 29.4% Black alone 95,076 2.4% Hispanic 35,568 0.9% Asian alone 33,290 0.8% Two or more races 12,765 0.3% American Indian alone 3,266 0.08% Other race alone 1,270 0.03% Native Hawaiian and Other
3,301,739 62.5% White alone 1,313,290 24.9% Black alone 343,783 6.5% Hispanic 190,508 3.6% Two or more races 89,888 1.7% Asian alone 29,390 0.6% Other race alone 12,112 0.2% American Indian alone 1,924 0.04% Native Hawaiian and Other
Income and house value in Wade Hampton Median household income in 2022 $75,742 White non-Hispanic householders$54,042 Black householders$142,494 American Indian and Alaska Native householders$105,797 Asian householders$40,993 Some other race householders$57,582 Two or more races householders$48,307 Hispanic or Latino race householdersMedian 2022 house value $339,798 White Non-Hispanic householders$337,485 Black or African American householders $340,569 Asian householders$260,632 Some other race householders$334,143 Two or more races householders$239,041 Hispanic or Latino householders
Median age by race in Wade Hampton
44.0 Median age for White residents43.7 44.1 44.6 Median age for Black or African American residents44.9 46.7 37.5 Median age for American Indian / Alaska Native residents43.9 37.4 39.2 Median age for Asian residents38.8 35.7 -698,412,697.7 Median age for Native Hawaiian / Pacific Islander residents-551,574,375.1 -1,016,109,044.8 23.5 Median age for Other race residents20.6 25.9 23.4 Median age for Two or more races residents21.5 35.9 43.9 Median age for White alone residents43.9 43.7 24.4 Median age for Hispanic or Latino residents22.8 26.7
Owner/renter occupied households by race in Wade Hampton
House owners and renters - White residents 5,400 73.8% Owner occupied1,920 26.2% Renter occupiedHouse owners and renters - Black or African American residents 96 9.7% Owner occupied890 90.3% Renter occupiedHouse owners and renters - American Indian / Alaska Native residents 39 90.4% Owner occupied4 9.6% Renter occupiedHouse owners and renters - Asian residents 218 77.1% Owner occupied65 22.9% Renter occupiedHouse owners and renters - Other race residents 100 24.5% Owner occupied309 75.5% Renter occupiedHouse owners and renters - Two or more races residents 298 70.8% Owner occupied123 29.2% Renter occupiedHouse owners and renters - White alone residents 5,333 73.5% Owner occupied1,919 26.5% Renter occupiedHouse owners and renters - Hispanic or Latino residents 323 46.5% Owner occupied372 53.5% Renter occupied
Language usage in Wade Hampton
English speakers - Total 87.7% of residents of Wade Hampton speak English at home.
7.7% of residents speak Spanish at home 700 44.7% Speak English very well867 55.3% Speak English less than very well4.4% of residents speak other language at home 494 54.3% Speak English very well416 45.7% Speak English less than very well
English speakers - Born in the United States 95.8% of residents of Wade Hampton speak English at home.
3.0% of residents speak Spanish at home 186 70.7% Speak English very well77 29.3% Speak English less than very well1.1% of residents speak other language at home 93 93.9% Speak English very well6 6.1% Speak English less than very well
English speakers - Native, born elsewhere 62.6% of residents of Wade Hampton speak English at home.
31.9% of residents speak Spanish at home 87 78.4% Speak English very well24 21.6% Speak English less than very well3.4% of residents speak other language at home 12 100.0% Speak English very well
English speakers - Foreign-born 13.8% of residents of Wade Hampton speak English at home.
46.6% of residents speak Spanish at home 195 24.7% Speak English very well595 75.3% Speak English less than very well35.1% of residents speak other language at home 177 29.7% Speak English very well418 70.3% Speak English less than very well
White (Caucasian) - Speak only English Native:
98.3% (14,993)Foreign-born:
37.1% (137)
White (Caucasian) - Speak another language Native:
1.8% (274)Foreign-born:
60.3% (222)
American Indian / Alaska Native - Speak another language Native:
52.1% (33)Foreign-born:
100.0% (74)
Asian - Speak only English Native:
61.1% (113)Foreign-born:
17.1% (68)
Asian - Speak another language Native:
34.5% (64)Foreign-born:
82.9% (330)
Other race - Speak another language Native:
72.2% (465)Foreign-born:
96.2% (436)
Two or more races - Speak only English Native:
70.0% (503)Foreign-born:
4.5% (22)
Two or more races - Speak another language Native:
30.2% (217)Foreign-born:
95.4% (464)
White alone - Speak only English Native:
98.4% (14,994)Foreign-born:
48.3% (136)
White alone - Speak another language Native:
1.6% (237)Foreign-born:
51.8% (146)
Hispanic or Latino - Speak only English Native:
35.2% (336)Foreign-born:
1.5% (13)
Hispanic or Latino - Speak another language Native:
61.0% (581)Foreign-born:
96.5% (842)
Foreign-born residents in Wade Hampton 1,804 residents are foreign born (4.8% Latin America , 2.9% Asia ).
This city:
8.3%South Carolina:
5.3%
Marital status for residents in Wade Hampton Marital status - White (Caucasian) population 15 years and over
Males 25.1% Never married59.1% Now married0.5% Separated5.2% Widowed10.1% DivorcedFemales 22.2% Never married52.4% Now married1.2% Separated8.8% Widowed15.4% DivorcedWomen who gave birth in the past 12 months Now married:
89.9% (161)Unmarried:
10.1% (18)
Women who did not give birth in the past 12 months Now married:
50.6% (1,824)Unmarried:
49.4% (1,778)
Marital status - Black or African American population 15 years and over
Males 42.4% Never married26.0% Now married6.4% Separated1.2% Widowed24.0% DivorcedFemales 47.2% Never married14.2% Now married5.8% Separated15.8% Widowed17.0% DivorcedWomen who gave birth in the past 12 months Now married:
0.0% (0)Unmarried:
100.0% (12)
Women who did not give birth in the past 12 months Now married:
17.0% (99)Unmarried:
83.0% (482)
Marital status - American Indian / Alaska Native population 15 years and over
Males 41.1% Never married53.6% Now married5.4% Separated0.0% Widowed0.0% DivorcedFemales 0.0% Never married100.0% Now married0.0% Separated0.0% Widowed0.0% DivorcedMarital status - Asian population 15 years and over
Males 13.9% Never married81.4% Now married0.0% Separated0.0% Widowed4.6% DivorcedFemales 26.2% Never married44.8% Now married7.8% Separated14.5% Widowed6.7% DivorcedWomen who gave birth in the past 12 months Now married:
100.0% (45)Unmarried:
0.0% (0)
Women who did not give birth in the past 12 months Now married:
28.0% (49)Unmarried:
72.0% (125)
Marital status - Other race population 15 years and over
Males 47.6% Never married52.4% Now married0.0% Separated0.0% Widowed0.0% DivorcedFemales 34.8% Never married47.6% Now married4.3% Separated0.0% Widowed13.4% DivorcedWomen who did not give birth in the past 12 months Now married:
47.2% (188)Unmarried:
52.8% (211)
Marital status - Two or more races population 15 years and over
Males 48.2% Never married39.6% Now married2.3% Separated0.0% Widowed9.8% DivorcedFemales 27.3% Never married33.4% Now married0.0% Separated27.9% Widowed11.3% DivorcedWomen who gave birth in the past 12 months Now married:
0.0% (0)Unmarried:
100.0% (33)
Women who did not give birth in the past 12 months Now married:
42.3% (93)Unmarried:
57.7% (127)
Marital status - White alone, not Hispanic / Latino population 15 years and over
Males 24.3% Never married60.1% Now married0.5% Separated5.0% Widowed10.1% DivorcedFemales 22.0% Never married52.7% Now married1.2% Separated8.9% Widowed15.2% DivorcedWomen who gave birth in the past 12 months Now married:
89.9% (164)Unmarried:
10.1% (18)
Women who did not give birth in the past 12 months Now married:
50.5% (1,814)Unmarried:
49.5% (1,782)
Marital status - Hispanic or Latino population 15 years and over
Males 47.4% Never married43.3% Now married1.2% Separated3.2% Widowed4.8% DivorcedFemales 32.8% Never married51.1% Now married2.3% Separated0.0% Widowed13.8% DivorcedWomen who gave birth in the past 12 months Now married:
0.0% (0)Unmarried:
100.0% (32)
Women who did not give birth in the past 12 months Now married:
58.0% (276)Unmarried:
42.0% (200)
Ancestries in Wade Hampton
2,170 20.1% English978 9.0% American786 7.3% Irish658 6.1% German571 5.3% Scotch-Irish331 3.1% Italian318 2.9% Scottish225 2.1% Arab157 1.5% European103 1.0% French Canadian83 0.8% Greek70 0.6% Swedish67 0.6% Russian61 0.6% French54 0.5% Welsh49 0.5% Assyrian47 0.4% British40 0.4% Armenian38 0.4% Polish36 0.3% Lebanese35 0.3% Northern European33 0.3% Jamaican31 0.3% Dutch23 0.2% Slovak22 0.2% Canadian20 0.2% Brazilian20 0.2% Finnish20 0.2% Norwegian15 0.1% Czech15 0.1% Serbian14 0.1% Hungarian14 0.1% Bulgarian14 0.1% Celtic13 0.1% Ukrainian10 0.09% Belgian8 0.07% Swiss6 0.06% African4 0.04% Turkish4 0.04% Iraqi
Geographical mobility in Wade Hampton Same house 1 year ago 14,555 89.3% White (Caucasian)1,774 91.6% Black or African American116 95.2% American Indian / Alaska Native484 77.0% Asian1,132 90.6% Other race1,073 80.9% Two or more races14,378 88.9% White alone, not Hispanic / Latino1,906 91.9% Hispanic or LatinoMoved within same county 904 5.5% White / Caucasian103 5.3% Black or African American3 2.2% American Indian / Alaska Native88 14.0% Asian55 4.4% Other race44 3.3% Two or more races892 5.5% White alone, not Hispanic / Latino67 3.2% Hispanic or LatinoMoved within same state 285 1.7% White / Caucasian8 0.4% Black or African American22 1.6% Two or more races292 1.8% White alone, not Hispanic / Latino32 1.5% Hispanic or LatinoMoved from different state 455 2.8% White / Caucasian35 1.8% Black or African American91 6.8% Two or more races484 3.0% White alone, not Hispanic / LatinoMoved from abroad 40 0.2% White68 3.5% Black or African American55 4.4% Other race107 8.1% Two or more races43 0.3% White alone, not Hispanic / Latino51 2.5% Hispanic or Latino
Children Nativity (place of birth) in Wade Hampton
Children under 6 years - Living with two parents Both parents native 1,089 100.0% NativeBoth parents foreign-born 112 100.0% NativeOne native, one foreign-born parent 94 100.0% NativeChildren under 6 years - Living with one parent Native parent 191 100.0% NativeForeign-born parent 115 100.0% NativeChildren 6 to 17 years - Living with two parents Both parents native 2,342 99.3% Native16 0.7% Foreign-bornBoth parents foreign-born 247 100.0% NativeOne native, one foreign-born parent 155 100.0% NativeChildren 6 to 17 years - Living with one parent Native parent 585 100.0% NativeForeign-born parent 26 47.5% Native28 52.5% Foreign-born
Grandparents responsible for own grandchildren in Wade Hampton
Grandparents (30 to 59 years) White / Caucasian 12 49.6% Responsible for grandchildren13 50.4% Not responsible for grandchildrenWhite alone, not Hispanic / Latino 13 46.8% Responsible for grandchildren14 53.2% Not responsible for grandchildrenGrandparents (60 years and over) White / Caucasian 27 33.9% Responsible for grandchildren54 66.1% Not responsible for grandchildrenWhite alone, not Hispanic / Latino 28 34.0% Responsible for grandchildren55 66.0% Not responsible for grandchildren