Races in Southeast Hidalgo, Texas (TX) Detailed Stats
Ancestries, Foreign-born residents, place of birth
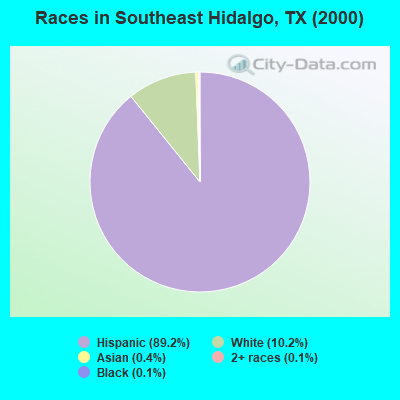
Race distribution in Southeast Hidalgo

- 91,02189.2%Hispanic
- 10,36910.2%White alone
- 3620.4%Asian alone
- 1050.1%Black alone
- 1120.1%Two or more races
- 550.05%American Indian alone
- 210.02%Other race alone
- 60.01%Native Hawaiian and Other
Pacific Islander alone
2000
2022
-
- 10,933,31352.4%White alone
- 6,669,66632.0%Hispanic
- 2,364,25511.3%Black alone
- 554,4452.7%Asian alone
- 230,5671.1%Two or more races
- 68,8590.3%American Indian alone
- 19,9580.10%Other race alone
- 10,7570.05%Native Hawaiian and Other
Pacific Islander alone

-
- 12,070,64240.2%Hispanic
- 11,683,43038.9%White alone
- 3,508,70611.7%Black alone
- 1,608,1735.4%Asian alone
- 956,5603.2%Two or more races
- 125,7630.4%Other race alone
- 47,0230.2%American Indian alone
- 29,2750.10%Native Hawaiian and Other
Pacific Islander alone

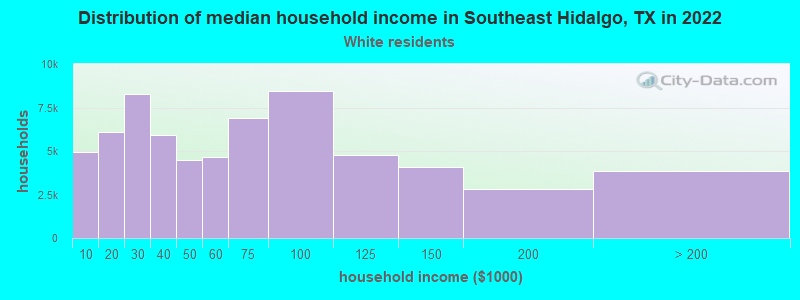
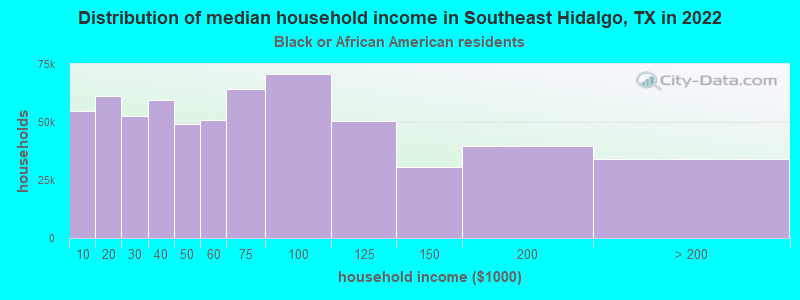
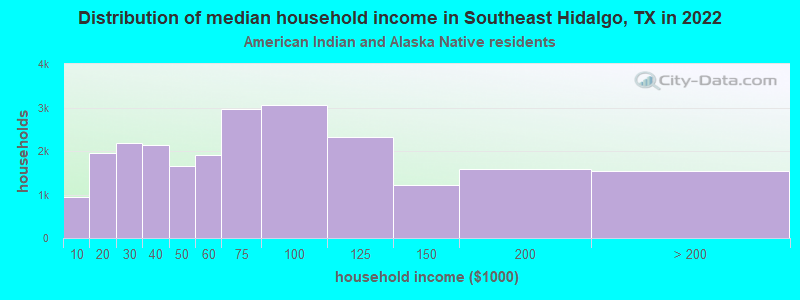
Income and house value in Southeast Hidalgo
- Median household income in 2022
- $53,454White non-Hispanic householders
- $34,637Black householders
- $118,521American Indian and Alaska Native householders
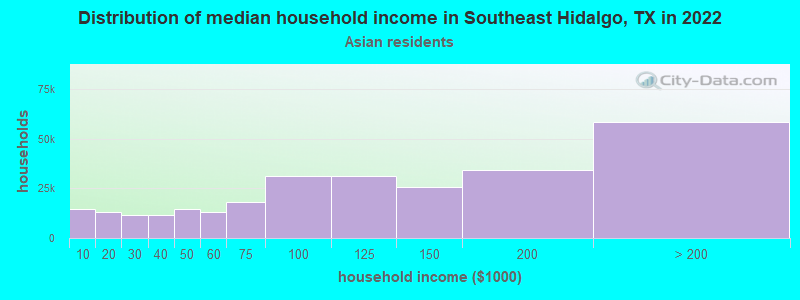
- $88,455Asian householders
- $36,643Some other race householders
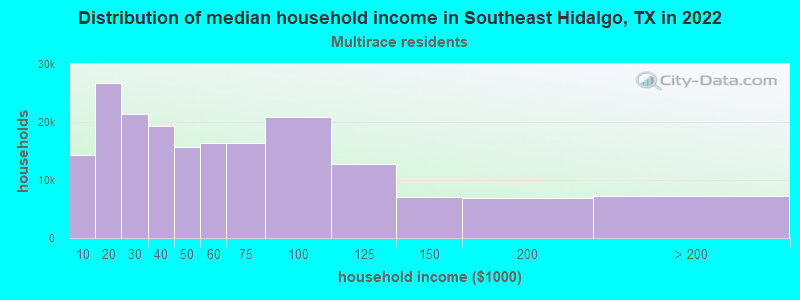
- $51,369Two or more races householders
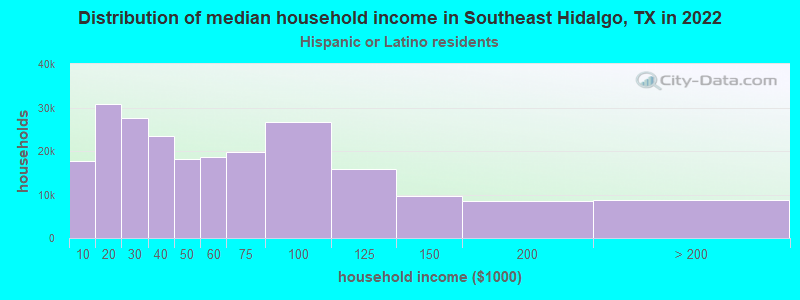
- $44,498Hispanic or Latino race householders
- Median 2022 house value
- $210,827White Non-Hispanic householders
- $73,951Black or African American householders
- $123,162American Indian or Alaska Native householders
- $229,113Asian householders
- $99,497Some other race householders
- $118,052Two or more races householders
- $102,186Hispanic or Latino householders
Household income for White non-Hispanic householders
Household income for Black householders
Household income for American Indian and Alaska Native householders
Household income for Asian householders
Household income for Two or more races householders
Household income for Hispanic or Latino race householders
Zip code: 78596