Races in South Houston, Texas (TX) Detailed Stats
Data:
Races - White alone (%)
Races - White alone (% change since 2000)
Races - Black alone (%)
Races - Black alone (% change since 2000)
Races - American Indian alone (%)
Races - American Indian alone (% change since 2000)
Races - Asian alone (%)
Races - Asian alone (% change since 2000)
Races - Hispanic (%)
Races - Hispanic (% change since 2000)
Races - Native Hawaiian and Other Pacific Islander alone (%)
Races - Native Hawaiian and Other Pacific Islander alone (% change since 2000)
Races - Two or more races(%)
Races - Two or more races(% change since 2000)
Races - Other race alone (%)
Races - Other race alone (% change since 2000)
Racial diversity
Place of birth - Born in state of residence (%)
Place of birth - Born in state of residence (%) - White
Place of birth - Born in state of residence (%) - Black or African American
Place of birth - Born in state of residence (%) - Asian
Place of birth - Born in state of residence (%) - Hispanic or Latino
Place of birth - Born in state of residence (%) - American Indian and Alaska Native
Place of birth - Born in state of residence (%) - Multirace
Place of birth - Born in state of residence (%) - Other Race
Place of birth - Born in other state (%)
Place of birth - Born in other state (%) - White
Place of birth - Born in other state (%) - Black or African American
Place of birth - Born in other state (%) - Asian
Place of birth - Born in other state (%) - Hispanic or Latino
Place of birth - Born in other state (%) - American Indian and Alaska Native
Place of birth - Born in other state (%) - Multirace
Place of birth - Born in other state (%) - Other Race
Place of birth - Native, outside of US (%)
Place of birth - Native, outside of US (%) - White
Place of birth - Native, outside of US (%) - Black or African American
Place of birth - Native, outside of US (%) - Asian
Place of birth - Native, outside of US (%) - Hispanic or Latino
Place of birth - Native, outside of US (%) - American Indian and Alaska Native
Place of birth - Native, outside of US (%) - Multirace
Place of birth - Native, outside of US (%) - Other Race
Place of birth - Foreign born (%)
Place of birth - Foreign born (%) - White
Place of birth - Foreign born (%) - Black or African American
Place of birth - Foreign born (%) - Asian
Place of birth - Foreign born (%) - Hispanic or Latino
Place of birth - Foreign born (%) - American Indian and Alaska Native
Place of birth - Foreign born (%) - Multirace
Place of birth - Foreign born (%) - Other Race
Residents speaking English at home (%)
Residents speaking English at home - Born in the United States (%)
Residents speaking English at home - Native, born elsewhere (%)
Residents speaking English at home - Foreign born (%)
Residents speaking Spanish at home (%)
Residents speaking Spanish at home - Born in the United States (%)
Residents speaking Spanish at home - Native, born elsewhere (%)
Residents speaking Spanish at home - Foreign born (%)
Residents speaking other language at home (%)
Residents speaking other language at home - Born in the United States (%)
Residents speaking other language at home - Native, born elsewhere (%)
Residents speaking other language at home - Foreign born (%)
Marital status - Never married (%)
Marital status - Now married (%)
Marital status - Separated (%)
Marital status - Widowed (%)
Marital status - Divorced (%)
Ancestries Reported - Arab (%)
Ancestries Reported - Czech (%)
Ancestries Reported - Danish (%)
Ancestries Reported - Dutch (%)
Ancestries Reported - English (%)
Ancestries Reported - French (%)
Ancestries Reported - French Canadian (%)
Ancestries Reported - German (%)
Ancestries Reported - Greek (%)
Ancestries Reported - Hungarian (%)
Ancestries Reported - Irish (%)
Ancestries Reported - Italian (%)
Ancestries Reported - Lithuanian (%)
Ancestries Reported - Norwegian (%)
Ancestries Reported - Polish (%)
Ancestries Reported - Portuguese (%)
Ancestries Reported - Russian (%)
Ancestries Reported - Scotch-Irish (%)
Ancestries Reported - Scottish (%)
Ancestries Reported - Slovak (%)
Ancestries Reported - Subsaharan African (%)
Ancestries Reported - Swedish (%)
Ancestries Reported - Swiss (%)
Ancestries Reported - Ukrainian (%)
Ancestries Reported - United States (%)
Ancestries Reported - Welsh (%)
Ancestries Reported - West Indian (%)
Ancestries Reported - Other (%)
Geographical mobility - Same house 1 year ago (%)
Geographical mobility - Same house 1 year ago (%) - White
Geographical mobility - Same house 1 year ago (%) - Black or African American
Geographical mobility - Same house 1 year ago (%) - Asian
Geographical mobility - Same house 1 year ago (%) - Hispanic or Latino
Geographical mobility - Same house 1 year ago (%) - American Indian and Alaska Native
Geographical mobility - Same house 1 year ago (%) - Multirace
Geographical mobility - Same house 1 year ago (%) - Other Race
Geographical mobility - Moved within same county (%)
Geographical mobility - Moved within same county (%) - White
Geographical mobility - Moved within same county (%) - Black or African American
Geographical mobility - Moved within same county (%) - Asian
Geographical mobility - Moved within same county (%) - Hispanic or Latino
Geographical mobility - Moved within same county (%) - American Indian and Alaska Native
Geographical mobility - Moved within same county (%) - Multirace
Geographical mobility - Moved within same county (%) - Other Race
Geographical mobility - Moved from different county within same state (%)
Geographical mobility - Moved from different county within same state (%) - White
Geographical mobility - Moved from different county within same state (%) - Black or African American
Geographical mobility - Moved from different county within same state (%) - Asian
Geographical mobility - Moved from different county within same state (%) - Hispanic or Latino
Geographical mobility - Moved from different county within same state (%) - American Indian and Alaska Native
Geographical mobility - Moved from different county within same state (%) - Multirace
Geographical mobility - Moved from different county within same state (%) - Other Race
Geographical mobility - Moved from different state (%)
Geographical mobility - Moved from different state (%) - White
Geographical mobility - Moved from different state (%) - Black or African American
Geographical mobility - Moved from different state (%) - Asian
Geographical mobility - Moved from different state (%) - Hispanic or Latino
Geographical mobility - Moved from different state (%) - American Indian and Alaska Native
Geographical mobility - Moved from different state (%) - Multirace
Geographical mobility - Moved from different state (%) - Other Race
Geographical mobility - Moved from abroad (%)
Geographical mobility - Moved from abroad (%) - White
Geographical mobility - Moved from abroad (%) - Black or African American
Geographical mobility - Moved from abroad (%) - Asian
Geographical mobility - Moved from abroad (%) - Hispanic or Latino
Geographical mobility - Moved from abroad (%) - American Indian and Alaska Native
Geographical mobility - Moved from abroad (%) - Multirace
Geographical mobility - Moved from abroad (%) - Other Race
Place of birth for the foreign-born population - Ireland (%)
Place of birth for the foreign-born population - Denmark (%)
Place of birth for the foreign-born population - Norway (%)
Place of birth for the foreign-born population - Sweden (%)
Place of birth for the foreign-born population - United Kingdom (%)
Place of birth for the foreign-born population - England (%)
Place of birth for the foreign-born population - Scotland (%)
Place of birth for the foreign-born population - Other Northern Europe (%)
Place of birth for the foreign-born population - Austria (%)
Place of birth for the foreign-born population - Belgium (%)
Place of birth for the foreign-born population - France (%)
Place of birth for the foreign-born population - Germany (%)
Place of birth for the foreign-born population - Netherlands (%)
Place of birth for the foreign-born population - Switzerland (%)
Place of birth for the foreign-born population - Other Western Europe (%)
Place of birth for the foreign-born population - Greece (%)
Place of birth for the foreign-born population - Italy (%)
Place of birth for the foreign-born population - Portugal (%)
Place of birth for the foreign-born population - Spain (%)
Place of birth for the foreign-born population - Other Southern Europe (%)
Place of birth for the foreign-born population - Albania (%)
Place of birth for the foreign-born population - Belarus (%)
Place of birth for the foreign-born population - Bosnia and Herzegovina (%)
Place of birth for the foreign-born population - Bulgaria (%)
Place of birth for the foreign-born population - Croatia (%)
Place of birth for the foreign-born population - Czechoslovakia (%)
Place of birth for the foreign-born population - Hungary (%)
Place of birth for the foreign-born population - Latvia (%)
Place of birth for the foreign-born population - Lithuania (%)
Place of birth for the foreign-born population - North Macedonia (Macedonia) (%)
Place of birth for the foreign-born population - Moldova (%)
Place of birth for the foreign-born population - Poland (%)
Place of birth for the foreign-born population - Romania (%)
Place of birth for the foreign-born population - Russia (%)
Place of birth for the foreign-born population - Serbia (%)
Place of birth for the foreign-born population - Ukraine (%)
Place of birth for the foreign-born population - Other Eastern Europe (%)
Place of birth for the foreign-born population - China (%)
Place of birth for the foreign-born population - Hong Kong (%)
Place of birth for the foreign-born population - Taiwan (%)
Place of birth for the foreign-born population - Japan (%)
Place of birth for the foreign-born population - Korea (%)
Place of birth for the foreign-born population - Other Eastern Asia (%)
Place of birth for the foreign-born population - Afghanistan (%)
Place of birth for the foreign-born population - Bangladesh (%)
Place of birth for the foreign-born population - India (%)
Place of birth for the foreign-born population - Iran (%)
Place of birth for the foreign-born population - Kazakhstan (%)
Place of birth for the foreign-born population - Nepal (%)
Place of birth for the foreign-born population - Pakistan (%)
Place of birth for the foreign-born population - Sri Lanka (%)
Place of birth for the foreign-born population - Uzbekistan (%)
Place of birth for the foreign-born population - Other South Central Asia (%)
Place of birth for the foreign-born population - Burma (%)
Place of birth for the foreign-born population - Cambodia (%)
Place of birth for the foreign-born population - Indonesia (%)
Place of birth for the foreign-born population - Laos (%)
Place of birth for the foreign-born population - Malaysia (%)
Place of birth for the foreign-born population - Philippines (%)
Place of birth for the foreign-born population - Singapore (%)
Place of birth for the foreign-born population - Thailand (%)
Place of birth for the foreign-born population - Vietnam (%)
Place of birth for the foreign-born population - Other South Eastern Asia (%)
Place of birth for the foreign-born population - Armenia (%)
Place of birth for the foreign-born population - Iraq (%)
Place of birth for the foreign-born population - Israel (%)
Place of birth for the foreign-born population - Jordan (%)
Place of birth for the foreign-born population - Kuwait (%)
Place of birth for the foreign-born population - Lebanon (%)
Place of birth for the foreign-born population - Saudi Arabia (%)
Place of birth for the foreign-born population - Syria (%)
Place of birth for the foreign-born population - Turkey (%)
Place of birth for the foreign-born population - Yemen (%)
Place of birth for the foreign-born population - Other Western Asia (%)
Place of birth for the foreign-born population - Eritrea (%)
Place of birth for the foreign-born population - Ethiopia (%)
Place of birth for the foreign-born population - Kenya (%)
Place of birth for the foreign-born population - Somalia (%)
Place of birth for the foreign-born population - Uganda (%)
Place of birth for the foreign-born population - Zimbabwe (%)
Place of birth for the foreign-born population - Other Eastern Africa (%)
Place of birth for the foreign-born population - Cameroon (%)
Place of birth for the foreign-born population - Congo (%)
Place of birth for the foreign-born population - Democratic Republic of Congo (Zaire) (%)
Place of birth for the foreign-born population - Other Middle Africa (%)
Place of birth for the foreign-born population - Egypt (%)
Place of birth for the foreign-born population - Morocco (%)
Place of birth for the foreign-born population - Sudan (%)
Place of birth for the foreign-born population - Other Northern Africa (%)
Place of birth for the foreign-born population - South Africa (%)
Place of birth for the foreign-born population - Other Southern Africa (%)
Place of birth for the foreign-born population - Cabo Verde (%)
Place of birth for the foreign-born population - Ghana (%)
Place of birth for the foreign-born population - Liberia (%)
Place of birth for the foreign-born population - Nigeria (%)
Place of birth for the foreign-born population - Senegal (%)
Place of birth for the foreign-born population - Sierra Leone (%)
Place of birth for the foreign-born population - Other Western Africa (%)
Place of birth for the foreign-born population - Australia (%)
Place of birth for the foreign-born population - New Zealand (%)
Place of birth for the foreign-born population - Fiji (%)
Place of birth for the foreign-born population - Micronesia (%)
Place of birth for the foreign-born population - Bahamas (%)
Place of birth for the foreign-born population - Barbados (%)
Place of birth for the foreign-born population - Cuba (%)
Place of birth for the foreign-born population - Dominica (%)
Place of birth for the foreign-born population - Dominican Republic (%)
Place of birth for the foreign-born population - Grenada (%)
Place of birth for the foreign-born population - Haiti (%)
Place of birth for the foreign-born population - Jamaica (%)
Place of birth for the foreign-born population - St. Vincent and the Grenadines (%)
Place of birth for the foreign-born population - Trinidad and Tobago (%)
Place of birth for the foreign-born population - West Indies (%)
Place of birth for the foreign-born population - Other Caribbean (%)
Place of birth for the foreign-born population - Belize (%)
Place of birth for the foreign-born population - Costa Rica (%)
Place of birth for the foreign-born population - El Salvador (%)
Place of birth for the foreign-born population - Guatemala (%)
Place of birth for the foreign-born population - Honduras (%)
Place of birth for the foreign-born population - Mexico (%)
Place of birth for the foreign-born population - Nicaragua (%)
Place of birth for the foreign-born population - Panama (%)
Place of birth for the foreign-born population - Other Central America (%)
Place of birth for the foreign-born population - Argentina (%)
Place of birth for the foreign-born population - Bolivia (%)
Place of birth for the foreign-born population - Brazil (%)
Place of birth for the foreign-born population - Chile (%)
Place of birth for the foreign-born population - Colombia (%)
Place of birth for the foreign-born population - Ecuador (%)
Place of birth for the foreign-born population - Guyana (%)
Place of birth for the foreign-born population - Peru (%)
Place of birth for the foreign-born population - Uruguay (%)
Place of birth for the foreign-born population - Venezuela (%)
Place of birth for the foreign-born population - Other South America (%)
Place of birth for the foreign-born population - Canada (%)
Place of birth for the foreign-born population - Other Northern America (%)
Place of birth for the foreign-born population - Other (%)
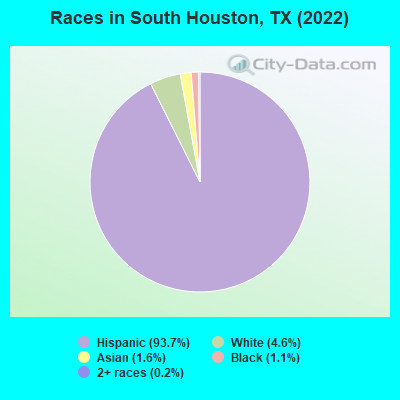
According to 2022 data, the most numerous races in South Houston, TX are Hispanic (15,331 residents), White alone (753 residents), and Black alone (181 residents). 27.8% of South Houston residents speak English at home. 28.4% of South Houston, TX residents are foreign-born (27.1% born in Latin America), which is 40.2% greater than the foreign-born rate of 17.0% across the entire state of Texas.
Race distribution in South Houston
2000 2022
10,933,313 52.4% White alone 6,669,666 32.0% Hispanic 2,364,255 11.3% Black alone 554,445 2.7% Asian alone 230,567 1.1% Two or more races 68,859 0.3% American Indian alone 19,958 0.10% Other race alone 10,757 0.05% Native Hawaiian and Other
12,070,642 40.2% Hispanic 11,683,430 38.9% White alone 3,508,706 11.7% Black alone 1,608,173 5.4% Asian alone 956,560 3.2% Two or more races 125,763 0.4% Other race alone 47,023 0.2% American Indian alone 29,275 0.10% Native Hawaiian and Other
Income and house value in South Houston Median household income in 2022 $50,008 White non-Hispanic householders$73,567 Black householders$143,501 Asian householders$35,137 Some other race householders$69,339 Two or more races householders$49,663 Hispanic or Latino race householdersMedian 2022 house value $180,396 White Non-Hispanic householders$240,528 Black or African American householders$475,181 American Indian or Alaska Native householders$167,609 Some other race householders$161,734 Two or more races householders$169,682 Hispanic or Latino householders
Median age by race in South Houston
28.7 Median age for White residents27.3 29.9 23.4 Median age for Black or African American residents-672,975,814.3 23.4 17.7 Median age for American Indian / Alaska Native residents12.2 -652,037,616.9 45.1 Median age for Asian residents39.8 56.0 -782,795,698.1 Median age for Native Hawaiian / Pacific Islander residents-633,771,929.2 -816,367,264.7 37.4 Median age for Other race residents29.5 42.1 28.4 Median age for Two or more races residents34.1 24.0 59.4 Median age for White alone residents57.8 68.4 27.0 Median age for Hispanic or Latino residents27.7 26.8
Owner/renter occupied households by race in South Houston
House owners and renters - White residents 1,143 60.0% Owner occupied762 40.0% Renter occupiedHouse owners and renters - Black or African American residents 9 9.9% Owner occupied78 90.1% Renter occupiedHouse owners and renters - Asian residents 56 74.7% Owner occupied19 25.3% Renter occupiedHouse owners and renters - Other race residents 348 38.1% Owner occupied566 61.9% Renter occupiedHouse owners and renters - Two or more races residents 1,277 48.2% Owner occupied1,373 51.8% Renter occupiedHouse owners and renters - White alone residents 217 49.4% Owner occupied223 50.6% Renter occupiedHouse owners and renters - Hispanic or Latino residents 2,354 51.7% Owner occupied2,199 48.3% Renter occupied
Language usage in South Houston
English speakers - Total 27.8% of residents of South Houston speak English at home.
71.8% of residents speak Spanish at home 6,936 64.1% Speak English very well3,882 35.9% Speak English less than very well0.8% of residents speak other language at home 13 10.7% Speak English very well108 89.3% Speak English less than very well
English speakers - Born in the United States 35.1% of residents of South Houston speak English at home.
61.0% of residents speak Spanish at home 742 98.7% Speak English very well10 1.3% Speak English less than very well0.8% of residents speak other language at home 10 100.0% Speak English very well
English speakers - Native, born elsewhere 27.3% of residents of South Houston speak English at home.
70.8% of residents speak Spanish at home 47 41.2% Speak English very well67 58.8% Speak English less than very well
English speakers - Foreign-born 4.1% of residents of South Houston speak English at home.
95.7% of residents speak Spanish at home 1,101 24.9% Speak English very well3,321 75.1% Speak English less than very well2.3% of residents speak other language at home 4 3.8% Speak English very well101 96.2% Speak English less than very well
White (Caucasian) - Speak only English Native:
42.9% (1,909)Foreign-born:
4.3% (37)
White (Caucasian) - Speak another language Native:
37.5% (1,670)Foreign-born:
86.0% (751)
Black or African American - Speak only English Native:
99.5% (127)Foreign-born:
87.6% (35)
Asian - Speak only English Native:
94.4% (146)Foreign-born:
8.3% (10)
Asian - Speak another language Native:
6.6% (10)Foreign-born:
91.7% (111)
Other race - Speak only English Native:
25.5% (311)Foreign-born:
1.5% (13)
Other race - Speak another language Native:
74.5% (910)Foreign-born:
98.8% (888)
Two or more races - Speak only English Native:
35.3% (1,982)Foreign-born:
4.5% (125)
Two or more races - Speak another language Native:
66.0% (3,702)Foreign-born:
95.5% (2,665)
Hispanic or Latino - Speak only English Native:
31.6% (2,973)Foreign-born:
3.4% (156)
Hispanic or Latino - Speak another language Native:
68.4% (6,422)Foreign-born:
96.5% (4,437)
Foreign-born residents in South Houston 4,652 residents are foreign born (27.1% Latin America ).
This city:
28.4%Texas:
17.1%
Marital status for residents in South Houston Marital status - White (Caucasian) population 15 years and over
Males 40.6% Never married42.7% Now married5.2% Separated2.8% Widowed8.7% DivorcedFemales 33.4% Never married40.0% Now married11.0% Separated10.5% Widowed5.0% DivorcedWomen who gave birth in the past 12 months Now married:
40.3% (34)Unmarried:
59.7% (50)
Women who did not give birth in the past 12 months Now married:
52.3% (648)Unmarried:
47.7% (592)
Marital status - Black or African American population 15 years and over
Males 46.9% Never married0.0% Now married53.1% Separated0.0% Widowed0.0% DivorcedFemales 79.0% Never married0.0% Now married0.0% Separated6.7% Widowed14.3% DivorcedWomen who did not give birth in the past 12 months Now married:
0.0% (0)Unmarried:
100.0% (112)
Marital status - American Indian / Alaska Native population 15 years and over
Males 100.0% Never married0.0% Now married0.0% Separated0.0% Widowed0.0% DivorcedFemales 100.0% Never married0.0% Now married0.0% Separated0.0% Widowed0.0% DivorcedWomen who did not give birth in the past 12 months Now married:
0.0% (0)Unmarried:
100.0% (9)
Marital status - Asian population 15 years and over
Males 69.4% Never married30.6% Now married0.0% Separated0.0% Widowed0.0% DivorcedFemales 17.6% Never married82.4% Now married0.0% Separated0.0% Widowed0.0% DivorcedWomen who did not give birth in the past 12 months Now married:
43.5% (10)Unmarried:
56.5% (13)
Marital status - Other race population 15 years and over
Males 46.8% Never married33.4% Now married3.4% Separated2.9% Widowed13.5% DivorcedFemales 20.5% Never married27.1% Now married12.1% Separated10.6% Widowed29.8% DivorcedWomen who gave birth in the past 12 months Now married:
100.0% (12)Unmarried:
0.0% (0)
Women who did not give birth in the past 12 months Now married:
33.2% (187)Unmarried:
66.8% (375)
Marital status - Two or more races population 15 years and over
Males 40.2% Never married46.3% Now married3.7% Separated1.6% Widowed8.2% DivorcedFemales 47.9% Never married40.5% Now married1.0% Separated2.8% Widowed7.8% DivorcedWomen who gave birth in the past 12 months Now married:
50.0% (81)Unmarried:
50.0% (81)
Women who did not give birth in the past 12 months Now married:
31.9% (835)Unmarried:
68.1% (1,778)
Marital status - White alone, not Hispanic / Latino population 15 years and over
Males 17.9% Never married50.6% Now married0.0% Separated13.1% Widowed18.4% DivorcedFemales 17.0% Never married45.3% Now married7.8% Separated25.4% Widowed4.5% DivorcedWomen who gave birth in the past 12 months Now married:
100.0% (15)Unmarried:
0.0% (0)
Women who did not give birth in the past 12 months Now married:
82.9% (56)Unmarried:
17.1% (12)
Marital status - Hispanic or Latino population 15 years and over
Males 43.0% Never married42.2% Now married4.7% Separated1.6% Widowed8.5% DivorcedFemales 39.3% Never married38.5% Now married7.0% Separated6.3% Widowed8.9% DivorcedWomen who gave birth in the past 12 months Now married:
43.0% (98)Unmarried:
57.0% (129)
Women who did not give birth in the past 12 months Now married:
40.4% (1,593)Unmarried:
59.6% (2,351)
Ancestries in South Houston
103 0.8% African98 0.7% American83 0.6% English49 0.4% Irish43 0.3% European36 0.3% German18 0.1% Czech17 0.1% Italian14 0.1% Scotch-Irish4 0.03% Basque4 0.03% Cajun4 0.03% French3 0.02% Polish
Children Nativity (place of birth) in South Houston
Children under 6 years - Living with two parents Both parents native 294 100.0% NativeBoth parents foreign-born 80 71.8% Native31 28.2% Foreign-bornOne native, one foreign-born parent 142 100.0% NativeChildren under 6 years - Living with one parent Native parent 609 100.0% NativeForeign-born parent 226 100.0% NativeChildren 6 to 17 years - Living with two parents Both parents native 556 100.0% NativeBoth parents foreign-born 450 84.7% Native81 15.3% Foreign-bornOne native, one foreign-born parent 912 95.6% Native42 4.4% Foreign-bornChildren 6 to 17 years - Living with one parent Native parent 1,023 100.0% NativeForeign-born parent 705 51.5% Native665 48.5% Foreign-born
Grandparents responsible for own grandchildren in South Houston
Grandparents (30 to 59 years) White / Caucasian 23 25.9% Responsible for grandchildren65 74.1% Not responsible for grandchildrenTwo or more races 112 70.6% Responsible for grandchildren47 29.4% Not responsible for grandchildrenWhite alone, not Hispanic / Latino 42 100.0% Not responsible for grandchildrenHispanic or Latino 119 49.5% Responsible for grandchildren122 50.5% Not responsible for grandchildrenGrandparents (60 years and over) White / Caucasian 17 26.1% Responsible for grandchildren47 73.9% Not responsible for grandchildrenTwo or more races 28 11.7% Responsible for grandchildren215 88.3% Not responsible for grandchildrenWhite alone, not Hispanic / Latino 3 28.3% Responsible for grandchildren9 71.7% Not responsible for grandchildrenHispanic or Latino 50 16.6% Responsible for grandchildren248 83.4% Not responsible for grandchildren