Races in Seguin, Texas (TX) Detailed Stats
Data:
Races - White alone (%)
Races - White alone (% change since 2000)
Races - Black alone (%)
Races - Black alone (% change since 2000)
Races - American Indian alone (%)
Races - American Indian alone (% change since 2000)
Races - Asian alone (%)
Races - Asian alone (% change since 2000)
Races - Hispanic (%)
Races - Hispanic (% change since 2000)
Races - Native Hawaiian and Other Pacific Islander alone (%)
Races - Native Hawaiian and Other Pacific Islander alone (% change since 2000)
Races - Two or more races(%)
Races - Two or more races(% change since 2000)
Races - Other race alone (%)
Races - Other race alone (% change since 2000)
Racial diversity
Place of birth - Born in state of residence (%)
Place of birth - Born in state of residence (%) - White
Place of birth - Born in state of residence (%) - Black or African American
Place of birth - Born in state of residence (%) - Asian
Place of birth - Born in state of residence (%) - Hispanic or Latino
Place of birth - Born in state of residence (%) - American Indian and Alaska Native
Place of birth - Born in state of residence (%) - Multirace
Place of birth - Born in state of residence (%) - Other Race
Place of birth - Born in other state (%)
Place of birth - Born in other state (%) - White
Place of birth - Born in other state (%) - Black or African American
Place of birth - Born in other state (%) - Asian
Place of birth - Born in other state (%) - Hispanic or Latino
Place of birth - Born in other state (%) - American Indian and Alaska Native
Place of birth - Born in other state (%) - Multirace
Place of birth - Born in other state (%) - Other Race
Place of birth - Native, outside of US (%)
Place of birth - Native, outside of US (%) - White
Place of birth - Native, outside of US (%) - Black or African American
Place of birth - Native, outside of US (%) - Asian
Place of birth - Native, outside of US (%) - Hispanic or Latino
Place of birth - Native, outside of US (%) - American Indian and Alaska Native
Place of birth - Native, outside of US (%) - Multirace
Place of birth - Native, outside of US (%) - Other Race
Place of birth - Foreign born (%)
Place of birth - Foreign born (%) - White
Place of birth - Foreign born (%) - Black or African American
Place of birth - Foreign born (%) - Asian
Place of birth - Foreign born (%) - Hispanic or Latino
Place of birth - Foreign born (%) - American Indian and Alaska Native
Place of birth - Foreign born (%) - Multirace
Place of birth - Foreign born (%) - Other Race
Residents speaking English at home (%)
Residents speaking English at home - Born in the United States (%)
Residents speaking English at home - Native, born elsewhere (%)
Residents speaking English at home - Foreign born (%)
Residents speaking Spanish at home (%)
Residents speaking Spanish at home - Born in the United States (%)
Residents speaking Spanish at home - Native, born elsewhere (%)
Residents speaking Spanish at home - Foreign born (%)
Residents speaking other language at home (%)
Residents speaking other language at home - Born in the United States (%)
Residents speaking other language at home - Native, born elsewhere (%)
Residents speaking other language at home - Foreign born (%)
Marital status - Never married (%)
Marital status - Now married (%)
Marital status - Separated (%)
Marital status - Widowed (%)
Marital status - Divorced (%)
Ancestries Reported - Arab (%)
Ancestries Reported - Czech (%)
Ancestries Reported - Danish (%)
Ancestries Reported - Dutch (%)
Ancestries Reported - English (%)
Ancestries Reported - French (%)
Ancestries Reported - French Canadian (%)
Ancestries Reported - German (%)
Ancestries Reported - Greek (%)
Ancestries Reported - Hungarian (%)
Ancestries Reported - Irish (%)
Ancestries Reported - Italian (%)
Ancestries Reported - Lithuanian (%)
Ancestries Reported - Norwegian (%)
Ancestries Reported - Polish (%)
Ancestries Reported - Portuguese (%)
Ancestries Reported - Russian (%)
Ancestries Reported - Scotch-Irish (%)
Ancestries Reported - Scottish (%)
Ancestries Reported - Slovak (%)
Ancestries Reported - Subsaharan African (%)
Ancestries Reported - Swedish (%)
Ancestries Reported - Swiss (%)
Ancestries Reported - Ukrainian (%)
Ancestries Reported - United States (%)
Ancestries Reported - Welsh (%)
Ancestries Reported - West Indian (%)
Ancestries Reported - Other (%)
Geographical mobility - Same house 1 year ago (%)
Geographical mobility - Same house 1 year ago (%) - White
Geographical mobility - Same house 1 year ago (%) - Black or African American
Geographical mobility - Same house 1 year ago (%) - Asian
Geographical mobility - Same house 1 year ago (%) - Hispanic or Latino
Geographical mobility - Same house 1 year ago (%) - American Indian and Alaska Native
Geographical mobility - Same house 1 year ago (%) - Multirace
Geographical mobility - Same house 1 year ago (%) - Other Race
Geographical mobility - Moved within same county (%)
Geographical mobility - Moved within same county (%) - White
Geographical mobility - Moved within same county (%) - Black or African American
Geographical mobility - Moved within same county (%) - Asian
Geographical mobility - Moved within same county (%) - Hispanic or Latino
Geographical mobility - Moved within same county (%) - American Indian and Alaska Native
Geographical mobility - Moved within same county (%) - Multirace
Geographical mobility - Moved within same county (%) - Other Race
Geographical mobility - Moved from different county within same state (%)
Geographical mobility - Moved from different county within same state (%) - White
Geographical mobility - Moved from different county within same state (%) - Black or African American
Geographical mobility - Moved from different county within same state (%) - Asian
Geographical mobility - Moved from different county within same state (%) - Hispanic or Latino
Geographical mobility - Moved from different county within same state (%) - American Indian and Alaska Native
Geographical mobility - Moved from different county within same state (%) - Multirace
Geographical mobility - Moved from different county within same state (%) - Other Race
Geographical mobility - Moved from different state (%)
Geographical mobility - Moved from different state (%) - White
Geographical mobility - Moved from different state (%) - Black or African American
Geographical mobility - Moved from different state (%) - Asian
Geographical mobility - Moved from different state (%) - Hispanic or Latino
Geographical mobility - Moved from different state (%) - American Indian and Alaska Native
Geographical mobility - Moved from different state (%) - Multirace
Geographical mobility - Moved from different state (%) - Other Race
Geographical mobility - Moved from abroad (%)
Geographical mobility - Moved from abroad (%) - White
Geographical mobility - Moved from abroad (%) - Black or African American
Geographical mobility - Moved from abroad (%) - Asian
Geographical mobility - Moved from abroad (%) - Hispanic or Latino
Geographical mobility - Moved from abroad (%) - American Indian and Alaska Native
Geographical mobility - Moved from abroad (%) - Multirace
Geographical mobility - Moved from abroad (%) - Other Race
Place of birth for the foreign-born population - Ireland (%)
Place of birth for the foreign-born population - Denmark (%)
Place of birth for the foreign-born population - Norway (%)
Place of birth for the foreign-born population - Sweden (%)
Place of birth for the foreign-born population - United Kingdom (%)
Place of birth for the foreign-born population - England (%)
Place of birth for the foreign-born population - Scotland (%)
Place of birth for the foreign-born population - Other Northern Europe (%)
Place of birth for the foreign-born population - Austria (%)
Place of birth for the foreign-born population - Belgium (%)
Place of birth for the foreign-born population - France (%)
Place of birth for the foreign-born population - Germany (%)
Place of birth for the foreign-born population - Netherlands (%)
Place of birth for the foreign-born population - Switzerland (%)
Place of birth for the foreign-born population - Other Western Europe (%)
Place of birth for the foreign-born population - Greece (%)
Place of birth for the foreign-born population - Italy (%)
Place of birth for the foreign-born population - Portugal (%)
Place of birth for the foreign-born population - Spain (%)
Place of birth for the foreign-born population - Other Southern Europe (%)
Place of birth for the foreign-born population - Albania (%)
Place of birth for the foreign-born population - Belarus (%)
Place of birth for the foreign-born population - Bosnia and Herzegovina (%)
Place of birth for the foreign-born population - Bulgaria (%)
Place of birth for the foreign-born population - Croatia (%)
Place of birth for the foreign-born population - Czechoslovakia (%)
Place of birth for the foreign-born population - Hungary (%)
Place of birth for the foreign-born population - Latvia (%)
Place of birth for the foreign-born population - Lithuania (%)
Place of birth for the foreign-born population - North Macedonia (Macedonia) (%)
Place of birth for the foreign-born population - Moldova (%)
Place of birth for the foreign-born population - Poland (%)
Place of birth for the foreign-born population - Romania (%)
Place of birth for the foreign-born population - Russia (%)
Place of birth for the foreign-born population - Serbia (%)
Place of birth for the foreign-born population - Ukraine (%)
Place of birth for the foreign-born population - Other Eastern Europe (%)
Place of birth for the foreign-born population - China (%)
Place of birth for the foreign-born population - Hong Kong (%)
Place of birth for the foreign-born population - Taiwan (%)
Place of birth for the foreign-born population - Japan (%)
Place of birth for the foreign-born population - Korea (%)
Place of birth for the foreign-born population - Other Eastern Asia (%)
Place of birth for the foreign-born population - Afghanistan (%)
Place of birth for the foreign-born population - Bangladesh (%)
Place of birth for the foreign-born population - India (%)
Place of birth for the foreign-born population - Iran (%)
Place of birth for the foreign-born population - Kazakhstan (%)
Place of birth for the foreign-born population - Nepal (%)
Place of birth for the foreign-born population - Pakistan (%)
Place of birth for the foreign-born population - Sri Lanka (%)
Place of birth for the foreign-born population - Uzbekistan (%)
Place of birth for the foreign-born population - Other South Central Asia (%)
Place of birth for the foreign-born population - Burma (%)
Place of birth for the foreign-born population - Cambodia (%)
Place of birth for the foreign-born population - Indonesia (%)
Place of birth for the foreign-born population - Laos (%)
Place of birth for the foreign-born population - Malaysia (%)
Place of birth for the foreign-born population - Philippines (%)
Place of birth for the foreign-born population - Singapore (%)
Place of birth for the foreign-born population - Thailand (%)
Place of birth for the foreign-born population - Vietnam (%)
Place of birth for the foreign-born population - Other South Eastern Asia (%)
Place of birth for the foreign-born population - Armenia (%)
Place of birth for the foreign-born population - Iraq (%)
Place of birth for the foreign-born population - Israel (%)
Place of birth for the foreign-born population - Jordan (%)
Place of birth for the foreign-born population - Kuwait (%)
Place of birth for the foreign-born population - Lebanon (%)
Place of birth for the foreign-born population - Saudi Arabia (%)
Place of birth for the foreign-born population - Syria (%)
Place of birth for the foreign-born population - Turkey (%)
Place of birth for the foreign-born population - Yemen (%)
Place of birth for the foreign-born population - Other Western Asia (%)
Place of birth for the foreign-born population - Eritrea (%)
Place of birth for the foreign-born population - Ethiopia (%)
Place of birth for the foreign-born population - Kenya (%)
Place of birth for the foreign-born population - Somalia (%)
Place of birth for the foreign-born population - Uganda (%)
Place of birth for the foreign-born population - Zimbabwe (%)
Place of birth for the foreign-born population - Other Eastern Africa (%)
Place of birth for the foreign-born population - Cameroon (%)
Place of birth for the foreign-born population - Congo (%)
Place of birth for the foreign-born population - Democratic Republic of Congo (Zaire) (%)
Place of birth for the foreign-born population - Other Middle Africa (%)
Place of birth for the foreign-born population - Egypt (%)
Place of birth for the foreign-born population - Morocco (%)
Place of birth for the foreign-born population - Sudan (%)
Place of birth for the foreign-born population - Other Northern Africa (%)
Place of birth for the foreign-born population - South Africa (%)
Place of birth for the foreign-born population - Other Southern Africa (%)
Place of birth for the foreign-born population - Cabo Verde (%)
Place of birth for the foreign-born population - Ghana (%)
Place of birth for the foreign-born population - Liberia (%)
Place of birth for the foreign-born population - Nigeria (%)
Place of birth for the foreign-born population - Senegal (%)
Place of birth for the foreign-born population - Sierra Leone (%)
Place of birth for the foreign-born population - Other Western Africa (%)
Place of birth for the foreign-born population - Australia (%)
Place of birth for the foreign-born population - New Zealand (%)
Place of birth for the foreign-born population - Fiji (%)
Place of birth for the foreign-born population - Micronesia (%)
Place of birth for the foreign-born population - Bahamas (%)
Place of birth for the foreign-born population - Barbados (%)
Place of birth for the foreign-born population - Cuba (%)
Place of birth for the foreign-born population - Dominica (%)
Place of birth for the foreign-born population - Dominican Republic (%)
Place of birth for the foreign-born population - Grenada (%)
Place of birth for the foreign-born population - Haiti (%)
Place of birth for the foreign-born population - Jamaica (%)
Place of birth for the foreign-born population - St. Vincent and the Grenadines (%)
Place of birth for the foreign-born population - Trinidad and Tobago (%)
Place of birth for the foreign-born population - West Indies (%)
Place of birth for the foreign-born population - Other Caribbean (%)
Place of birth for the foreign-born population - Belize (%)
Place of birth for the foreign-born population - Costa Rica (%)
Place of birth for the foreign-born population - El Salvador (%)
Place of birth for the foreign-born population - Guatemala (%)
Place of birth for the foreign-born population - Honduras (%)
Place of birth for the foreign-born population - Mexico (%)
Place of birth for the foreign-born population - Nicaragua (%)
Place of birth for the foreign-born population - Panama (%)
Place of birth for the foreign-born population - Other Central America (%)
Place of birth for the foreign-born population - Argentina (%)
Place of birth for the foreign-born population - Bolivia (%)
Place of birth for the foreign-born population - Brazil (%)
Place of birth for the foreign-born population - Chile (%)
Place of birth for the foreign-born population - Colombia (%)
Place of birth for the foreign-born population - Ecuador (%)
Place of birth for the foreign-born population - Guyana (%)
Place of birth for the foreign-born population - Peru (%)
Place of birth for the foreign-born population - Uruguay (%)
Place of birth for the foreign-born population - Venezuela (%)
Place of birth for the foreign-born population - Other South America (%)
Place of birth for the foreign-born population - Canada (%)
Place of birth for the foreign-born population - Other Northern America (%)
Place of birth for the foreign-born population - Other (%)
Latest news about races in Seguin, TX collected exclusively by city-data.com from local newspapers, TV, and radio stations
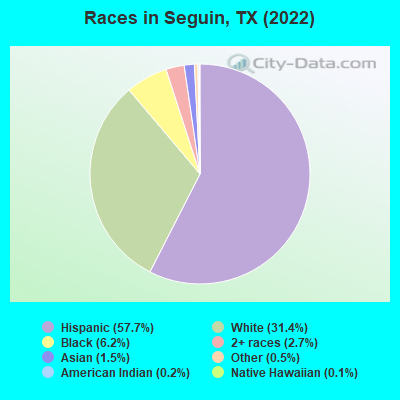
According to 2022 data, the most numerous races in Seguin, TX are Hispanic (18,384 residents), White alone (10,004 residents), and Black alone (1,978 residents). 64.9% of Seguin residents speak English at home. 8.9% of Seguin, TX residents are foreign-born (6.2% born in Latin America, 1.4% born in Asia), which is 91.8% less than the foreign-born rate of 17.0% across the entire state of Texas.
Race distribution in Seguin
2000 2022
10,933,313 52.4% White alone 6,669,666 32.0% Hispanic 2,364,255 11.3% Black alone 554,445 2.7% Asian alone 230,567 1.1% Two or more races 68,859 0.3% American Indian alone 19,958 0.10% Other race alone 10,757 0.05% Native Hawaiian and Other
12,070,642 40.2% Hispanic 11,683,430 38.9% White alone 3,508,706 11.7% Black alone 1,608,173 5.4% Asian alone 956,560 3.2% Two or more races 125,763 0.4% Other race alone 47,023 0.2% American Indian alone 29,275 0.10% Native Hawaiian and Other
Income and house value in Seguin Median household income in 2022 $65,104 White non-Hispanic householders$39,285 Black householders$68,099 American Indian and Alaska Native householders$81,991 Asian householders$32,341 Some other race householders$67,899 Two or more races householders$61,114 Hispanic or Latino race householdersMedian 2022 house value $278,956 White Non-Hispanic householders$163,772 Black or African American householders $206,244 Asian householders$149,162 Some other race householders$155,278 Two or more races householders$159,355 Hispanic or Latino householders
Median age by race in Seguin
40.5 Median age for White residents39.4 40.9 44.6 Median age for Black or African American residents40.7 47.4 42.1 Median age for American Indian / Alaska Native residents67.1 20.4 35.7 Median age for Asian residents35.0 32.0 -581,560,283.1 Median age for Native Hawaiian / Pacific Islander residents-666,666,666.0 -666,666,666.0 25.9 Median age for Other race residents21.2 27.8 33.4 Median age for Two or more races residents31.2 35.4 45.1 Median age for White alone residents45.0 45.6 32.4 Median age for Hispanic or Latino residents31.1 34.4
Owner/renter occupied households by race in Seguin
House owners and renters - White residents 3,963 65.0% Owner occupied2,133 35.0% Renter occupiedHouse owners and renters - Black or African American residents 556 59.6% Owner occupied376 40.4% Renter occupiedHouse owners and renters - American Indian / Alaska Native residents 188 93.2% Owner occupied14 6.8% Renter occupiedHouse owners and renters - Asian residents 49 64.9% Owner occupied26 35.1% Renter occupiedHouse owners and renters - Other race residents 662 53.2% Owner occupied584 46.8% Renter occupiedHouse owners and renters - Two or more races residents 2,634 69.6% Owner occupied1,148 30.4% Renter occupiedHouse owners and renters - White alone residents 2,959 73.0% Owner occupied1,095 27.0% Renter occupiedHouse owners and renters - Hispanic or Latino residents 3,931 59.8% Owner occupied2,645 40.2% Renter occupied
Language usage in Seguin
English speakers - Total 64.9% of residents of Seguin speak English at home.
31.7% of residents speak Spanish at home 6,589 69.3% Speak English very well2,915 30.7% Speak English less than very well4.2% of residents speak other language at home 705 56.3% Speak English very well547 43.7% Speak English less than very well
English speakers - Born in the United States 85.4% of residents of Seguin speak English at home.
13.0% of residents speak Spanish at home 512 83.3% Speak English very well103 16.7% Speak English less than very well2.8% of residents speak other language at home 116 89.2% Speak English very well14 10.8% Speak English less than very well
English speakers - Native, born elsewhere 68.2% of residents of Seguin speak English at home.
8.7% of residents speak Spanish at home 25 100.0% Speak English less than very well13.6% of residents speak other language at home 39 100.0% Speak English very well
English speakers - Foreign-born 9.3% of residents of Seguin speak English at home.
60.9% of residents speak Spanish at home 511 27.5% Speak English very well1,344 72.5% Speak English less than very well23.7% of residents speak other language at home 325 45.0% Speak English very well397 55.0% Speak English less than very well
White (Caucasian) - Speak only English Native:
83.6% (11,156)Foreign-born:
15.3% (61)
White (Caucasian) - Speak another language Native:
13.1% (1,750)Foreign-born:
84.0% (335)
Black or African American - Speak only English Native:
94.1% (2,094)Foreign-born:
9.6% (14)
Black or African American - Speak another language Native:
5.9% (132)Foreign-born:
94.0% (135)
American Indian / Alaska Native - Speak another language Native:
75.4% (205)Foreign-born:
98.9% (18)
Asian - Speak only English Native:
67.6% (93)Foreign-born:
9.4% (42)
Asian - Speak another language Native:
32.6% (45)Foreign-born:
91.8% (413)
Other race - Speak only English Native:
56.9% (1,917)Foreign-born:
12.4% (107)
Other race - Speak another language Native:
42.4% (1,430)Foreign-born:
87.4% (754)
Two or more races - Speak only English Native:
51.4% (4,683)Foreign-born:
6.9% (90)
Two or more races - Speak another language Native:
49.4% (4,499)Foreign-born:
93.4% (1,220)
White alone - Speak only English Native:
95.7% (9,052)Foreign-born:
14.6% (24)
White alone - Speak another language Native:
4.7% (449)Foreign-born:
100.0% (161)
Hispanic or Latino - Speak only English Native:
51.9% (7,805)Foreign-born:
11.5% (238)
Hispanic or Latino - Speak another language Native:
48.5% (7,295)Foreign-born:
88.6% (1,835)
Foreign-born residents in Seguin 2,825 residents are foreign born (6.2% Latin America , 1.4% Asia ).
This city:
8.9%Texas:
17.1%
Marital status for residents in Seguin Marital status - White (Caucasian) population 15 years and over
Males 37.1% Never married44.1% Now married4.1% Separated2.0% Widowed12.7% DivorcedFemales 26.9% Never married44.1% Now married1.1% Separated11.2% Widowed16.7% DivorcedWomen who gave birth in the past 12 months Now married:
78.8% (219)Unmarried:
21.2% (59)
Women who did not give birth in the past 12 months Now married:
42.1% (1,399)Unmarried:
57.9% (1,922)
Marital status - Black or African American population 15 years and over
Males 56.7% Never married20.7% Now married3.9% Separated11.2% Widowed7.5% DivorcedFemales 46.2% Never married17.5% Now married6.7% Separated9.9% Widowed19.7% DivorcedWomen who did not give birth in the past 12 months Now married:
14.8% (51)Unmarried:
85.2% (291)
Marital status - American Indian / Alaska Native population 15 years and over
Males 34.8% Never married8.1% Now married0.0% Separated28.6% Widowed28.6% DivorcedFemales 48.7% Never married51.3% Now married0.0% Separated0.0% Widowed0.0% DivorcedWomen who did not give birth in the past 12 months Now married:
36.7% (16)Unmarried:
63.3% (27)
Marital status - Asian population 15 years and over
Males 19.2% Never married80.8% Now married0.0% Separated0.0% Widowed0.0% DivorcedFemales 40.8% Never married59.2% Now married0.0% Separated0.0% Widowed0.0% DivorcedWomen who did not give birth in the past 12 months Now married:
39.7% (52)Unmarried:
60.3% (78)
Marital status - Other race population 15 years and over
Males 48.6% Never married32.9% Now married5.3% Separated6.1% Widowed7.1% DivorcedFemales 27.9% Never married37.2% Now married6.2% Separated8.8% Widowed20.0% DivorcedWomen who gave birth in the past 12 months Now married:
27.8% (40)Unmarried:
72.2% (103)
Women who did not give birth in the past 12 months Now married:
40.6% (385)Unmarried:
59.4% (563)
Marital status - Two or more races population 15 years and over
Males 46.1% Never married36.6% Now married0.0% Separated6.5% Widowed10.8% DivorcedFemales 43.9% Never married35.3% Now married0.9% Separated6.0% Widowed13.9% DivorcedWomen who gave birth in the past 12 months Now married:
60.6% (138)Unmarried:
39.4% (90)
Women who did not give birth in the past 12 months Now married:
26.2% (848)Unmarried:
73.8% (2,388)
Marital status - White alone, not Hispanic / Latino population 15 years and over
Males 31.0% Never married48.9% Now married0.6% Separated3.3% Widowed16.1% DivorcedFemales 21.1% Never married45.8% Now married1.4% Separated14.3% Widowed17.4% DivorcedWomen who gave birth in the past 12 months Now married:
84.1% (128)Unmarried:
15.9% (24)
Women who did not give birth in the past 12 months Now married:
45.8% (916)Unmarried:
54.2% (1,084)
Marital status - Hispanic or Latino population 15 years and over
Males 46.4% Never married36.4% Now married4.5% Separated3.5% Widowed9.2% DivorcedFemales 36.8% Never married39.5% Now married1.6% Separated7.0% Widowed15.1% DivorcedWomen who gave birth in the past 12 months Now married:
59.2% (264)Unmarried:
40.8% (182)
Women who did not give birth in the past 12 months Now married:
35.0% (1,703)Unmarried:
65.0% (3,166)
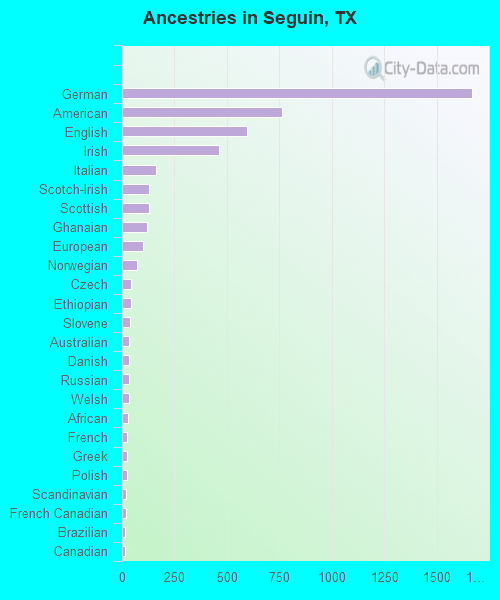
Ancestries in Seguin
1,667 8.2% German764 3.8% American598 2.9% English463 2.3% Irish162 0.8% Italian131 0.6% Scotch-Irish130 0.6% Scottish121 0.6% Ghanaian100 0.5% European73 0.4% Norwegian44 0.2% Czech43 0.2% Ethiopian39 0.2% Slovene34 0.2% Australian33 0.2% Danish32 0.2% Russian32 0.2% Welsh28 0.1% African26 0.1% French26 0.1% Greek23 0.1% Polish21 0.1% Scandinavian17 0.08% French Canadian16 0.08% Brazilian16 0.08% Canadian16 0.08% Eastern European10 0.05% Nigerian5 0.02% Swiss5 0.02% Jamaican3 0.01% Iranian
Geographical mobility in Seguin Same house 1 year ago 11,039 78.6% White (Caucasian)2,100 86.0% Black or African American311 100.0% American Indian / Alaska Native392 77.2% Asian45 98.2% Native Hawaiian / Pacific Islander3,502 74.3% Other race9,541 84.6% Two or more races7,838 79.4% White alone, not Hispanic / Latino14,068 78.0% Hispanic or LatinoMoved within same county 1,230 8.8% White / Caucasian84 3.4% Black or African American34 6.8% Asian251 5.3% Other race384 3.4% Two or more races672 6.8% White alone, not Hispanic / Latino947 5.3% Hispanic or LatinoMoved within same state 1,134 8.1% White / Caucasian168 6.9% Black or African American4 1.2% American Indian / Alaska Native292 6.2% Other race324 2.9% Two or more races808 8.2% White alone, not Hispanic / Latino537 3.0% Hispanic or LatinoMoved from different state 162 1.2% White / Caucasian90 17.7% Asian115 1.0% Two or more races188 1.9% White alone, not Hispanic / Latino137 0.8% Hispanic or LatinoMoved from abroad 60 0.4% White95 3.9% Black or African American60 0.5% Two or more races10 0.1% White alone, not Hispanic / Latino152 0.8% Hispanic or Latino
Children Nativity (place of birth) in Seguin
Children under 6 years - Living with two parents Both parents native 971 100.0% NativeBoth parents foreign-born 20 100.0% Foreign-bornOne native, one foreign-born parent 72 100.0% NativeChildren under 6 years - Living with one parent Native parent 824 100.0% NativeForeign-born parent 106 75.3% Native35 24.7% Foreign-bornChildren 6 to 17 years - Living with two parents Both parents native 1,391 100.0% NativeBoth parents foreign-born 534 100.0% NativeOne native, one foreign-born parent 294 100.0% NativeChildren 6 to 17 years - Living with one parent Native parent 1,425 100.0% NativeForeign-born parent 222 65.3% Native118 34.7% Foreign-born
Grandparents responsible for own grandchildren in Seguin
Grandparents (30 to 59 years) White / Caucasian 80 54.9% Responsible for grandchildren65 45.1% Not responsible for grandchildrenBlack or African American 16 100.0% Responsible for grandchildrenOther race 68 65.3% Responsible for grandchildren36 34.7% Not responsible for grandchildrenTwo or more races 157 29.2% Responsible for grandchildren381 70.8% Not responsible for grandchildrenWhite alone, not Hispanic / Latino 8 52.3% Responsible for grandchildren7 47.7% Not responsible for grandchildrenHispanic or Latino 248 44.7% Responsible for grandchildren307 55.3% Not responsible for grandchildrenGrandparents (60 years and over) White / Caucasian 24 30.7% Responsible for grandchildren54 69.3% Not responsible for grandchildrenBlack or African American 42 100.0% Not responsible for grandchildrenOther race 75 67.0% Responsible for grandchildren37 33.0% Not responsible for grandchildrenTwo or more races 275 100.0% Not responsible for grandchildrenWhite alone, not Hispanic / Latino 33 37.4% Responsible for grandchildren55 62.6% Not responsible for grandchildrenHispanic or Latino 56 27.7% Responsible for grandchildren147 72.3% Not responsible for grandchildren