Races in Royse City, Texas (TX) Detailed Stats
Data:
Races - White alone (%)
Races - White alone (% change since 2000)
Races - Black alone (%)
Races - Black alone (% change since 2000)
Races - American Indian alone (%)
Races - American Indian alone (% change since 2000)
Races - Asian alone (%)
Races - Asian alone (% change since 2000)
Races - Hispanic (%)
Races - Hispanic (% change since 2000)
Races - Native Hawaiian and Other Pacific Islander alone (%)
Races - Native Hawaiian and Other Pacific Islander alone (% change since 2000)
Races - Two or more races(%)
Races - Two or more races(% change since 2000)
Races - Other race alone (%)
Races - Other race alone (% change since 2000)
Racial diversity
Place of birth - Born in state of residence (%)
Place of birth - Born in state of residence (%) - White
Place of birth - Born in state of residence (%) - Black or African American
Place of birth - Born in state of residence (%) - Asian
Place of birth - Born in state of residence (%) - Hispanic or Latino
Place of birth - Born in state of residence (%) - American Indian and Alaska Native
Place of birth - Born in state of residence (%) - Multirace
Place of birth - Born in state of residence (%) - Other Race
Place of birth - Born in other state (%)
Place of birth - Born in other state (%) - White
Place of birth - Born in other state (%) - Black or African American
Place of birth - Born in other state (%) - Asian
Place of birth - Born in other state (%) - Hispanic or Latino
Place of birth - Born in other state (%) - American Indian and Alaska Native
Place of birth - Born in other state (%) - Multirace
Place of birth - Born in other state (%) - Other Race
Place of birth - Native, outside of US (%)
Place of birth - Native, outside of US (%) - White
Place of birth - Native, outside of US (%) - Black or African American
Place of birth - Native, outside of US (%) - Asian
Place of birth - Native, outside of US (%) - Hispanic or Latino
Place of birth - Native, outside of US (%) - American Indian and Alaska Native
Place of birth - Native, outside of US (%) - Multirace
Place of birth - Native, outside of US (%) - Other Race
Place of birth - Foreign born (%)
Place of birth - Foreign born (%) - White
Place of birth - Foreign born (%) - Black or African American
Place of birth - Foreign born (%) - Asian
Place of birth - Foreign born (%) - Hispanic or Latino
Place of birth - Foreign born (%) - American Indian and Alaska Native
Place of birth - Foreign born (%) - Multirace
Place of birth - Foreign born (%) - Other Race
Residents speaking English at home (%)
Residents speaking English at home - Born in the United States (%)
Residents speaking English at home - Native, born elsewhere (%)
Residents speaking English at home - Foreign born (%)
Residents speaking Spanish at home (%)
Residents speaking Spanish at home - Born in the United States (%)
Residents speaking Spanish at home - Native, born elsewhere (%)
Residents speaking Spanish at home - Foreign born (%)
Residents speaking other language at home (%)
Residents speaking other language at home - Born in the United States (%)
Residents speaking other language at home - Native, born elsewhere (%)
Residents speaking other language at home - Foreign born (%)
Marital status - Never married (%)
Marital status - Now married (%)
Marital status - Separated (%)
Marital status - Widowed (%)
Marital status - Divorced (%)
Ancestries Reported - Arab (%)
Ancestries Reported - Czech (%)
Ancestries Reported - Danish (%)
Ancestries Reported - Dutch (%)
Ancestries Reported - English (%)
Ancestries Reported - French (%)
Ancestries Reported - French Canadian (%)
Ancestries Reported - German (%)
Ancestries Reported - Greek (%)
Ancestries Reported - Hungarian (%)
Ancestries Reported - Irish (%)
Ancestries Reported - Italian (%)
Ancestries Reported - Lithuanian (%)
Ancestries Reported - Norwegian (%)
Ancestries Reported - Polish (%)
Ancestries Reported - Portuguese (%)
Ancestries Reported - Russian (%)
Ancestries Reported - Scotch-Irish (%)
Ancestries Reported - Scottish (%)
Ancestries Reported - Slovak (%)
Ancestries Reported - Subsaharan African (%)
Ancestries Reported - Swedish (%)
Ancestries Reported - Swiss (%)
Ancestries Reported - Ukrainian (%)
Ancestries Reported - United States (%)
Ancestries Reported - Welsh (%)
Ancestries Reported - West Indian (%)
Ancestries Reported - Other (%)
Geographical mobility - Same house 1 year ago (%)
Geographical mobility - Same house 1 year ago (%) - White
Geographical mobility - Same house 1 year ago (%) - Black or African American
Geographical mobility - Same house 1 year ago (%) - Asian
Geographical mobility - Same house 1 year ago (%) - Hispanic or Latino
Geographical mobility - Same house 1 year ago (%) - American Indian and Alaska Native
Geographical mobility - Same house 1 year ago (%) - Multirace
Geographical mobility - Same house 1 year ago (%) - Other Race
Geographical mobility - Moved within same county (%)
Geographical mobility - Moved within same county (%) - White
Geographical mobility - Moved within same county (%) - Black or African American
Geographical mobility - Moved within same county (%) - Asian
Geographical mobility - Moved within same county (%) - Hispanic or Latino
Geographical mobility - Moved within same county (%) - American Indian and Alaska Native
Geographical mobility - Moved within same county (%) - Multirace
Geographical mobility - Moved within same county (%) - Other Race
Geographical mobility - Moved from different county within same state (%)
Geographical mobility - Moved from different county within same state (%) - White
Geographical mobility - Moved from different county within same state (%) - Black or African American
Geographical mobility - Moved from different county within same state (%) - Asian
Geographical mobility - Moved from different county within same state (%) - Hispanic or Latino
Geographical mobility - Moved from different county within same state (%) - American Indian and Alaska Native
Geographical mobility - Moved from different county within same state (%) - Multirace
Geographical mobility - Moved from different county within same state (%) - Other Race
Geographical mobility - Moved from different state (%)
Geographical mobility - Moved from different state (%) - White
Geographical mobility - Moved from different state (%) - Black or African American
Geographical mobility - Moved from different state (%) - Asian
Geographical mobility - Moved from different state (%) - Hispanic or Latino
Geographical mobility - Moved from different state (%) - American Indian and Alaska Native
Geographical mobility - Moved from different state (%) - Multirace
Geographical mobility - Moved from different state (%) - Other Race
Geographical mobility - Moved from abroad (%)
Geographical mobility - Moved from abroad (%) - White
Geographical mobility - Moved from abroad (%) - Black or African American
Geographical mobility - Moved from abroad (%) - Asian
Geographical mobility - Moved from abroad (%) - Hispanic or Latino
Geographical mobility - Moved from abroad (%) - American Indian and Alaska Native
Geographical mobility - Moved from abroad (%) - Multirace
Geographical mobility - Moved from abroad (%) - Other Race
Place of birth for the foreign-born population - Ireland (%)
Place of birth for the foreign-born population - Denmark (%)
Place of birth for the foreign-born population - Norway (%)
Place of birth for the foreign-born population - Sweden (%)
Place of birth for the foreign-born population - United Kingdom (%)
Place of birth for the foreign-born population - England (%)
Place of birth for the foreign-born population - Scotland (%)
Place of birth for the foreign-born population - Other Northern Europe (%)
Place of birth for the foreign-born population - Austria (%)
Place of birth for the foreign-born population - Belgium (%)
Place of birth for the foreign-born population - France (%)
Place of birth for the foreign-born population - Germany (%)
Place of birth for the foreign-born population - Netherlands (%)
Place of birth for the foreign-born population - Switzerland (%)
Place of birth for the foreign-born population - Other Western Europe (%)
Place of birth for the foreign-born population - Greece (%)
Place of birth for the foreign-born population - Italy (%)
Place of birth for the foreign-born population - Portugal (%)
Place of birth for the foreign-born population - Spain (%)
Place of birth for the foreign-born population - Other Southern Europe (%)
Place of birth for the foreign-born population - Albania (%)
Place of birth for the foreign-born population - Belarus (%)
Place of birth for the foreign-born population - Bosnia and Herzegovina (%)
Place of birth for the foreign-born population - Bulgaria (%)
Place of birth for the foreign-born population - Croatia (%)
Place of birth for the foreign-born population - Czechoslovakia (%)
Place of birth for the foreign-born population - Hungary (%)
Place of birth for the foreign-born population - Latvia (%)
Place of birth for the foreign-born population - Lithuania (%)
Place of birth for the foreign-born population - North Macedonia (Macedonia) (%)
Place of birth for the foreign-born population - Moldova (%)
Place of birth for the foreign-born population - Poland (%)
Place of birth for the foreign-born population - Romania (%)
Place of birth for the foreign-born population - Russia (%)
Place of birth for the foreign-born population - Serbia (%)
Place of birth for the foreign-born population - Ukraine (%)
Place of birth for the foreign-born population - Other Eastern Europe (%)
Place of birth for the foreign-born population - China (%)
Place of birth for the foreign-born population - Hong Kong (%)
Place of birth for the foreign-born population - Taiwan (%)
Place of birth for the foreign-born population - Japan (%)
Place of birth for the foreign-born population - Korea (%)
Place of birth for the foreign-born population - Other Eastern Asia (%)
Place of birth for the foreign-born population - Afghanistan (%)
Place of birth for the foreign-born population - Bangladesh (%)
Place of birth for the foreign-born population - India (%)
Place of birth for the foreign-born population - Iran (%)
Place of birth for the foreign-born population - Kazakhstan (%)
Place of birth for the foreign-born population - Nepal (%)
Place of birth for the foreign-born population - Pakistan (%)
Place of birth for the foreign-born population - Sri Lanka (%)
Place of birth for the foreign-born population - Uzbekistan (%)
Place of birth for the foreign-born population - Other South Central Asia (%)
Place of birth for the foreign-born population - Burma (%)
Place of birth for the foreign-born population - Cambodia (%)
Place of birth for the foreign-born population - Indonesia (%)
Place of birth for the foreign-born population - Laos (%)
Place of birth for the foreign-born population - Malaysia (%)
Place of birth for the foreign-born population - Philippines (%)
Place of birth for the foreign-born population - Singapore (%)
Place of birth for the foreign-born population - Thailand (%)
Place of birth for the foreign-born population - Vietnam (%)
Place of birth for the foreign-born population - Other South Eastern Asia (%)
Place of birth for the foreign-born population - Armenia (%)
Place of birth for the foreign-born population - Iraq (%)
Place of birth for the foreign-born population - Israel (%)
Place of birth for the foreign-born population - Jordan (%)
Place of birth for the foreign-born population - Kuwait (%)
Place of birth for the foreign-born population - Lebanon (%)
Place of birth for the foreign-born population - Saudi Arabia (%)
Place of birth for the foreign-born population - Syria (%)
Place of birth for the foreign-born population - Turkey (%)
Place of birth for the foreign-born population - Yemen (%)
Place of birth for the foreign-born population - Other Western Asia (%)
Place of birth for the foreign-born population - Eritrea (%)
Place of birth for the foreign-born population - Ethiopia (%)
Place of birth for the foreign-born population - Kenya (%)
Place of birth for the foreign-born population - Somalia (%)
Place of birth for the foreign-born population - Uganda (%)
Place of birth for the foreign-born population - Zimbabwe (%)
Place of birth for the foreign-born population - Other Eastern Africa (%)
Place of birth for the foreign-born population - Cameroon (%)
Place of birth for the foreign-born population - Congo (%)
Place of birth for the foreign-born population - Democratic Republic of Congo (Zaire) (%)
Place of birth for the foreign-born population - Other Middle Africa (%)
Place of birth for the foreign-born population - Egypt (%)
Place of birth for the foreign-born population - Morocco (%)
Place of birth for the foreign-born population - Sudan (%)
Place of birth for the foreign-born population - Other Northern Africa (%)
Place of birth for the foreign-born population - South Africa (%)
Place of birth for the foreign-born population - Other Southern Africa (%)
Place of birth for the foreign-born population - Cabo Verde (%)
Place of birth for the foreign-born population - Ghana (%)
Place of birth for the foreign-born population - Liberia (%)
Place of birth for the foreign-born population - Nigeria (%)
Place of birth for the foreign-born population - Senegal (%)
Place of birth for the foreign-born population - Sierra Leone (%)
Place of birth for the foreign-born population - Other Western Africa (%)
Place of birth for the foreign-born population - Australia (%)
Place of birth for the foreign-born population - New Zealand (%)
Place of birth for the foreign-born population - Fiji (%)
Place of birth for the foreign-born population - Micronesia (%)
Place of birth for the foreign-born population - Bahamas (%)
Place of birth for the foreign-born population - Barbados (%)
Place of birth for the foreign-born population - Cuba (%)
Place of birth for the foreign-born population - Dominica (%)
Place of birth for the foreign-born population - Dominican Republic (%)
Place of birth for the foreign-born population - Grenada (%)
Place of birth for the foreign-born population - Haiti (%)
Place of birth for the foreign-born population - Jamaica (%)
Place of birth for the foreign-born population - St. Vincent and the Grenadines (%)
Place of birth for the foreign-born population - Trinidad and Tobago (%)
Place of birth for the foreign-born population - West Indies (%)
Place of birth for the foreign-born population - Other Caribbean (%)
Place of birth for the foreign-born population - Belize (%)
Place of birth for the foreign-born population - Costa Rica (%)
Place of birth for the foreign-born population - El Salvador (%)
Place of birth for the foreign-born population - Guatemala (%)
Place of birth for the foreign-born population - Honduras (%)
Place of birth for the foreign-born population - Mexico (%)
Place of birth for the foreign-born population - Nicaragua (%)
Place of birth for the foreign-born population - Panama (%)
Place of birth for the foreign-born population - Other Central America (%)
Place of birth for the foreign-born population - Argentina (%)
Place of birth for the foreign-born population - Bolivia (%)
Place of birth for the foreign-born population - Brazil (%)
Place of birth for the foreign-born population - Chile (%)
Place of birth for the foreign-born population - Colombia (%)
Place of birth for the foreign-born population - Ecuador (%)
Place of birth for the foreign-born population - Guyana (%)
Place of birth for the foreign-born population - Peru (%)
Place of birth for the foreign-born population - Uruguay (%)
Place of birth for the foreign-born population - Venezuela (%)
Place of birth for the foreign-born population - Other South America (%)
Place of birth for the foreign-born population - Canada (%)
Place of birth for the foreign-born population - Other Northern America (%)
Place of birth for the foreign-born population - Other (%)
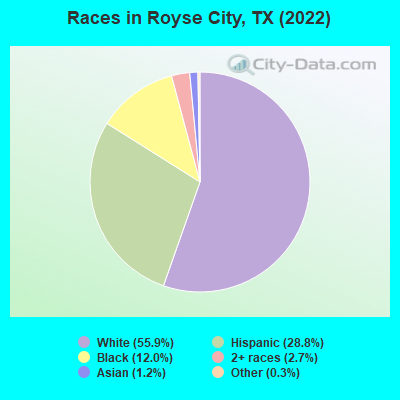
According to 2022 data, the most numerous races in Royse City, TX are Hispanic (4,822 residents), White alone (9,375 residents), and Black alone (2,007 residents). 80.7% of Royse City residents speak English at home. 8.0% of Royse City, TX residents are foreign-born (6.2% born in Latin America, 0.9% born in Africa, 0.8% born in Asia), which is 113.8% less than the foreign-born rate of 17.0% across the entire state of Texas.
Race distribution in Royse City
2000 2022
10,933,313 52.4% White alone 6,669,666 32.0% Hispanic 2,364,255 11.3% Black alone 554,445 2.7% Asian alone 230,567 1.1% Two or more races 68,859 0.3% American Indian alone 19,958 0.10% Other race alone 10,757 0.05% Native Hawaiian and Other
12,070,642 40.2% Hispanic 11,683,430 38.9% White alone 3,508,706 11.7% Black alone 1,608,173 5.4% Asian alone 956,560 3.2% Two or more races 125,763 0.4% Other race alone 47,023 0.2% American Indian alone 29,275 0.10% Native Hawaiian and Other
Income and house value in Royse City Median household income in 2022 $116,002 White non-Hispanic householders$156,267 Black householders$128,885 Asian householders$108,297 Some other race householders$108,766 Two or more races householders$109,687 Hispanic or Latino race householdersMedian 2022 house value $351,059 White Non-Hispanic householders$300,839 Black or African American householders over $1,000,000 Asian householders$263,055 Some other race householders$398,409 Two or more races householders$247,750 Hispanic or Latino householders
Median age by race in Royse City
32.9 Median age for White residents35.1 29.7 40.7 Median age for Black or African American residents40.6 32.7 -770,919,066.4 Median age for American Indian / Alaska Native residents-1,113,043,477.1 -639,231,823.8 41.7 Median age for Asian residents-748,917,748.2 35.3 -581,560,283.1 Median age for Native Hawaiian / Pacific Islander residents-612,729,233.5 -577,777,777.2 41.7 Median age for Other race residents50.8 32.6 34.8 Median age for Two or more races residents37.1 35.8 33.7 Median age for White alone residents36.9 33.2 29.9 Median age for Hispanic or Latino residents33.8 27.9
Owner/renter occupied households by race in Royse City
House owners and renters - White residents 3,578 89.3% Owner occupied427 10.7% Renter occupiedHouse owners and renters - Black or African American residents 489 81.9% Owner occupied108 18.1% Renter occupiedHouse owners and renters - Asian residents 37 91.6% Owner occupied3 8.4% Renter occupiedHouse owners and renters - Other race residents 479 79.2% Owner occupied126 20.8% Renter occupiedHouse owners and renters - Two or more races residents 461 81.1% Owner occupied107 18.9% Renter occupiedHouse owners and renters - White alone residents 3,048 87.4% Owner occupied438 12.6% Renter occupiedHouse owners and renters - Hispanic or Latino residents 1,237 92.7% Owner occupied98 7.3% Renter occupied
Language usage in Royse City
English speakers - Total 80.7% of residents of Royse City speak English at home.
15.6% of residents speak Spanish at home 1,877 76.8% Speak English very well566 23.2% Speak English less than very well3.1% of residents speak other language at home 321 65.1% Speak English very well172 34.9% Speak English less than very well
English speakers - Born in the United States 96.0% of residents of Royse City speak English at home.
1.3% of residents speak Spanish at home 31 68.9% Speak English very well14 31.1% Speak English less than very well0.8% of residents speak other language at home 29 100.0% Speak English very well
All residents speak only English at home
English speakers - Foreign-born 2.6% of residents of Royse City speak English at home.
60.9% of residents speak Spanish at home 552 61.0% Speak English very well353 39.0% Speak English less than very well31.5% of residents speak other language at home 295 63.0% Speak English very well173 37.0% Speak English less than very well
White (Caucasian) - Speak only English Native:
95.5% (9,586)Foreign-born:
18.1% (38)
White (Caucasian) - Speak another language Native:
4.1% (409)Foreign-born:
72.3% (151)
Black or African American - Speak another language Native:
4.0% (52)Foreign-born:
100.0% (172)
Asian - Speak another language Native:
71.7% (24)Foreign-born:
100.0% (131)
Other race - Speak another language Native:
74.5% (887)Foreign-born:
99.5% (634)
Two or more races - Speak another language Native:
23.0% (322)Foreign-born:
100.0% (334)
Hispanic or Latino - Speak only English Native:
62.6% (2,233)Foreign-born:
5.2% (51)
Hispanic or Latino - Speak another language Native:
37.4% (1,337)Foreign-born:
92.8% (925)
Foreign-born residents in Royse City 1,333 residents are foreign born (6.2% Latin America , 0.9% Africa , 0.8% Asia ).
This city:
8.0%Texas:
17.1%
Marital status for residents in Royse City Marital status - White (Caucasian) population 15 years and over
Males 28.5% Never married62.5% Now married1.9% Separated1.9% Widowed5.2% DivorcedFemales 28.5% Never married62.2% Now married0.0% Separated3.7% Widowed5.7% DivorcedWomen who gave birth in the past 12 months Now married:
96.8% (248)Unmarried:
3.2% (8)
Women who did not give birth in the past 12 months Now married:
54.5% (1,488)Unmarried:
45.5% (1,245)
Marital status - Black or African American population 15 years and over
Males 6.1% Never married75.5% Now married1.7% Separated13.7% Widowed3.0% DivorcedFemales 25.8% Never married55.3% Now married0.0% Separated13.7% Widowed5.2% DivorcedWomen who gave birth in the past 12 months Now married:
100.0% (149)Unmarried:
0.0% (0)
Women who did not give birth in the past 12 months Now married:
56.7% (276)Unmarried:
43.3% (211)
Marital status - Asian population 15 years and over
Males 0.0% Never married100.0% Now married0.0% Separated0.0% Widowed0.0% DivorcedFemales 0.0% Never married99.2% Now married0.0% Separated0.0% Widowed0.8% DivorcedWomen who did not give birth in the past 12 months Now married:
100.0% (128)Unmarried:
0.0% (0)
Marital status - Other race population 15 years and over
Males 34.6% Never married56.0% Now married0.0% Separated0.0% Widowed9.4% DivorcedFemales 34.6% Never married38.2% Now married5.9% Separated10.5% Widowed10.8% DivorcedWomen who did not give birth in the past 12 months Now married:
37.4% (249)Unmarried:
62.6% (416)
Marital status - Two or more races population 15 years and over
Males 35.0% Never married64.5% Now married0.5% Separated0.0% Widowed0.0% DivorcedFemales 42.8% Never married36.5% Now married0.0% Separated15.2% Widowed5.4% DivorcedWomen who did not give birth in the past 12 months Now married:
41.9% (204)Unmarried:
58.1% (283)
Marital status - White alone, not Hispanic / Latino population 15 years and over
Males 29.8% Never married62.1% Now married0.1% Separated2.2% Widowed5.7% DivorcedFemales 25.9% Never married63.6% Now married0.0% Separated4.2% Widowed6.2% DivorcedWomen who gave birth in the past 12 months Now married:
96.8% (259)Unmarried:
3.2% (8)
Women who did not give birth in the past 12 months Now married:
56.6% (1,336)Unmarried:
43.4% (1,025)
Marital status - Hispanic or Latino population 15 years and over
Males 27.9% Never married63.0% Now married4.9% Separated0.0% Widowed4.2% DivorcedFemales 42.8% Never married39.4% Now married2.8% Separated7.6% Widowed7.4% DivorcedWomen who did not give birth in the past 12 months Now married:
35.3% (465)Unmarried:
64.7% (852)
Ancestries in Royse City
978 12.7% English832 10.8% Irish566 7.3% American528 6.8% German152 2.0% African130 1.7% Italian91 1.2% Scotch-Irish76 1.0% Scottish50 0.6% European49 0.6% Maltese47 0.6% French27 0.3% Dutch West Indian25 0.3% Sierra Leonean21 0.3% Portuguese19 0.2% Polish17 0.2% Norwegian15 0.2% British11 0.1% Greek10 0.1% Czech
Geographical mobility in Royse City Same house 1 year ago 9,367 85.8% White (Caucasian)1,125 67.8% Black or African American133 74.5% Asian1,657 90.3% Other race1,192 65.3% Two or more races7,887 85.5% White alone, not Hispanic / Latino3,404 82.1% Hispanic or LatinoMoved within same county 148 1.4% White / Caucasian204 11.2% Two or more races86 0.9% White alone, not Hispanic / Latino125 3.0% Hispanic or LatinoMoved within same state 1,232 11.3% White / Caucasian558 33.6% Black or African American176 9.6% Other race237 13.0% Two or more races1,071 11.6% White alone, not Hispanic / Latino503 12.1% Hispanic or LatinoMoved from different state 196 1.8% White / Caucasian54 30.5% Asian167 9.1% Two or more races178 1.9% White alone, not Hispanic / Latino133 3.2% Hispanic or LatinoMoved from abroad 27 0.2% White18 0.2% White alone, not Hispanic / Latino
Children Nativity (place of birth) in Royse City
Children under 6 years - Living with two parents Both parents native 857 100.0% NativeBoth parents foreign-born 98 100.0% NativeOne native, one foreign-born parent 35 100.0% NativeChildren under 6 years - Living with one parent Native parent 261 100.0% NativeChildren 6 to 17 years - Living with two parents Both parents native 1,744 100.0% Native0 0.0% Foreign-bornBoth parents foreign-born 85 73.7% Native30 26.3% Foreign-bornOne native, one foreign-born parent 156 100.0% NativeChildren 6 to 17 years - Living with one parent Native parent 535 100.0% Native
Grandparents responsible for own grandchildren in Royse City
Grandparents (30 to 59 years) White / Caucasian 72 100.0% Responsible for grandchildrenBlack or African American 1 100.0% Not responsible for grandchildrenOther race 41 100.0% Not responsible for grandchildrenTwo or more races 47 100.0% Responsible for grandchildrenWhite alone, not Hispanic / Latino 94 100.0% Responsible for grandchildrenHispanic or Latino 31 100.0% Not responsible for grandchildren
Grandparents (60 years and over) White / Caucasian 23 100.0% Not responsible for grandchildrenWhite alone, not Hispanic / Latino 30 100.0% Not responsible for grandchildrenHispanic or Latino 2 100.0% Not responsible for grandchildren