Races in Rowlett, Texas (TX) Detailed Stats
Data:
Races - White alone (%)
Races - White alone (% change since 2000)
Races - Black alone (%)
Races - Black alone (% change since 2000)
Races - American Indian alone (%)
Races - American Indian alone (% change since 2000)
Races - Asian alone (%)
Races - Asian alone (% change since 2000)
Races - Hispanic (%)
Races - Hispanic (% change since 2000)
Races - Native Hawaiian and Other Pacific Islander alone (%)
Races - Native Hawaiian and Other Pacific Islander alone (% change since 2000)
Races - Two or more races(%)
Races - Two or more races(% change since 2000)
Races - Other race alone (%)
Races - Other race alone (% change since 2000)
Racial diversity
Place of birth - Born in state of residence (%)
Place of birth - Born in state of residence (%) - White
Place of birth - Born in state of residence (%) - Black or African American
Place of birth - Born in state of residence (%) - Asian
Place of birth - Born in state of residence (%) - Hispanic or Latino
Place of birth - Born in state of residence (%) - American Indian and Alaska Native
Place of birth - Born in state of residence (%) - Multirace
Place of birth - Born in state of residence (%) - Other Race
Place of birth - Born in other state (%)
Place of birth - Born in other state (%) - White
Place of birth - Born in other state (%) - Black or African American
Place of birth - Born in other state (%) - Asian
Place of birth - Born in other state (%) - Hispanic or Latino
Place of birth - Born in other state (%) - American Indian and Alaska Native
Place of birth - Born in other state (%) - Multirace
Place of birth - Born in other state (%) - Other Race
Place of birth - Native, outside of US (%)
Place of birth - Native, outside of US (%) - White
Place of birth - Native, outside of US (%) - Black or African American
Place of birth - Native, outside of US (%) - Asian
Place of birth - Native, outside of US (%) - Hispanic or Latino
Place of birth - Native, outside of US (%) - American Indian and Alaska Native
Place of birth - Native, outside of US (%) - Multirace
Place of birth - Native, outside of US (%) - Other Race
Place of birth - Foreign born (%)
Place of birth - Foreign born (%) - White
Place of birth - Foreign born (%) - Black or African American
Place of birth - Foreign born (%) - Asian
Place of birth - Foreign born (%) - Hispanic or Latino
Place of birth - Foreign born (%) - American Indian and Alaska Native
Place of birth - Foreign born (%) - Multirace
Place of birth - Foreign born (%) - Other Race
Residents speaking English at home (%)
Residents speaking English at home - Born in the United States (%)
Residents speaking English at home - Native, born elsewhere (%)
Residents speaking English at home - Foreign born (%)
Residents speaking Spanish at home (%)
Residents speaking Spanish at home - Born in the United States (%)
Residents speaking Spanish at home - Native, born elsewhere (%)
Residents speaking Spanish at home - Foreign born (%)
Residents speaking other language at home (%)
Residents speaking other language at home - Born in the United States (%)
Residents speaking other language at home - Native, born elsewhere (%)
Residents speaking other language at home - Foreign born (%)
Marital status - Never married (%)
Marital status - Now married (%)
Marital status - Separated (%)
Marital status - Widowed (%)
Marital status - Divorced (%)
Ancestries Reported - Arab (%)
Ancestries Reported - Czech (%)
Ancestries Reported - Danish (%)
Ancestries Reported - Dutch (%)
Ancestries Reported - English (%)
Ancestries Reported - French (%)
Ancestries Reported - French Canadian (%)
Ancestries Reported - German (%)
Ancestries Reported - Greek (%)
Ancestries Reported - Hungarian (%)
Ancestries Reported - Irish (%)
Ancestries Reported - Italian (%)
Ancestries Reported - Lithuanian (%)
Ancestries Reported - Norwegian (%)
Ancestries Reported - Polish (%)
Ancestries Reported - Portuguese (%)
Ancestries Reported - Russian (%)
Ancestries Reported - Scotch-Irish (%)
Ancestries Reported - Scottish (%)
Ancestries Reported - Slovak (%)
Ancestries Reported - Subsaharan African (%)
Ancestries Reported - Swedish (%)
Ancestries Reported - Swiss (%)
Ancestries Reported - Ukrainian (%)
Ancestries Reported - United States (%)
Ancestries Reported - Welsh (%)
Ancestries Reported - West Indian (%)
Ancestries Reported - Other (%)
Geographical mobility - Same house 1 year ago (%)
Geographical mobility - Same house 1 year ago (%) - White
Geographical mobility - Same house 1 year ago (%) - Black or African American
Geographical mobility - Same house 1 year ago (%) - Asian
Geographical mobility - Same house 1 year ago (%) - Hispanic or Latino
Geographical mobility - Same house 1 year ago (%) - American Indian and Alaska Native
Geographical mobility - Same house 1 year ago (%) - Multirace
Geographical mobility - Same house 1 year ago (%) - Other Race
Geographical mobility - Moved within same county (%)
Geographical mobility - Moved within same county (%) - White
Geographical mobility - Moved within same county (%) - Black or African American
Geographical mobility - Moved within same county (%) - Asian
Geographical mobility - Moved within same county (%) - Hispanic or Latino
Geographical mobility - Moved within same county (%) - American Indian and Alaska Native
Geographical mobility - Moved within same county (%) - Multirace
Geographical mobility - Moved within same county (%) - Other Race
Geographical mobility - Moved from different county within same state (%)
Geographical mobility - Moved from different county within same state (%) - White
Geographical mobility - Moved from different county within same state (%) - Black or African American
Geographical mobility - Moved from different county within same state (%) - Asian
Geographical mobility - Moved from different county within same state (%) - Hispanic or Latino
Geographical mobility - Moved from different county within same state (%) - American Indian and Alaska Native
Geographical mobility - Moved from different county within same state (%) - Multirace
Geographical mobility - Moved from different county within same state (%) - Other Race
Geographical mobility - Moved from different state (%)
Geographical mobility - Moved from different state (%) - White
Geographical mobility - Moved from different state (%) - Black or African American
Geographical mobility - Moved from different state (%) - Asian
Geographical mobility - Moved from different state (%) - Hispanic or Latino
Geographical mobility - Moved from different state (%) - American Indian and Alaska Native
Geographical mobility - Moved from different state (%) - Multirace
Geographical mobility - Moved from different state (%) - Other Race
Geographical mobility - Moved from abroad (%)
Geographical mobility - Moved from abroad (%) - White
Geographical mobility - Moved from abroad (%) - Black or African American
Geographical mobility - Moved from abroad (%) - Asian
Geographical mobility - Moved from abroad (%) - Hispanic or Latino
Geographical mobility - Moved from abroad (%) - American Indian and Alaska Native
Geographical mobility - Moved from abroad (%) - Multirace
Geographical mobility - Moved from abroad (%) - Other Race
Place of birth for the foreign-born population - Ireland (%)
Place of birth for the foreign-born population - Denmark (%)
Place of birth for the foreign-born population - Norway (%)
Place of birth for the foreign-born population - Sweden (%)
Place of birth for the foreign-born population - United Kingdom (%)
Place of birth for the foreign-born population - England (%)
Place of birth for the foreign-born population - Scotland (%)
Place of birth for the foreign-born population - Other Northern Europe (%)
Place of birth for the foreign-born population - Austria (%)
Place of birth for the foreign-born population - Belgium (%)
Place of birth for the foreign-born population - France (%)
Place of birth for the foreign-born population - Germany (%)
Place of birth for the foreign-born population - Netherlands (%)
Place of birth for the foreign-born population - Switzerland (%)
Place of birth for the foreign-born population - Other Western Europe (%)
Place of birth for the foreign-born population - Greece (%)
Place of birth for the foreign-born population - Italy (%)
Place of birth for the foreign-born population - Portugal (%)
Place of birth for the foreign-born population - Spain (%)
Place of birth for the foreign-born population - Other Southern Europe (%)
Place of birth for the foreign-born population - Albania (%)
Place of birth for the foreign-born population - Belarus (%)
Place of birth for the foreign-born population - Bosnia and Herzegovina (%)
Place of birth for the foreign-born population - Bulgaria (%)
Place of birth for the foreign-born population - Croatia (%)
Place of birth for the foreign-born population - Czechoslovakia (%)
Place of birth for the foreign-born population - Hungary (%)
Place of birth for the foreign-born population - Latvia (%)
Place of birth for the foreign-born population - Lithuania (%)
Place of birth for the foreign-born population - North Macedonia (Macedonia) (%)
Place of birth for the foreign-born population - Moldova (%)
Place of birth for the foreign-born population - Poland (%)
Place of birth for the foreign-born population - Romania (%)
Place of birth for the foreign-born population - Russia (%)
Place of birth for the foreign-born population - Serbia (%)
Place of birth for the foreign-born population - Ukraine (%)
Place of birth for the foreign-born population - Other Eastern Europe (%)
Place of birth for the foreign-born population - China (%)
Place of birth for the foreign-born population - Hong Kong (%)
Place of birth for the foreign-born population - Taiwan (%)
Place of birth for the foreign-born population - Japan (%)
Place of birth for the foreign-born population - Korea (%)
Place of birth for the foreign-born population - Other Eastern Asia (%)
Place of birth for the foreign-born population - Afghanistan (%)
Place of birth for the foreign-born population - Bangladesh (%)
Place of birth for the foreign-born population - India (%)
Place of birth for the foreign-born population - Iran (%)
Place of birth for the foreign-born population - Kazakhstan (%)
Place of birth for the foreign-born population - Nepal (%)
Place of birth for the foreign-born population - Pakistan (%)
Place of birth for the foreign-born population - Sri Lanka (%)
Place of birth for the foreign-born population - Uzbekistan (%)
Place of birth for the foreign-born population - Other South Central Asia (%)
Place of birth for the foreign-born population - Burma (%)
Place of birth for the foreign-born population - Cambodia (%)
Place of birth for the foreign-born population - Indonesia (%)
Place of birth for the foreign-born population - Laos (%)
Place of birth for the foreign-born population - Malaysia (%)
Place of birth for the foreign-born population - Philippines (%)
Place of birth for the foreign-born population - Singapore (%)
Place of birth for the foreign-born population - Thailand (%)
Place of birth for the foreign-born population - Vietnam (%)
Place of birth for the foreign-born population - Other South Eastern Asia (%)
Place of birth for the foreign-born population - Armenia (%)
Place of birth for the foreign-born population - Iraq (%)
Place of birth for the foreign-born population - Israel (%)
Place of birth for the foreign-born population - Jordan (%)
Place of birth for the foreign-born population - Kuwait (%)
Place of birth for the foreign-born population - Lebanon (%)
Place of birth for the foreign-born population - Saudi Arabia (%)
Place of birth for the foreign-born population - Syria (%)
Place of birth for the foreign-born population - Turkey (%)
Place of birth for the foreign-born population - Yemen (%)
Place of birth for the foreign-born population - Other Western Asia (%)
Place of birth for the foreign-born population - Eritrea (%)
Place of birth for the foreign-born population - Ethiopia (%)
Place of birth for the foreign-born population - Kenya (%)
Place of birth for the foreign-born population - Somalia (%)
Place of birth for the foreign-born population - Uganda (%)
Place of birth for the foreign-born population - Zimbabwe (%)
Place of birth for the foreign-born population - Other Eastern Africa (%)
Place of birth for the foreign-born population - Cameroon (%)
Place of birth for the foreign-born population - Congo (%)
Place of birth for the foreign-born population - Democratic Republic of Congo (Zaire) (%)
Place of birth for the foreign-born population - Other Middle Africa (%)
Place of birth for the foreign-born population - Egypt (%)
Place of birth for the foreign-born population - Morocco (%)
Place of birth for the foreign-born population - Sudan (%)
Place of birth for the foreign-born population - Other Northern Africa (%)
Place of birth for the foreign-born population - South Africa (%)
Place of birth for the foreign-born population - Other Southern Africa (%)
Place of birth for the foreign-born population - Cabo Verde (%)
Place of birth for the foreign-born population - Ghana (%)
Place of birth for the foreign-born population - Liberia (%)
Place of birth for the foreign-born population - Nigeria (%)
Place of birth for the foreign-born population - Senegal (%)
Place of birth for the foreign-born population - Sierra Leone (%)
Place of birth for the foreign-born population - Other Western Africa (%)
Place of birth for the foreign-born population - Australia (%)
Place of birth for the foreign-born population - New Zealand (%)
Place of birth for the foreign-born population - Fiji (%)
Place of birth for the foreign-born population - Micronesia (%)
Place of birth for the foreign-born population - Bahamas (%)
Place of birth for the foreign-born population - Barbados (%)
Place of birth for the foreign-born population - Cuba (%)
Place of birth for the foreign-born population - Dominica (%)
Place of birth for the foreign-born population - Dominican Republic (%)
Place of birth for the foreign-born population - Grenada (%)
Place of birth for the foreign-born population - Haiti (%)
Place of birth for the foreign-born population - Jamaica (%)
Place of birth for the foreign-born population - St. Vincent and the Grenadines (%)
Place of birth for the foreign-born population - Trinidad and Tobago (%)
Place of birth for the foreign-born population - West Indies (%)
Place of birth for the foreign-born population - Other Caribbean (%)
Place of birth for the foreign-born population - Belize (%)
Place of birth for the foreign-born population - Costa Rica (%)
Place of birth for the foreign-born population - El Salvador (%)
Place of birth for the foreign-born population - Guatemala (%)
Place of birth for the foreign-born population - Honduras (%)
Place of birth for the foreign-born population - Mexico (%)
Place of birth for the foreign-born population - Nicaragua (%)
Place of birth for the foreign-born population - Panama (%)
Place of birth for the foreign-born population - Other Central America (%)
Place of birth for the foreign-born population - Argentina (%)
Place of birth for the foreign-born population - Bolivia (%)
Place of birth for the foreign-born population - Brazil (%)
Place of birth for the foreign-born population - Chile (%)
Place of birth for the foreign-born population - Colombia (%)
Place of birth for the foreign-born population - Ecuador (%)
Place of birth for the foreign-born population - Guyana (%)
Place of birth for the foreign-born population - Peru (%)
Place of birth for the foreign-born population - Uruguay (%)
Place of birth for the foreign-born population - Venezuela (%)
Place of birth for the foreign-born population - Other South America (%)
Place of birth for the foreign-born population - Canada (%)
Place of birth for the foreign-born population - Other Northern America (%)
Place of birth for the foreign-born population - Other (%)
Latest news about races in Rowlett, TX collected exclusively by city-data.com from local newspapers, TV, and radio stations
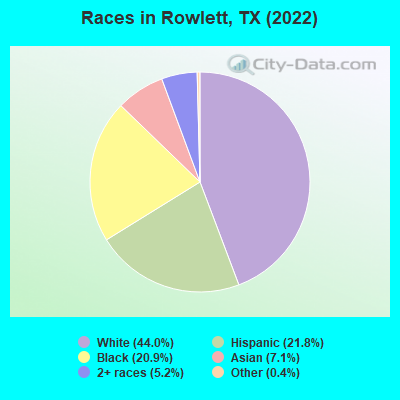
According to 2022 data, the most numerous races in Rowlett, TX are Hispanic (13,757 residents), White alone (27,837 residents), and Black alone (13,220 residents). 76.7% of Rowlett residents speak English at home. 16.3% of Rowlett, TX residents are foreign-born (5.9% born in Latin America, 5.3% born in Asia, 3.6% born in Africa), which is 4.3% less than the foreign-born rate of 17.0% across the entire state of Texas.
Race distribution in Rowlett
2000 2022
10,933,313 52.4% White alone 6,669,666 32.0% Hispanic 2,364,255 11.3% Black alone 554,445 2.7% Asian alone 230,567 1.1% Two or more races 68,859 0.3% American Indian alone 19,958 0.10% Other race alone 10,757 0.05% Native Hawaiian and Other
12,070,642 40.2% Hispanic 11,683,430 38.9% White alone 3,508,706 11.7% Black alone 1,608,173 5.4% Asian alone 956,560 3.2% Two or more races 125,763 0.4% Other race alone 47,023 0.2% American Indian alone 29,275 0.10% Native Hawaiian and Other
Income and house value in Rowlett Median household income in 2022 $123,379 White non-Hispanic householders$67,666 Black householders$100,343 Asian householders$108,174 Some other race householders$89,969 Two or more races householders$103,547 Hispanic or Latino race householdersMedian 2022 house value $366,186 White Non-Hispanic householders$369,324 Black or African American householders$357,086 American Indian or Alaska Native householders $520,254 Asian householders$353,007 Native Hawaiian and other Pacific Islander householders$312,529 Some other race householders$330,101 Two or more races householders$322,883 Hispanic or Latino householders
Median age by race in Rowlett
42.4 Median age for White residents42.1 42.6 39.1 Median age for Black or African American residents36.0 41.6 6.4 Median age for American Indian / Alaska Native residents-666,666,666.0 -666,666,666.0 42.6 Median age for Asian residents42.3 44.6 -666,666,666.0 Median age for Native Hawaiian / Pacific Islander residents-666,666,666.0 -666,666,666.0 49.4 Median age for Other race residents37.0 50.0 29.0 Median age for Two or more races residents28.3 30.6 45.5 Median age for White alone residents45.8 44.9 30.6 Median age for Hispanic or Latino residents27.6 35.5
Owner/renter occupied households by race in Rowlett
House owners and renters - White residents 11,367 84.4% Owner occupied2,108 15.6% Renter occupiedHouse owners and renters - Black or African American residents 2,718 55.8% Owner occupied2,153 44.2% Renter occupiedHouse owners and renters - American Indian / Alaska Native residents 71 100.0% Owner occupiedHouse owners and renters - Asian residents 1,183 79.6% Owner occupied303 20.4% Renter occupiedHouse owners and renters - Other race residents 693 90.2% Owner occupied75 9.8% Renter occupiedHouse owners and renters - Two or more races residents 1,332 85.3% Owner occupied229 14.7% Renter occupiedHouse owners and renters - White alone residents 9,911 84.8% Owner occupied1,771 15.2% Renter occupiedHouse owners and renters - Hispanic or Latino residents 3,434 83.7% Owner occupied667 16.3% Renter occupied
Language usage in Rowlett
English speakers - Total 76.7% of residents of Rowlett speak English at home.
15.9% of residents speak Spanish at home 7,317 75.5% Speak English very well2,377 24.5% Speak English less than very well7.4% of residents speak other language at home 3,011 66.8% Speak English very well1,494 33.2% Speak English less than very well
English speakers - Born in the United States 89.9% of residents of Rowlett speak English at home.
8.2% of residents speak Spanish at home 994 75.4% Speak English very well325 24.6% Speak English less than very well1.9% of residents speak other language at home 311 100.0% Speak English very well
English speakers - Native, born elsewhere 82.5% of residents of Rowlett speak English at home.
10.6% of residents speak Spanish at home 210 100.0% Speak English very well6.9% of residents speak other language at home 70 51.5% Speak English very well66 48.5% Speak English less than very well
English speakers - Foreign-born 31.9% of residents of Rowlett speak English at home.
34.7% of residents speak Spanish at home 1,859 54.4% Speak English very well1,556 45.6% Speak English less than very well33.4% of residents speak other language at home 2,037 62.0% Speak English very well1,247 38.0% Speak English less than very well
White (Caucasian) - Speak only English Native:
100.0% (25,780)Foreign-born:
25.5% (322)
White (Caucasian) - Speak another language Native:
5.1% (1,306)Foreign-born:
74.4% (942)
Black or African American - Speak only English Native:
96.7% (10,210)Foreign-born:
27.4% (639)
Black or African American - Speak another language Native:
3.2% (341)Foreign-born:
72.2% (1,686)
American Indian / Alaska Native - Speak another language Native:
17.4% (26)Foreign-born:
100.0% (128)
Asian - Speak only English Native:
49.2% (774)Foreign-born:
11.4% (311)
Asian - Speak another language Native:
50.8% (799)Foreign-born:
88.6% (2,415)
Other race - Speak only English Native:
54.3% (946)Foreign-born:
11.3% (88)
Other race - Speak another language Native:
46.3% (806)Foreign-born:
88.6% (685)
Two or more races - Speak only English Native:
60.1% (2,294)Foreign-born:
2.8% (60)
Two or more races - Speak another language Native:
39.9% (1,525)Foreign-born:
97.2% (2,084)
White alone - Speak only English Native:
99.0% (25,573)Foreign-born:
41.7% (292)
White alone - Speak another language Native:
1.5% (394)Foreign-born:
58.7% (412)
Hispanic or Latino - Speak only English Native:
54.4% (5,906)Foreign-born:
7.8% (288)
Hispanic or Latino - Speak another language Native:
45.6% (4,955)Foreign-born:
92.2% (3,415)
Foreign-born residents in Rowlett 10,299 residents are foreign born (5.9% Latin America , 5.3% Asia , 3.6% Africa ).
This city:
16.3%Texas:
17.1%
Marital status for residents in Rowlett Marital status - White (Caucasian) population 15 years and over
Males 29.4% Never married61.0% Now married0.4% Separated2.4% Widowed6.9% DivorcedFemales 16.8% Never married66.1% Now married0.5% Separated4.2% Widowed12.4% DivorcedWomen who gave birth in the past 12 months Now married:
100.0% (559)Unmarried:
0.0% (0)
Women who did not give birth in the past 12 months Now married:
57.2% (4,320)Unmarried:
42.8% (3,236)
Marital status - Black or African American population 15 years and over
Males 27.7% Never married57.9% Now married0.0% Separated4.6% Widowed9.9% DivorcedFemales 38.0% Never married44.9% Now married0.0% Separated5.5% Widowed11.6% DivorcedWomen who gave birth in the past 12 months Now married:
100.0% (235)Unmarried:
0.0% (0)
Women who did not give birth in the past 12 months Now married:
37.4% (1,297)Unmarried:
62.6% (2,175)
Marital status - American Indian / Alaska Native population 15 years and over
Males 16.0% Never married84.0% Now married0.0% Separated0.0% Widowed0.0% DivorcedFemales 24.1% Never married75.9% Now married0.0% Separated0.0% Widowed0.0% DivorcedWomen who did not give birth in the past 12 months Now married:
52.5% (20)Unmarried:
47.5% (18)
Marital status - Asian population 15 years and over
Males 31.9% Never married65.8% Now married0.0% Separated1.2% Widowed1.1% DivorcedFemales 28.0% Never married64.2% Now married1.3% Separated3.3% Widowed3.1% DivorcedWomen who gave birth in the past 12 months Now married:
100.0% (80)Unmarried:
0.0% (0)
Women who did not give birth in the past 12 months Now married:
55.4% (666)Unmarried:
44.6% (537)
Marital status - Other race population 15 years and over
Males 30.2% Never married69.8% Now married0.0% Separated0.0% Widowed0.0% DivorcedFemales 16.9% Never married70.6% Now married1.3% Separated4.0% Widowed7.3% DivorcedWomen who gave birth in the past 12 months Now married:
100.0% (23)Unmarried:
0.0% (0)
Women who did not give birth in the past 12 months Now married:
63.8% (362)Unmarried:
36.2% (205)
Marital status - Two or more races population 15 years and over
Males 44.2% Never married49.4% Now married0.6% Separated0.0% Widowed5.8% DivorcedFemales 24.8% Never married64.4% Now married0.0% Separated8.2% Widowed2.5% DivorcedWomen who gave birth in the past 12 months Now married:
100.0% (117)Unmarried:
0.0% (0)
Women who did not give birth in the past 12 months Now married:
64.8% (1,328)Unmarried:
35.2% (721)
Marital status - White alone, not Hispanic / Latino population 15 years and over
Males 21.8% Never married66.2% Now married0.5% Separated3.0% Widowed8.6% DivorcedFemales 17.8% Never married65.2% Now married0.7% Separated5.0% Widowed11.3% DivorcedWomen who gave birth in the past 12 months Now married:
100.0% (559)Unmarried:
0.0% (0)
Women who did not give birth in the past 12 months Now married:
52.5% (3,036)Unmarried:
47.5% (2,743)
Marital status - Hispanic or Latino population 15 years and over
Males 49.7% Never married49.1% Now married0.2% Separated0.0% Widowed1.0% DivorcedFemales 17.8% Never married68.9% Now married1.1% Separated2.8% Widowed9.4% DivorcedWomen who gave birth in the past 12 months Now married:
100.0% (137)Unmarried:
0.0% (0)
Women who did not give birth in the past 12 months Now married:
68.4% (2,718)Unmarried:
31.6% (1,254)
Ancestries in Rowlett
2,654 8.0% English2,218 6.7% Irish1,869 5.6% American1,592 4.8% German1,336 4.0% Ethiopian496 1.5% Italian384 1.2% Nigerian372 1.1% European297 0.9% Scottish257 0.8% Scotch-Irish210 0.6% African208 0.6% Polish164 0.5% Egyptian150 0.5% Dutch146 0.4% Czech134 0.4% French Canadian114 0.3% French105 0.3% Welsh89 0.3% British83 0.2% Swedish76 0.2% Northern European69 0.2% Jamaican59 0.2% Eastern European57 0.2% Haitian49 0.1% Iranian46 0.1% Slavic42 0.1% Lebanese41 0.1% South African31 0.09% Belgian30 0.09% Norwegian29 0.09% Ukrainian26 0.08% Cajun23 0.07% Swiss21 0.06% Basque19 0.06% Portuguese18 0.05% Hungarian16 0.05% Greek16 0.05% Yugoslavian15 0.05% Canadian10 0.03% Russian8 0.02% Romanian8 0.02% Czechoslovakian7 0.02% Lithuanian7 0.02% Finnish7 0.02% British West Indian5 0.02% Danish
Geographical mobility in Rowlett Same house 1 year ago 31,752 90.7% White (Caucasian)10,794 79.5% Black or African American252 78.9% American Indian / Alaska Native4,000 87.6% Asian2,036 80.4% Other race8,961 91.8% Two or more races26,219 92.2% White alone, not Hispanic / Latino12,918 84.6% Hispanic or LatinoMoved within same county 1,892 5.4% White / Caucasian1,870 13.8% Black or African American309 6.8% Asian16 44.4% Native Hawaiian / Pacific Islander129 5.1% Other race347 3.6% Two or more races859 3.0% White alone, not Hispanic / Latino1,269 8.3% Hispanic or LatinoMoved within same state 753 2.2% White / Caucasian420 3.1% Black or African American60 18.7% American Indian / Alaska Native82 1.8% Asian322 12.7% Other race391 4.0% Two or more races753 2.6% White alone, not Hispanic / Latino1,073 7.0% Hispanic or LatinoMoved from different state 523 1.5% White / Caucasian364 2.7% Black or African American17 5.5% American Indian / Alaska Native65 0.7% Two or more races523 1.8% White alone, not Hispanic / Latino18 0.1% Hispanic or LatinoMoved from abroad 92 0.3% White155 1.1% Black or African American26 0.6% Asian15 0.6% Other race92 0.3% White alone, not Hispanic / Latino
Children Nativity (place of birth) in Rowlett
Children under 6 years - Living with two parents Both parents native 2,306 100.0% NativeBoth parents foreign-born 866 100.0% NativeOne native, one foreign-born parent 425 100.0% NativeChildren under 6 years - Living with one parent Native parent 863 100.0% NativeForeign-born parent 15 28.9% Native38 71.1% Foreign-bornChildren 6 to 17 years - Living with two parents Both parents native 3,711 99.7% Native9 0.3% Foreign-bornBoth parents foreign-born 1,495 83.9% Native287 16.1% Foreign-bornOne native, one foreign-born parent 1,141 100.0% NativeChildren 6 to 17 years - Living with one parent Native parent 2,904 100.0% NativeForeign-born parent 76 51.8% Native71 48.2% Foreign-born
Place of birth for residents in Rowlett 3,974 Americas3,851 Latin America3,476 Asia3,058 Central America2,334 Africa2,266 South Eastern Asia1,458 Eastern Africa962 South Central Asia452 South America444 Europe384 Middle Africa339 Caribbean318 Western Africa234 Northern Europe193 Eastern Asia157 China141 Eastern Europe123 Northern America118 Northern Africa68 Western Europe68 Oceania55 Southern Africa46 Western Asia39 Australia and New Zealand Subregion2,666 Mexico1,383 Ethiopia1,294 Vietnam836 Philippines515 India270 Peru266 Nigeria194 Cameroon189 Democratic Republic of Congo (Zaire)182 Pakistan155 Colombia147 Dominican Republic129 China124 Costa Rica123 Canada122 Bangladesh118 Egypt116 Iran108 England104 Honduras100 Guatemala86 United Kingdom80 Jamaica62 El Salvador55 South Africa54 Haiti51 Germany51 Ghana50 Bosnia and Herzegovina49 Cambodia42 Cuba39 New Zealand39 Kenya39 Thailand39 Scotland31 Poland29 Burma (Myanmar)27 Taiwan26 Israel26 Nepal25 Japan24 Zimbabwe21 Romania19 Lebanon17 Laos17 Ecuador15 Russia11 Austria10 Ukraine10 Eritrea10 Korea9 Venezuela8 Trinidad and Tobago6 Grenada5 France4 Hungary
Grandparents responsible for own grandchildren in Rowlett
Grandparents (30 to 59 years) White / Caucasian 83 34.9% Responsible for grandchildren155 65.1% Not responsible for grandchildrenBlack or African American 207 70.5% Responsible for grandchildren87 29.5% Not responsible for grandchildrenAsian 14 100.0% Not responsible for grandchildrenOther race 30 100.0% Responsible for grandchildrenTwo or more races 31 9.4% Responsible for grandchildren302 90.6% Not responsible for grandchildrenWhite alone, not Hispanic / Latino 169 69.5% Responsible for grandchildren74 30.5% Not responsible for grandchildrenHispanic or Latino 33 9.3% Responsible for grandchildren320 90.7% Not responsible for grandchildrenGrandparents (60 years and over) White / Caucasian 125 47.9% Responsible for grandchildren136 52.1% Not responsible for grandchildrenBlack or African American 78 27.4% Responsible for grandchildren206 72.6% Not responsible for grandchildrenAsian 39 29.8% Responsible for grandchildren93 70.2% Not responsible for grandchildrenOther race 23 100.0% Not responsible for grandchildrenTwo or more races 13 5.7% Responsible for grandchildren212 94.3% Not responsible for grandchildrenWhite alone, not Hispanic / Latino 159 38.0% Responsible for grandchildren260 62.0% Not responsible for grandchildrenHispanic or Latino 175 100.0% Not responsible for grandchildren