Races in Red Rock, New Mexico (NM) Detailed Stats
Ancestries, Foreign-born residents, place of birth
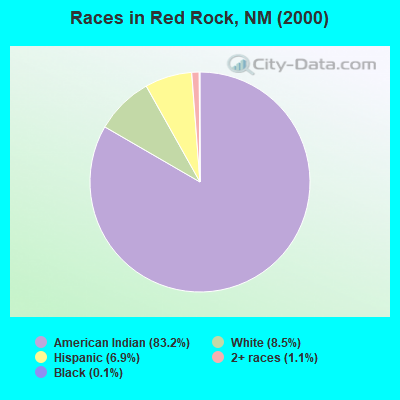
Race distribution in Red Rock

- 21,71883.2%American Indian alone
- 2,2258.5%White alone
- 1,8096.9%Hispanic
- 2951.1%Two or more races
- 330.1%Black alone
- 160.06%Asian alone
- 80.03%Native Hawaiian and Other
Pacific Islander alone - 20.01%Other race alone
2000
2022
-
- 813,49544.7%White alone
- 765,38642.1%Hispanic
- 161,4608.9%American Indian alone
- 30,6541.7%Black alone
- 25,7931.4%Two or more races
- 18,2571.0%Asian alone
- 3,0090.2%Other race alone
- 9920.05%Native Hawaiian and Other
Pacific Islander alone

-
- 1,059,86750.2%Hispanic
- 735,47834.8%White alone
- 171,8088.1%American Indian alone
- 65,0843.1%Two or more races
- 36,8701.7%Black alone
- 35,8701.7%Asian alone
- 7,5820.4%Other race alone
- 7850.04%Native Hawaiian and Other
Pacific Islander alone

Income and house value in Red Rock
- Median household income in 2022
- $76,681White non-Hispanic householders
- $31,977American Indian and Alaska Native householders
- $131,069Asian householders
- $77,181Some other race householders
- $65,606Two or more races householders
- $60,597Hispanic or Latino race householders
- Median 2022 house value
- $203,427White Non-Hispanic householders
- $32,139American Indian or Alaska Native householders
- $176,489Asian householders
- $130,974Some other race householders
- $139,334Two or more races householders
- $109,609Hispanic or Latino householders
Household income for White non-Hispanic householders

Household income for American Indian and Alaska Native householders

Household income for Asian householders

Household income for Two or more races householders

Household income for Hispanic or Latino race householders

Zip code: 87316