Races in Prosper, Texas (TX) Detailed Stats
Data:
Races - White alone (%)
Races - White alone (% change since 2000)
Races - Black alone (%)
Races - Black alone (% change since 2000)
Races - American Indian alone (%)
Races - American Indian alone (% change since 2000)
Races - Asian alone (%)
Races - Asian alone (% change since 2000)
Races - Hispanic (%)
Races - Hispanic (% change since 2000)
Races - Native Hawaiian and Other Pacific Islander alone (%)
Races - Native Hawaiian and Other Pacific Islander alone (% change since 2000)
Races - Two or more races(%)
Races - Two or more races(% change since 2000)
Races - Other race alone (%)
Races - Other race alone (% change since 2000)
Racial diversity
Place of birth - Born in state of residence (%)
Place of birth - Born in state of residence (%) - White
Place of birth - Born in state of residence (%) - Black or African American
Place of birth - Born in state of residence (%) - Asian
Place of birth - Born in state of residence (%) - Hispanic or Latino
Place of birth - Born in state of residence (%) - American Indian and Alaska Native
Place of birth - Born in state of residence (%) - Multirace
Place of birth - Born in state of residence (%) - Other Race
Place of birth - Born in other state (%)
Place of birth - Born in other state (%) - White
Place of birth - Born in other state (%) - Black or African American
Place of birth - Born in other state (%) - Asian
Place of birth - Born in other state (%) - Hispanic or Latino
Place of birth - Born in other state (%) - American Indian and Alaska Native
Place of birth - Born in other state (%) - Multirace
Place of birth - Born in other state (%) - Other Race
Place of birth - Native, outside of US (%)
Place of birth - Native, outside of US (%) - White
Place of birth - Native, outside of US (%) - Black or African American
Place of birth - Native, outside of US (%) - Asian
Place of birth - Native, outside of US (%) - Hispanic or Latino
Place of birth - Native, outside of US (%) - American Indian and Alaska Native
Place of birth - Native, outside of US (%) - Multirace
Place of birth - Native, outside of US (%) - Other Race
Place of birth - Foreign born (%)
Place of birth - Foreign born (%) - White
Place of birth - Foreign born (%) - Black or African American
Place of birth - Foreign born (%) - Asian
Place of birth - Foreign born (%) - Hispanic or Latino
Place of birth - Foreign born (%) - American Indian and Alaska Native
Place of birth - Foreign born (%) - Multirace
Place of birth - Foreign born (%) - Other Race
Residents speaking English at home (%)
Residents speaking English at home - Born in the United States (%)
Residents speaking English at home - Native, born elsewhere (%)
Residents speaking English at home - Foreign born (%)
Residents speaking Spanish at home (%)
Residents speaking Spanish at home - Born in the United States (%)
Residents speaking Spanish at home - Native, born elsewhere (%)
Residents speaking Spanish at home - Foreign born (%)
Residents speaking other language at home (%)
Residents speaking other language at home - Born in the United States (%)
Residents speaking other language at home - Native, born elsewhere (%)
Residents speaking other language at home - Foreign born (%)
Marital status - Never married (%)
Marital status - Now married (%)
Marital status - Separated (%)
Marital status - Widowed (%)
Marital status - Divorced (%)
Ancestries Reported - Arab (%)
Ancestries Reported - Czech (%)
Ancestries Reported - Danish (%)
Ancestries Reported - Dutch (%)
Ancestries Reported - English (%)
Ancestries Reported - French (%)
Ancestries Reported - French Canadian (%)
Ancestries Reported - German (%)
Ancestries Reported - Greek (%)
Ancestries Reported - Hungarian (%)
Ancestries Reported - Irish (%)
Ancestries Reported - Italian (%)
Ancestries Reported - Lithuanian (%)
Ancestries Reported - Norwegian (%)
Ancestries Reported - Polish (%)
Ancestries Reported - Portuguese (%)
Ancestries Reported - Russian (%)
Ancestries Reported - Scotch-Irish (%)
Ancestries Reported - Scottish (%)
Ancestries Reported - Slovak (%)
Ancestries Reported - Subsaharan African (%)
Ancestries Reported - Swedish (%)
Ancestries Reported - Swiss (%)
Ancestries Reported - Ukrainian (%)
Ancestries Reported - United States (%)
Ancestries Reported - Welsh (%)
Ancestries Reported - West Indian (%)
Ancestries Reported - Other (%)
Geographical mobility - Same house 1 year ago (%)
Geographical mobility - Same house 1 year ago (%) - White
Geographical mobility - Same house 1 year ago (%) - Black or African American
Geographical mobility - Same house 1 year ago (%) - Asian
Geographical mobility - Same house 1 year ago (%) - Hispanic or Latino
Geographical mobility - Same house 1 year ago (%) - American Indian and Alaska Native
Geographical mobility - Same house 1 year ago (%) - Multirace
Geographical mobility - Same house 1 year ago (%) - Other Race
Geographical mobility - Moved within same county (%)
Geographical mobility - Moved within same county (%) - White
Geographical mobility - Moved within same county (%) - Black or African American
Geographical mobility - Moved within same county (%) - Asian
Geographical mobility - Moved within same county (%) - Hispanic or Latino
Geographical mobility - Moved within same county (%) - American Indian and Alaska Native
Geographical mobility - Moved within same county (%) - Multirace
Geographical mobility - Moved within same county (%) - Other Race
Geographical mobility - Moved from different county within same state (%)
Geographical mobility - Moved from different county within same state (%) - White
Geographical mobility - Moved from different county within same state (%) - Black or African American
Geographical mobility - Moved from different county within same state (%) - Asian
Geographical mobility - Moved from different county within same state (%) - Hispanic or Latino
Geographical mobility - Moved from different county within same state (%) - American Indian and Alaska Native
Geographical mobility - Moved from different county within same state (%) - Multirace
Geographical mobility - Moved from different county within same state (%) - Other Race
Geographical mobility - Moved from different state (%)
Geographical mobility - Moved from different state (%) - White
Geographical mobility - Moved from different state (%) - Black or African American
Geographical mobility - Moved from different state (%) - Asian
Geographical mobility - Moved from different state (%) - Hispanic or Latino
Geographical mobility - Moved from different state (%) - American Indian and Alaska Native
Geographical mobility - Moved from different state (%) - Multirace
Geographical mobility - Moved from different state (%) - Other Race
Geographical mobility - Moved from abroad (%)
Geographical mobility - Moved from abroad (%) - White
Geographical mobility - Moved from abroad (%) - Black or African American
Geographical mobility - Moved from abroad (%) - Asian
Geographical mobility - Moved from abroad (%) - Hispanic or Latino
Geographical mobility - Moved from abroad (%) - American Indian and Alaska Native
Geographical mobility - Moved from abroad (%) - Multirace
Geographical mobility - Moved from abroad (%) - Other Race
Place of birth for the foreign-born population - Ireland (%)
Place of birth for the foreign-born population - Denmark (%)
Place of birth for the foreign-born population - Norway (%)
Place of birth for the foreign-born population - Sweden (%)
Place of birth for the foreign-born population - United Kingdom (%)
Place of birth for the foreign-born population - England (%)
Place of birth for the foreign-born population - Scotland (%)
Place of birth for the foreign-born population - Other Northern Europe (%)
Place of birth for the foreign-born population - Austria (%)
Place of birth for the foreign-born population - Belgium (%)
Place of birth for the foreign-born population - France (%)
Place of birth for the foreign-born population - Germany (%)
Place of birth for the foreign-born population - Netherlands (%)
Place of birth for the foreign-born population - Switzerland (%)
Place of birth for the foreign-born population - Other Western Europe (%)
Place of birth for the foreign-born population - Greece (%)
Place of birth for the foreign-born population - Italy (%)
Place of birth for the foreign-born population - Portugal (%)
Place of birth for the foreign-born population - Spain (%)
Place of birth for the foreign-born population - Other Southern Europe (%)
Place of birth for the foreign-born population - Albania (%)
Place of birth for the foreign-born population - Belarus (%)
Place of birth for the foreign-born population - Bosnia and Herzegovina (%)
Place of birth for the foreign-born population - Bulgaria (%)
Place of birth for the foreign-born population - Croatia (%)
Place of birth for the foreign-born population - Czechoslovakia (%)
Place of birth for the foreign-born population - Hungary (%)
Place of birth for the foreign-born population - Latvia (%)
Place of birth for the foreign-born population - Lithuania (%)
Place of birth for the foreign-born population - North Macedonia (Macedonia) (%)
Place of birth for the foreign-born population - Moldova (%)
Place of birth for the foreign-born population - Poland (%)
Place of birth for the foreign-born population - Romania (%)
Place of birth for the foreign-born population - Russia (%)
Place of birth for the foreign-born population - Serbia (%)
Place of birth for the foreign-born population - Ukraine (%)
Place of birth for the foreign-born population - Other Eastern Europe (%)
Place of birth for the foreign-born population - China (%)
Place of birth for the foreign-born population - Hong Kong (%)
Place of birth for the foreign-born population - Taiwan (%)
Place of birth for the foreign-born population - Japan (%)
Place of birth for the foreign-born population - Korea (%)
Place of birth for the foreign-born population - Other Eastern Asia (%)
Place of birth for the foreign-born population - Afghanistan (%)
Place of birth for the foreign-born population - Bangladesh (%)
Place of birth for the foreign-born population - India (%)
Place of birth for the foreign-born population - Iran (%)
Place of birth for the foreign-born population - Kazakhstan (%)
Place of birth for the foreign-born population - Nepal (%)
Place of birth for the foreign-born population - Pakistan (%)
Place of birth for the foreign-born population - Sri Lanka (%)
Place of birth for the foreign-born population - Uzbekistan (%)
Place of birth for the foreign-born population - Other South Central Asia (%)
Place of birth for the foreign-born population - Burma (%)
Place of birth for the foreign-born population - Cambodia (%)
Place of birth for the foreign-born population - Indonesia (%)
Place of birth for the foreign-born population - Laos (%)
Place of birth for the foreign-born population - Malaysia (%)
Place of birth for the foreign-born population - Philippines (%)
Place of birth for the foreign-born population - Singapore (%)
Place of birth for the foreign-born population - Thailand (%)
Place of birth for the foreign-born population - Vietnam (%)
Place of birth for the foreign-born population - Other South Eastern Asia (%)
Place of birth for the foreign-born population - Armenia (%)
Place of birth for the foreign-born population - Iraq (%)
Place of birth for the foreign-born population - Israel (%)
Place of birth for the foreign-born population - Jordan (%)
Place of birth for the foreign-born population - Kuwait (%)
Place of birth for the foreign-born population - Lebanon (%)
Place of birth for the foreign-born population - Saudi Arabia (%)
Place of birth for the foreign-born population - Syria (%)
Place of birth for the foreign-born population - Turkey (%)
Place of birth for the foreign-born population - Yemen (%)
Place of birth for the foreign-born population - Other Western Asia (%)
Place of birth for the foreign-born population - Eritrea (%)
Place of birth for the foreign-born population - Ethiopia (%)
Place of birth for the foreign-born population - Kenya (%)
Place of birth for the foreign-born population - Somalia (%)
Place of birth for the foreign-born population - Uganda (%)
Place of birth for the foreign-born population - Zimbabwe (%)
Place of birth for the foreign-born population - Other Eastern Africa (%)
Place of birth for the foreign-born population - Cameroon (%)
Place of birth for the foreign-born population - Congo (%)
Place of birth for the foreign-born population - Democratic Republic of Congo (Zaire) (%)
Place of birth for the foreign-born population - Other Middle Africa (%)
Place of birth for the foreign-born population - Egypt (%)
Place of birth for the foreign-born population - Morocco (%)
Place of birth for the foreign-born population - Sudan (%)
Place of birth for the foreign-born population - Other Northern Africa (%)
Place of birth for the foreign-born population - South Africa (%)
Place of birth for the foreign-born population - Other Southern Africa (%)
Place of birth for the foreign-born population - Cabo Verde (%)
Place of birth for the foreign-born population - Ghana (%)
Place of birth for the foreign-born population - Liberia (%)
Place of birth for the foreign-born population - Nigeria (%)
Place of birth for the foreign-born population - Senegal (%)
Place of birth for the foreign-born population - Sierra Leone (%)
Place of birth for the foreign-born population - Other Western Africa (%)
Place of birth for the foreign-born population - Australia (%)
Place of birth for the foreign-born population - New Zealand (%)
Place of birth for the foreign-born population - Fiji (%)
Place of birth for the foreign-born population - Micronesia (%)
Place of birth for the foreign-born population - Bahamas (%)
Place of birth for the foreign-born population - Barbados (%)
Place of birth for the foreign-born population - Cuba (%)
Place of birth for the foreign-born population - Dominica (%)
Place of birth for the foreign-born population - Dominican Republic (%)
Place of birth for the foreign-born population - Grenada (%)
Place of birth for the foreign-born population - Haiti (%)
Place of birth for the foreign-born population - Jamaica (%)
Place of birth for the foreign-born population - St. Vincent and the Grenadines (%)
Place of birth for the foreign-born population - Trinidad and Tobago (%)
Place of birth for the foreign-born population - West Indies (%)
Place of birth for the foreign-born population - Other Caribbean (%)
Place of birth for the foreign-born population - Belize (%)
Place of birth for the foreign-born population - Costa Rica (%)
Place of birth for the foreign-born population - El Salvador (%)
Place of birth for the foreign-born population - Guatemala (%)
Place of birth for the foreign-born population - Honduras (%)
Place of birth for the foreign-born population - Mexico (%)
Place of birth for the foreign-born population - Nicaragua (%)
Place of birth for the foreign-born population - Panama (%)
Place of birth for the foreign-born population - Other Central America (%)
Place of birth for the foreign-born population - Argentina (%)
Place of birth for the foreign-born population - Bolivia (%)
Place of birth for the foreign-born population - Brazil (%)
Place of birth for the foreign-born population - Chile (%)
Place of birth for the foreign-born population - Colombia (%)
Place of birth for the foreign-born population - Ecuador (%)
Place of birth for the foreign-born population - Guyana (%)
Place of birth for the foreign-born population - Peru (%)
Place of birth for the foreign-born population - Uruguay (%)
Place of birth for the foreign-born population - Venezuela (%)
Place of birth for the foreign-born population - Other South America (%)
Place of birth for the foreign-born population - Canada (%)
Place of birth for the foreign-born population - Other Northern America (%)
Place of birth for the foreign-born population - Other (%)
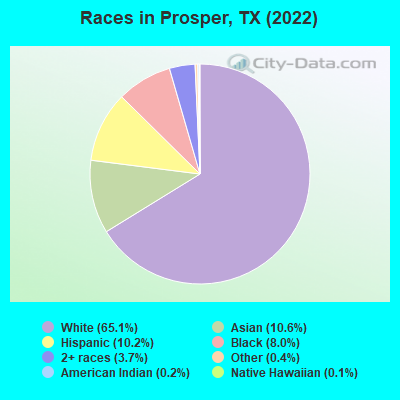
According to 2022 data, the most numerous races in Prosper, TX are Hispanic (3,452 residents), White alone (22,025 residents), and Black alone (2,722 residents). 83.6% of Prosper residents speak English at home. 12.8% of Prosper, TX residents are foreign-born (6.7% born in Asia, 2.2% born in Latin America, 1.6% born in Europe, 1.5% born in Africa), which is 33.3% less than the foreign-born rate of 17.0% across the entire state of Texas.
Race distribution in Prosper
2000 2022
10,933,313 52.4% White alone 6,669,666 32.0% Hispanic 2,364,255 11.3% Black alone 554,445 2.7% Asian alone 230,567 1.1% Two or more races 68,859 0.3% American Indian alone 19,958 0.10% Other race alone 10,757 0.05% Native Hawaiian and Other
12,070,642 40.2% Hispanic 11,683,430 38.9% White alone 3,508,706 11.7% Black alone 1,608,173 5.4% Asian alone 956,560 3.2% Two or more races 125,763 0.4% Other race alone 47,023 0.2% American Indian alone 29,275 0.10% Native Hawaiian and Other
Income and house value in Prosper Median household income in 2022 $175,705 White non-Hispanic householders$183,004 Black householdersover $200,000 Asian householdersover $200,000 Some other race householders$179,722 Two or more races householders$155,487 Hispanic or Latino race householdersMedian 2022 house value $751,566 White Non-Hispanic householders$692,815 American Indian or Alaska Native householders over $1,000,000 Asian householders$471,114 Some other race householders$484,970 Two or more races householders$464,463 Hispanic or Latino householders
Median age by race in Prosper
38.2 Median age for White residents36.4 39.1 34.3 Median age for Black or African American residents34.4 33.5 30.1 Median age for American Indian / Alaska Native residents-724,137,930.3 60.9 36.8 Median age for Asian residents37.2 37.3 -819,226,749.4 Median age for Native Hawaiian / Pacific Islander residents-770,894,787.8 -577,777,777.2 40.5 Median age for Other race residents50.2 38.0 30.1 Median age for Two or more races residents23.4 35.0 38.0 Median age for White alone residents36.5 38.7 37.4 Median age for Hispanic or Latino residents33.9 37.7
Owner/renter occupied households by race in Prosper
House owners and renters - White residents 6,333 90.5% Owner occupied662 9.5% Renter occupiedHouse owners and renters - Black or African American residents 608 77.3% Owner occupied178 22.7% Renter occupiedHouse owners and renters - American Indian / Alaska Native residents 11 100.0% Owner occupiedHouse owners and renters - Asian residents 821 93.6% Owner occupied56 6.4% Renter occupiedHouse owners and renters - Native Hawaiian / Pacific Islander residents 31 100.0% Owner occupiedHouse owners and renters - Other race residents 89 100.0% Owner occupiedHouse owners and renters - Two or more races residents 766 80.2% Owner occupied189 19.8% Renter occupiedHouse owners and renters - White alone residents 6,134 90.9% Owner occupied618 9.1% Renter occupiedHouse owners and renters - Hispanic or Latino residents 733 84.2% Owner occupied137 15.8% Renter occupied
Language usage in Prosper
English speakers - Total 83.6% of residents of Prosper speak English at home.
5.4% of residents speak Spanish at home 1,366 80.7% Speak English very well327 19.3% Speak English less than very well10.9% of residents speak other language at home 2,507 73.2% Speak English very well918 26.8% Speak English less than very well
English speakers - Born in the United States 95.7% of residents of Prosper speak English at home.
1.9% of residents speak Spanish at home 247 84.6% Speak English very well45 15.4% Speak English less than very well2.2% of residents speak other language at home 292 88.8% Speak English very well37 11.2% Speak English less than very well
English speakers - Native, born elsewhere 69.2% of residents of Prosper speak English at home.
29.2% of residents speak Spanish at home 74 100.0% Speak English very well5.1% of residents speak other language at home 13 100.0% Speak English very well
English speakers - Foreign-born 27.4% of residents of Prosper speak English at home.
13.7% of residents speak Spanish at home 453 72.6% Speak English very well171 27.4% Speak English less than very well60.5% of residents speak other language at home 1,924 70.0% Speak English very well824 30.0% Speak English less than very well
White (Caucasian) - Speak only English Native:
97.8% (19,673)Foreign-born:
41.5% (461)
White (Caucasian) - Speak another language Native:
2.9% (581)Foreign-born:
61.4% (683)
Black or African American - Speak only English Native:
95.9% (2,299)Foreign-born:
37.4% (114)
Black or African American - Speak another language Native:
3.8% (90)Foreign-born:
62.0% (189)
Asian - Speak only English Native:
62.0% (602)Foreign-born:
26.8% (631)
Asian - Speak another language Native:
37.2% (361)Foreign-born:
75.2% (1,771)
Other race - Speak another language Native:
30.1% (81)Foreign-born:
100.0% (224)
Two or more races - Speak only English Native:
72.2% (1,796)Foreign-born:
8.2% (35)
Two or more races - Speak another language Native:
27.7% (690)Foreign-born:
91.8% (394)
White alone - Speak only English Native:
97.8% (18,968)Foreign-born:
35.8% (375)
White alone - Speak another language Native:
2.2% (428)Foreign-born:
63.3% (664)
Hispanic or Latino - Speak only English Native:
71.4% (1,884)Foreign-born:
15.2% (98)
Hispanic or Latino - Speak another language Native:
32.0% (843)Foreign-born:
86.7% (560)
Foreign-born residents in Prosper 4,314 residents are foreign born (6.7% Asia , 2.2% Latin America , 1.6% Europe , 1.5% Africa ).
This city:
12.8%Texas:
17.1%
Marital status for residents in Prosper Marital status - White (Caucasian) population 15 years and over
Males 22.5% Never married71.4% Now married0.4% Separated0.8% Widowed4.9% DivorcedFemales 18.1% Never married71.0% Now married0.0% Separated2.9% Widowed8.0% DivorcedWomen who gave birth in the past 12 months Now married:
96.2% (323)Unmarried:
3.8% (13)
Women who did not give birth in the past 12 months Now married:
66.7% (3,370)Unmarried:
33.3% (1,685)
Marital status - Black or African American population 15 years and over
Males 33.8% Never married64.6% Now married0.0% Separated0.0% Widowed1.6% DivorcedFemales 36.9% Never married51.4% Now married0.0% Separated3.7% Widowed8.0% DivorcedWomen who gave birth in the past 12 months Now married:
100.0% (13)Unmarried:
0.0% (0)
Women who did not give birth in the past 12 months Now married:
45.6% (412)Unmarried:
54.4% (493)
Marital status - American Indian / Alaska Native population 15 years and over
Males 100.0% Never married0.0% Now married0.0% Separated0.0% Widowed0.0% DivorcedFemales 22.5% Never married72.5% Now married5.0% Separated0.0% Widowed0.0% DivorcedWomen who did not give birth in the past 12 months Now married:
18.2% (3)Unmarried:
81.8% (13)
Marital status - Asian population 15 years and over
Males 27.8% Never married65.3% Now married0.0% Separated0.7% Widowed6.2% DivorcedFemales 24.8% Never married67.9% Now married0.0% Separated1.1% Widowed6.1% DivorcedWomen who gave birth in the past 12 months Now married:
100.0% (71)Unmarried:
0.0% (0)
Women who did not give birth in the past 12 months Now married:
60.8% (554)Unmarried:
39.2% (358)
Marital status - Native Hawaiian / Pacific Islander population 15 years and over
Males 100.0% Never married0.0% Now married0.0% Separated0.0% Widowed0.0% DivorcedFemales 0.0% Never married0.0% Now married0.0% Separated0.0% Widowed100.0% DivorcedWomen who did not give birth in the past 12 months Now married:
0.0% (0)Unmarried:
100.0% (8)
Marital status - Other race population 15 years and over
Males 0.0% Never married57.7% Now married0.0% Separated35.2% Widowed7.0% DivorcedFemales 5.9% Never married94.1% Now married0.0% Separated0.0% Widowed0.0% DivorcedWomen who did not give birth in the past 12 months Now married:
93.6% (150)Unmarried:
6.4% (10)
Marital status - Two or more races population 15 years and over
Males 40.8% Never married55.3% Now married0.0% Separated0.0% Widowed3.9% DivorcedFemales 24.8% Never married50.6% Now married0.0% Separated15.7% Widowed8.8% DivorcedWomen who gave birth in the past 12 months Now married:
100.0% (12)Unmarried:
0.0% (0)
Women who did not give birth in the past 12 months Now married:
57.4% (419)Unmarried:
42.6% (310)
Marital status - White alone, not Hispanic / Latino population 15 years and over
Males 21.3% Never married73.3% Now married0.4% Separated0.9% Widowed4.1% DivorcedFemales 18.2% Never married71.0% Now married0.0% Separated2.9% Widowed7.9% DivorcedWomen who gave birth in the past 12 months Now married:
100.0% (330)Unmarried:
0.0% (0)
Women who did not give birth in the past 12 months Now married:
66.2% (3,301)Unmarried:
33.8% (1,683)
Marital status - Hispanic or Latino population 15 years and over
Males 37.7% Never married49.5% Now married0.0% Separated3.9% Widowed8.9% DivorcedFemales 19.4% Never married57.0% Now married0.0% Separated13.6% Widowed10.0% DivorcedWomen who gave birth in the past 12 months Now married:
27.8% (5)Unmarried:
72.2% (14)
Women who did not give birth in the past 12 months Now married:
67.7% (535)Unmarried:
32.3% (255)
Ancestries in Prosper
3,421 19.4% American2,072 11.8% English1,337 7.6% German553 3.1% Irish512 2.9% Nigerian475 2.7% Italian364 2.1% Slovene331 1.9% European215 1.2% Russian182 1.0% Welsh154 0.9% Scotch-Irish148 0.8% Egyptian138 0.8% Polish138 0.8% Norwegian138 0.8% African125 0.7% Scottish107 0.6% Canadian89 0.5% Iranian64 0.4% South African46 0.3% Swedish45 0.3% Belgian40 0.2% Scandinavian38 0.2% Czech37 0.2% Kenyan35 0.2% Dutch34 0.2% Ugandan32 0.2% British31 0.2% Eastern European29 0.2% French25 0.1% Northern European19 0.1% Turkish17 0.10% Lithuanian17 0.10% Ukrainian16 0.09% Romanian12 0.07% Greek10 0.06% Czechoslovakian6 0.03% Yugoslavian5 0.03% Slovak4 0.02% French Canadian1 0.01% Hungarian
Geographical mobility in Prosper Same house 1 year ago 19,452 87.2% White (Caucasian)2,384 84.9% Black or African American68 66.9% American Indian / Alaska Native2,949 83.8% Asian34 98.2% Native Hawaiian / Pacific Islander485 91.7% Other race2,860 89.5% Two or more races19,008 87.9% White alone, not Hispanic / Latino2,740 80.7% Hispanic or LatinoMoved within same county 1,235 5.5% White / Caucasian75 2.7% Black or African American105 3.0% Asian13 2.5% Other race6 0.2% Two or more races1,156 5.3% White alone, not Hispanic / Latino174 5.1% Hispanic or LatinoMoved within same state 687 3.1% White / Caucasian84 3.0% Black or African American31 30.4% American Indian / Alaska Native122 3.5% Asian155 4.9% Two or more races623 2.9% White alone, not Hispanic / Latino171 5.0% Hispanic or LatinoMoved from different state 825 3.7% White / Caucasian403 14.4% Black or African American284 8.1% Asian11 2.1% Other race151 4.7% Two or more races756 3.5% White alone, not Hispanic / Latino279 8.2% Hispanic or LatinoMoved from abroad 35 0.2% White59 1.7% Asian15 2.9% Other race64 2.0% Two or more races45 0.2% White alone, not Hispanic / Latino65 1.9% Hispanic or Latino
Children Nativity (place of birth) in Prosper
Children under 6 years - Living with two parents Both parents native 2,231 100.0% NativeBoth parents foreign-born 408 98.6% Native6 1.4% Foreign-bornOne native, one foreign-born parent 211 94.9% Native11 5.1% Foreign-bornChildren under 6 years - Living with one parent Native parent 138 100.0% NativeForeign-born parent 21 46.4% Native24 53.6% Foreign-bornChildren 6 to 17 years - Living with two parents Both parents native 5,429 98.9% Native58 1.1% Foreign-bornBoth parents foreign-born 507 79.9% Native128 20.1% Foreign-bornOne native, one foreign-born parent 549 96.1% Native23 3.9% Foreign-bornChildren 6 to 17 years - Living with one parent Native parent 728 100.0% NativeForeign-born parent 59 47.2% Native66 52.8% Foreign-born
Grandparents responsible for own grandchildren in Prosper
Grandparents (30 to 59 years) White / Caucasian 8 42.2% Responsible for grandchildren11 57.8% Not responsible for grandchildrenBlack or African American 55 100.0% Not responsible for grandchildrenAsian 19 28.7% Responsible for grandchildren48 71.3% Not responsible for grandchildrenOther race 26 100.0% Responsible for grandchildrenWhite alone, not Hispanic / Latino 8 42.2% Responsible for grandchildren11 57.8% Not responsible for grandchildrenHispanic or Latino 16 100.0% Responsible for grandchildren
Grandparents (60 years and over) White / Caucasian 135 100.0% Not responsible for grandchildrenBlack or African American 79 100.0% Not responsible for grandchildrenAsian 77 100.0% Not responsible for grandchildrenOther race 12 100.0% Not responsible for grandchildrenWhite alone, not Hispanic / Latino 123 100.0% Not responsible for grandchildrenHispanic or Latino 64 100.0% Not responsible for grandchildren