Races in Pittston, Pennsylvania (PA) Detailed Stats
Data:
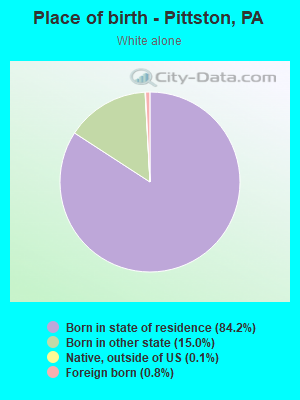
Races - White alone (%)
Races - White alone (% change since 2000)
Races - Black alone (%)
Races - Black alone (% change since 2000)
Races - American Indian alone (%)
Races - American Indian alone (% change since 2000)
Races - Asian alone (%)
Races - Asian alone (% change since 2000)
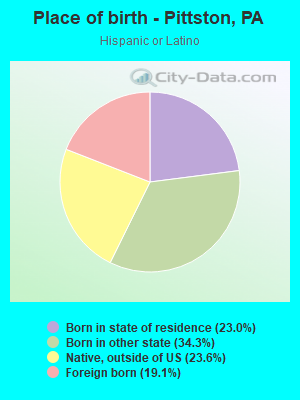
Races - Hispanic (%)
Races - Hispanic (% change since 2000)
Races - Native Hawaiian and Other Pacific Islander alone (%)
Races - Native Hawaiian and Other Pacific Islander alone (% change since 2000)
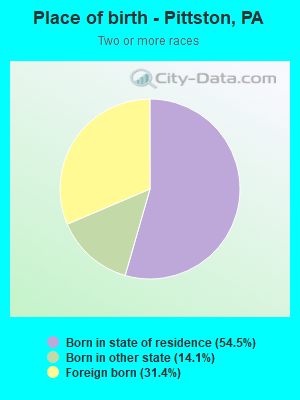
Races - Two or more races(%)
Races - Two or more races(% change since 2000)
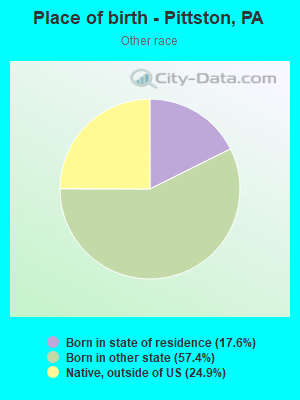
Races - Other race alone (%)
Races - Other race alone (% change since 2000)
Racial diversity
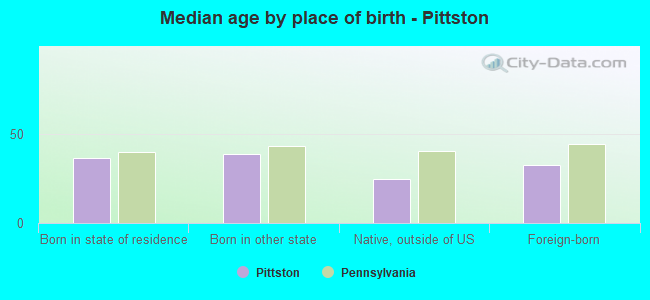
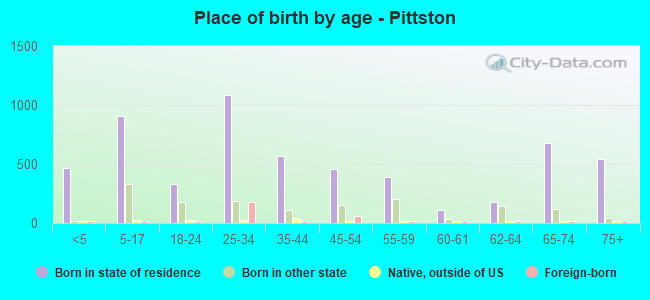
Place of birth - Born in state of residence (%)
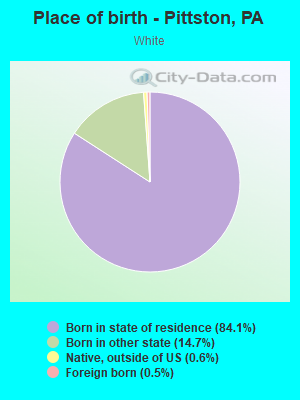
Place of birth - Born in state of residence (%) - White
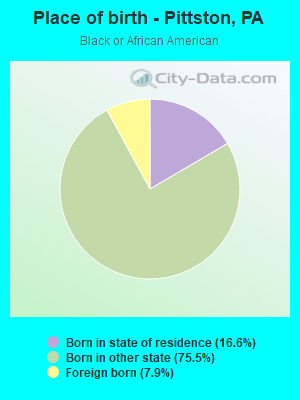
Place of birth - Born in state of residence (%) - Black or African American
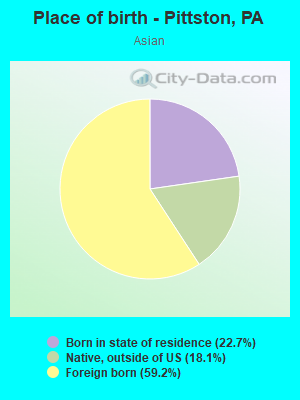
Place of birth - Born in state of residence (%) - Asian
Place of birth - Born in state of residence (%) - Hispanic or Latino
Place of birth - Born in state of residence (%) - American Indian and Alaska Native
Place of birth - Born in state of residence (%) - Multirace
Place of birth - Born in state of residence (%) - Other Race
Place of birth - Born in other state (%)
Place of birth - Born in other state (%) - White
Place of birth - Born in other state (%) - Black or African American
Place of birth - Born in other state (%) - Asian
Place of birth - Born in other state (%) - Hispanic or Latino
Place of birth - Born in other state (%) - American Indian and Alaska Native
Place of birth - Born in other state (%) - Multirace
Place of birth - Born in other state (%) - Other Race
Place of birth - Native, outside of US (%)
Place of birth - Native, outside of US (%) - White
Place of birth - Native, outside of US (%) - Black or African American
Place of birth - Native, outside of US (%) - Asian
Place of birth - Native, outside of US (%) - Hispanic or Latino
Place of birth - Native, outside of US (%) - American Indian and Alaska Native
Place of birth - Native, outside of US (%) - Multirace
Place of birth - Native, outside of US (%) - Other Race
Place of birth - Foreign born (%)
Place of birth - Foreign born (%) - White
Place of birth - Foreign born (%) - Black or African American
Place of birth - Foreign born (%) - Asian
Place of birth - Foreign born (%) - Hispanic or Latino
Place of birth - Foreign born (%) - American Indian and Alaska Native
Place of birth - Foreign born (%) - Multirace
Place of birth - Foreign born (%) - Other Race
Residents speaking English at home (%)
Residents speaking English at home - Born in the United States (%)
Residents speaking English at home - Native, born elsewhere (%)
Residents speaking English at home - Foreign born (%)
Residents speaking Spanish at home (%)
Residents speaking Spanish at home - Born in the United States (%)
Residents speaking Spanish at home - Native, born elsewhere (%)
Residents speaking Spanish at home - Foreign born (%)
Residents speaking other language at home (%)
Residents speaking other language at home - Born in the United States (%)
Residents speaking other language at home - Native, born elsewhere (%)
Residents speaking other language at home - Foreign born (%)
Marital status - Never married (%)
Marital status - Now married (%)
Marital status - Separated (%)
Marital status - Widowed (%)
Marital status - Divorced (%)
Ancestries Reported - Arab (%)
Ancestries Reported - Czech (%)
Ancestries Reported - Danish (%)
Ancestries Reported - Dutch (%)
Ancestries Reported - English (%)
Ancestries Reported - French (%)
Ancestries Reported - French Canadian (%)
Ancestries Reported - German (%)
Ancestries Reported - Greek (%)
Ancestries Reported - Hungarian (%)
Ancestries Reported - Irish (%)
Ancestries Reported - Italian (%)
Ancestries Reported - Lithuanian (%)
Ancestries Reported - Norwegian (%)
Ancestries Reported - Polish (%)
Ancestries Reported - Portuguese (%)
Ancestries Reported - Russian (%)
Ancestries Reported - Scotch-Irish (%)
Ancestries Reported - Scottish (%)
Ancestries Reported - Slovak (%)
Ancestries Reported - Subsaharan African (%)
Ancestries Reported - Swedish (%)
Ancestries Reported - Swiss (%)
Ancestries Reported - Ukrainian (%)
Ancestries Reported - United States (%)
Ancestries Reported - Welsh (%)
Ancestries Reported - West Indian (%)
Ancestries Reported - Other (%)
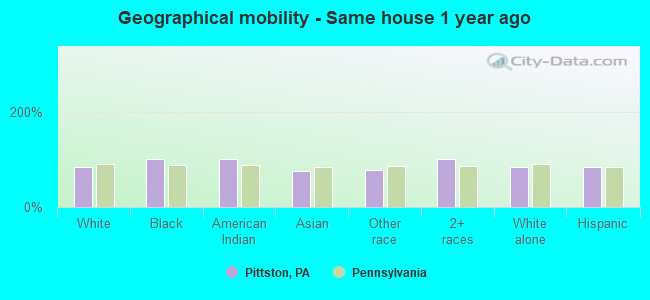
Geographical mobility - Same house 1 year ago (%)
Geographical mobility - Same house 1 year ago (%) - White
Geographical mobility - Same house 1 year ago (%) - Black or African American
Geographical mobility - Same house 1 year ago (%) - Asian
Geographical mobility - Same house 1 year ago (%) - Hispanic or Latino
Geographical mobility - Same house 1 year ago (%) - American Indian and Alaska Native
Geographical mobility - Same house 1 year ago (%) - Multirace
Geographical mobility - Same house 1 year ago (%) - Other Race
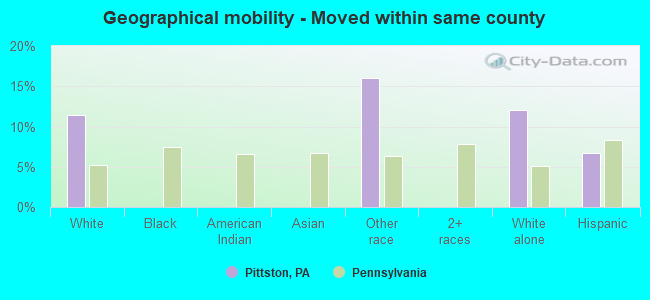
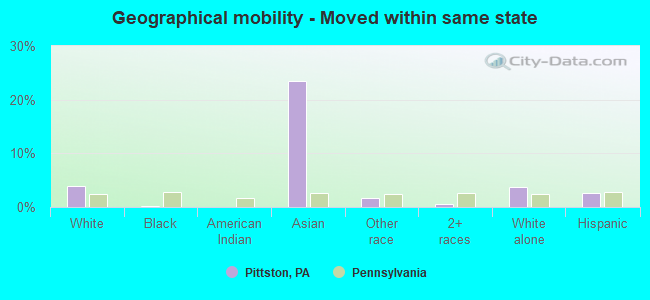
Geographical mobility - Moved within same county (%)
Geographical mobility - Moved within same county (%) - White
Geographical mobility - Moved within same county (%) - Black or African American
Geographical mobility - Moved within same county (%) - Asian
Geographical mobility - Moved within same county (%) - Hispanic or Latino
Geographical mobility - Moved within same county (%) - American Indian and Alaska Native
Geographical mobility - Moved within same county (%) - Multirace
Geographical mobility - Moved within same county (%) - Other Race
Geographical mobility - Moved from different county within same state (%)
Geographical mobility - Moved from different county within same state (%) - White
Geographical mobility - Moved from different county within same state (%) - Black or African American
Geographical mobility - Moved from different county within same state (%) - Asian
Geographical mobility - Moved from different county within same state (%) - Hispanic or Latino
Geographical mobility - Moved from different county within same state (%) - American Indian and Alaska Native
Geographical mobility - Moved from different county within same state (%) - Multirace
Geographical mobility - Moved from different county within same state (%) - Other Race
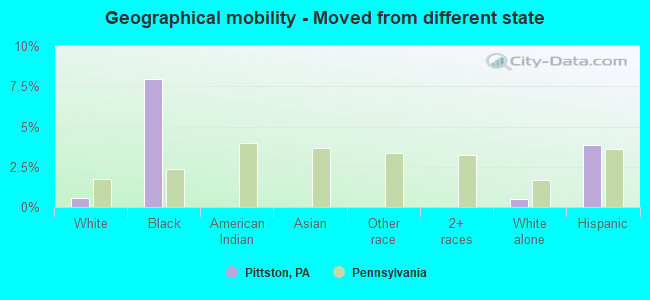
Geographical mobility - Moved from different state (%)
Geographical mobility - Moved from different state (%) - White
Geographical mobility - Moved from different state (%) - Black or African American
Geographical mobility - Moved from different state (%) - Asian
Geographical mobility - Moved from different state (%) - Hispanic or Latino
Geographical mobility - Moved from different state (%) - American Indian and Alaska Native
Geographical mobility - Moved from different state (%) - Multirace
Geographical mobility - Moved from different state (%) - Other Race
Geographical mobility - Moved from abroad (%)
Geographical mobility - Moved from abroad (%) - White
Geographical mobility - Moved from abroad (%) - Black or African American
Geographical mobility - Moved from abroad (%) - Asian
Geographical mobility - Moved from abroad (%) - Hispanic or Latino
Geographical mobility - Moved from abroad (%) - American Indian and Alaska Native
Geographical mobility - Moved from abroad (%) - Multirace
Geographical mobility - Moved from abroad (%) - Other Race
Place of birth for the foreign-born population - Ireland (%)
Place of birth for the foreign-born population - Denmark (%)
Place of birth for the foreign-born population - Norway (%)
Place of birth for the foreign-born population - Sweden (%)
Place of birth for the foreign-born population - United Kingdom (%)
Place of birth for the foreign-born population - England (%)
Place of birth for the foreign-born population - Scotland (%)
Place of birth for the foreign-born population - Other Northern Europe (%)
Place of birth for the foreign-born population - Austria (%)
Place of birth for the foreign-born population - Belgium (%)
Place of birth for the foreign-born population - France (%)
Place of birth for the foreign-born population - Germany (%)
Place of birth for the foreign-born population - Netherlands (%)
Place of birth for the foreign-born population - Switzerland (%)
Place of birth for the foreign-born population - Other Western Europe (%)
Place of birth for the foreign-born population - Greece (%)
Place of birth for the foreign-born population - Italy (%)
Place of birth for the foreign-born population - Portugal (%)
Place of birth for the foreign-born population - Spain (%)
Place of birth for the foreign-born population - Other Southern Europe (%)
Place of birth for the foreign-born population - Albania (%)
Place of birth for the foreign-born population - Belarus (%)
Place of birth for the foreign-born population - Bosnia and Herzegovina (%)
Place of birth for the foreign-born population - Bulgaria (%)
Place of birth for the foreign-born population - Croatia (%)
Place of birth for the foreign-born population - Czechoslovakia (%)
Place of birth for the foreign-born population - Hungary (%)
Place of birth for the foreign-born population - Latvia (%)
Place of birth for the foreign-born population - Lithuania (%)
Place of birth for the foreign-born population - North Macedonia (Macedonia) (%)
Place of birth for the foreign-born population - Moldova (%)
Place of birth for the foreign-born population - Poland (%)
Place of birth for the foreign-born population - Romania (%)
Place of birth for the foreign-born population - Russia (%)
Place of birth for the foreign-born population - Serbia (%)
Place of birth for the foreign-born population - Ukraine (%)
Place of birth for the foreign-born population - Other Eastern Europe (%)
Place of birth for the foreign-born population - China (%)
Place of birth for the foreign-born population - Hong Kong (%)
Place of birth for the foreign-born population - Taiwan (%)
Place of birth for the foreign-born population - Japan (%)
Place of birth for the foreign-born population - Korea (%)
Place of birth for the foreign-born population - Other Eastern Asia (%)
Place of birth for the foreign-born population - Afghanistan (%)
Place of birth for the foreign-born population - Bangladesh (%)
Place of birth for the foreign-born population - India (%)
Place of birth for the foreign-born population - Iran (%)
Place of birth for the foreign-born population - Kazakhstan (%)
Place of birth for the foreign-born population - Nepal (%)
Place of birth for the foreign-born population - Pakistan (%)
Place of birth for the foreign-born population - Sri Lanka (%)
Place of birth for the foreign-born population - Uzbekistan (%)
Place of birth for the foreign-born population - Other South Central Asia (%)
Place of birth for the foreign-born population - Burma (%)
Place of birth for the foreign-born population - Cambodia (%)
Place of birth for the foreign-born population - Indonesia (%)
Place of birth for the foreign-born population - Laos (%)
Place of birth for the foreign-born population - Malaysia (%)
Place of birth for the foreign-born population - Philippines (%)
Place of birth for the foreign-born population - Singapore (%)
Place of birth for the foreign-born population - Thailand (%)
Place of birth for the foreign-born population - Vietnam (%)
Place of birth for the foreign-born population - Other South Eastern Asia (%)
Place of birth for the foreign-born population - Armenia (%)
Place of birth for the foreign-born population - Iraq (%)
Place of birth for the foreign-born population - Israel (%)
Place of birth for the foreign-born population - Jordan (%)
Place of birth for the foreign-born population - Kuwait (%)
Place of birth for the foreign-born population - Lebanon (%)
Place of birth for the foreign-born population - Saudi Arabia (%)
Place of birth for the foreign-born population - Syria (%)
Place of birth for the foreign-born population - Turkey (%)
Place of birth for the foreign-born population - Yemen (%)
Place of birth for the foreign-born population - Other Western Asia (%)
Place of birth for the foreign-born population - Eritrea (%)
Place of birth for the foreign-born population - Ethiopia (%)
Place of birth for the foreign-born population - Kenya (%)
Place of birth for the foreign-born population - Somalia (%)
Place of birth for the foreign-born population - Uganda (%)
Place of birth for the foreign-born population - Zimbabwe (%)
Place of birth for the foreign-born population - Other Eastern Africa (%)
Place of birth for the foreign-born population - Cameroon (%)
Place of birth for the foreign-born population - Congo (%)
Place of birth for the foreign-born population - Democratic Republic of Congo (Zaire) (%)
Place of birth for the foreign-born population - Other Middle Africa (%)
Place of birth for the foreign-born population - Egypt (%)
Place of birth for the foreign-born population - Morocco (%)
Place of birth for the foreign-born population - Sudan (%)
Place of birth for the foreign-born population - Other Northern Africa (%)
Place of birth for the foreign-born population - South Africa (%)
Place of birth for the foreign-born population - Other Southern Africa (%)
Place of birth for the foreign-born population - Cabo Verde (%)
Place of birth for the foreign-born population - Ghana (%)
Place of birth for the foreign-born population - Liberia (%)
Place of birth for the foreign-born population - Nigeria (%)
Place of birth for the foreign-born population - Senegal (%)
Place of birth for the foreign-born population - Sierra Leone (%)
Place of birth for the foreign-born population - Other Western Africa (%)
Place of birth for the foreign-born population - Australia (%)
Place of birth for the foreign-born population - New Zealand (%)
Place of birth for the foreign-born population - Fiji (%)
Place of birth for the foreign-born population - Micronesia (%)
Place of birth for the foreign-born population - Bahamas (%)
Place of birth for the foreign-born population - Barbados (%)
Place of birth for the foreign-born population - Cuba (%)
Place of birth for the foreign-born population - Dominica (%)
Place of birth for the foreign-born population - Dominican Republic (%)
Place of birth for the foreign-born population - Grenada (%)
Place of birth for the foreign-born population - Haiti (%)
Place of birth for the foreign-born population - Jamaica (%)
Place of birth for the foreign-born population - St. Vincent and the Grenadines (%)
Place of birth for the foreign-born population - Trinidad and Tobago (%)
Place of birth for the foreign-born population - West Indies (%)
Place of birth for the foreign-born population - Other Caribbean (%)
Place of birth for the foreign-born population - Belize (%)
Place of birth for the foreign-born population - Costa Rica (%)
Place of birth for the foreign-born population - El Salvador (%)
Place of birth for the foreign-born population - Guatemala (%)
Place of birth for the foreign-born population - Honduras (%)
Place of birth for the foreign-born population - Mexico (%)
Place of birth for the foreign-born population - Nicaragua (%)
Place of birth for the foreign-born population - Panama (%)
Place of birth for the foreign-born population - Other Central America (%)
Place of birth for the foreign-born population - Argentina (%)
Place of birth for the foreign-born population - Bolivia (%)
Place of birth for the foreign-born population - Brazil (%)
Place of birth for the foreign-born population - Chile (%)
Place of birth for the foreign-born population - Colombia (%)
Place of birth for the foreign-born population - Ecuador (%)
Place of birth for the foreign-born population - Guyana (%)
Place of birth for the foreign-born population - Peru (%)
Place of birth for the foreign-born population - Uruguay (%)
Place of birth for the foreign-born population - Venezuela (%)
Place of birth for the foreign-born population - Other South America (%)
Place of birth for the foreign-born population - Canada (%)
Place of birth for the foreign-born population - Other Northern America (%)
Place of birth for the foreign-born population - Other (%)
Latest news about races in Pittston, PA collected exclusively by city-data.com from local newspapers, TV, and radio stations
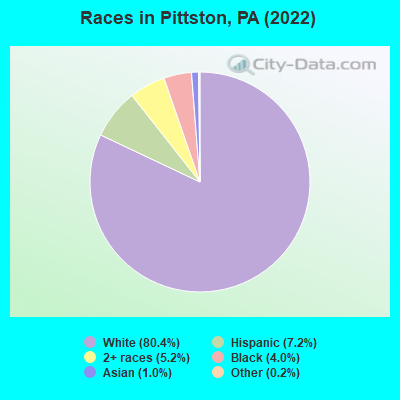
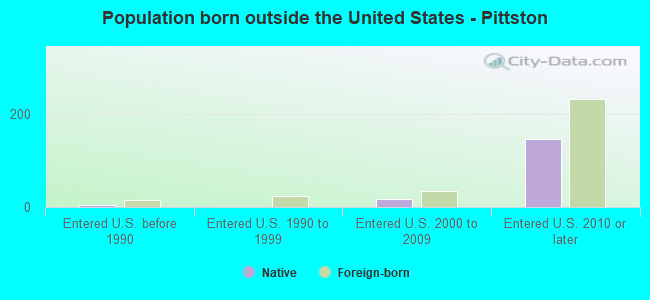
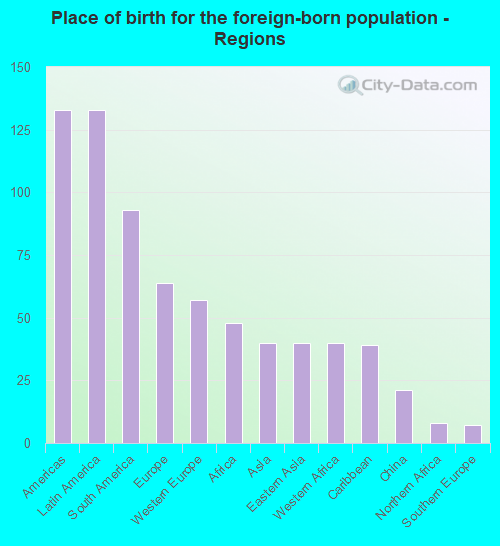
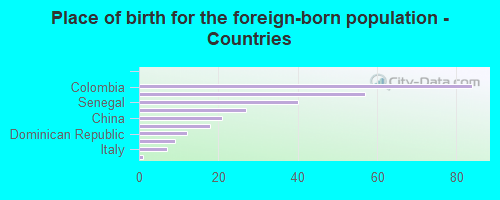
According to 2022 data, the most numerous races in Pittston, PA are White alone (6,126 residents), Black alone (306 residents), and Hispanic (551 residents). 89.3% of Pittston residents speak English at home. 3.8% of Pittston, PA residents are foreign-born (1.7% born in Latin America, 0.8% born in Europe, 0.6% born in Africa, 0.5% born in Asia), which is 86.0% less than the foreign-born rate of 7.0% across the entire state of Pennsylvania.
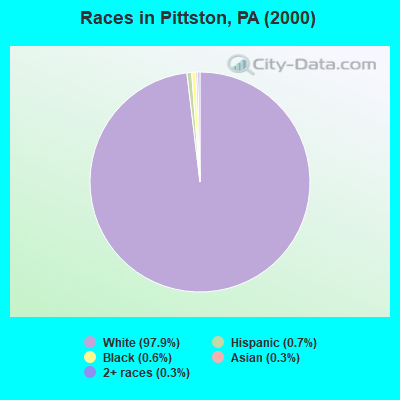
Race distribution in Pittston
2000 2022
10,322,455 84.1% White alone 1,202,437 9.8% Black alone 394,088 3.2% Hispanic 218,296 1.8% Asian alone 113,097 0.9% Two or more races 13,086 0.1% Other race alone 14,904 0.1% American Indian alone 2,691 0.02% Native Hawaiian and Other
9,487,228 73.1% White alone 1,311,581 10.1% Black alone 1,115,997 8.6% Hispanic 493,942 3.8% Two or more races 487,124 3.8% Asian alone 63,582 0.5% Other race alone 10,130 0.08% American Indian alone 2,424 0.02% Native Hawaiian and Other
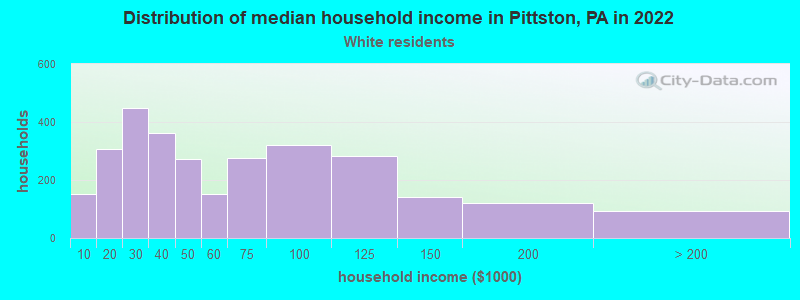
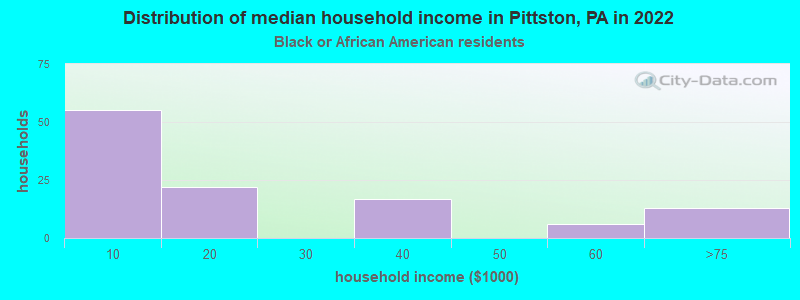
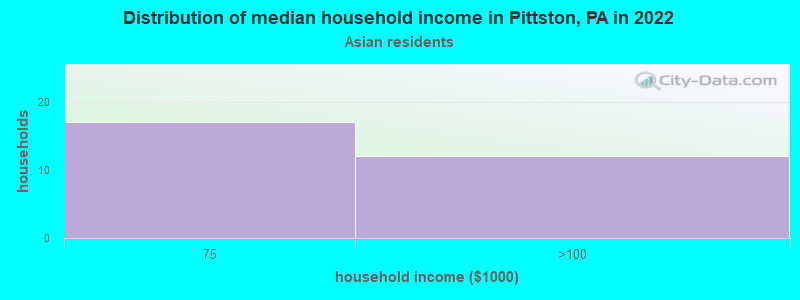
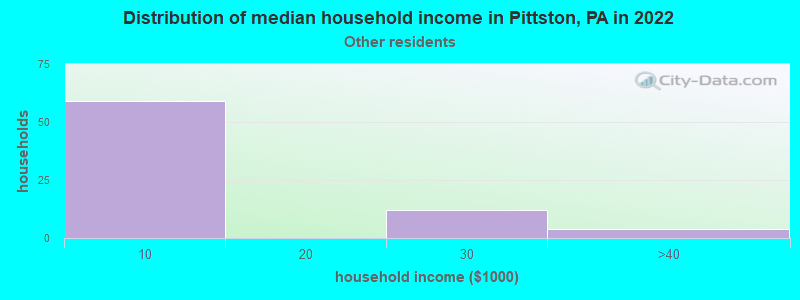
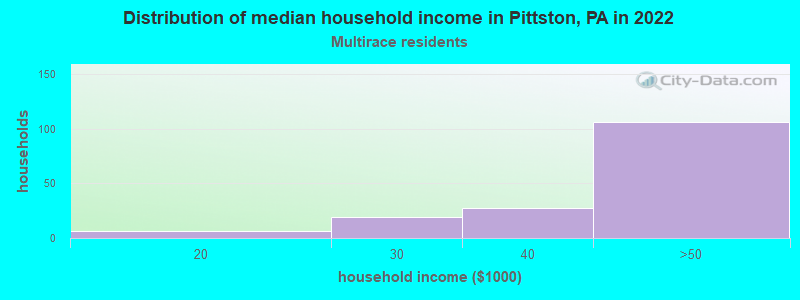
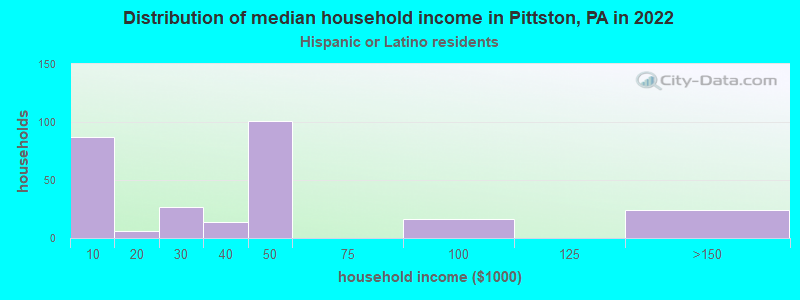
Income and house value in Pittston Median household income in 2022 $45,911 White non-Hispanic householders$63,159 Asian householders$2,527 Some other race householders$36,371 Two or more races householders$37,389 Hispanic or Latino race householdersMedian 2022 house value $118,853 White Non-Hispanic householders
Median age by race in Pittston
40.8 Median age for White residents40.7 41.0 17.5 Median age for Black or African American residents18.0 14.6 -1,365,781,709.5 Median age for American Indian / Alaska Native residents-884,488,448.0 -1,340,606,059.3 36.9 Median age for Asian residents34.4 45.9 -750,524,108.3 Median age for Native Hawaiian / Pacific Islander residents-424,242,423.8 -747,474,746.7 19.4 Median age for Other race residents19.4 18.3 20.7 Median age for Two or more races residents9.0 30.9 40.7 Median age for White alone residents41.1 40.9 20.0 Median age for Hispanic or Latino residents19.4 30.4
Owner/renter occupied households by race in Pittston
House owners and renters - White residents 1,555 52.6% Owner occupied1,399 47.4% Renter occupiedHouse owners and renters - Black or African American residents 17 19.2% Owner occupied71 80.8% Renter occupiedHouse owners and renters - Asian residents 6 18.6% Owner occupied27 81.4% Renter occupiedHouse owners and renters - Other race residents 76 100.0% Renter occupiedHouse owners and renters - Two or more races residents 30 13.9% Owner occupied185 86.1% Renter occupiedHouse owners and renters - White alone residents 1,549 52.1% Owner occupied1,424 47.9% Renter occupiedHouse owners and renters - Hispanic or Latino residents 34 14.4% Owner occupied202 85.6% Renter occupied
Language usage in Pittston
English speakers - Total 89.3% of residents of Pittston speak English at home.
5.4% of residents speak Spanish at home 312 81.2% Speak English very well72 18.8% Speak English less than very well3.5% of residents speak other language at home 157 61.8% Speak English very well97 38.2% Speak English less than very well
English speakers - Born in the United States 92.5% of residents of Pittston speak English at home.
6.5% of residents speak Spanish at home 93 94.9% Speak English very well5 5.1% Speak English less than very well
English speakers - Native, born elsewhere 11.3% of residents of Pittston speak English at home.
73.4% of residents speak Spanish at home 74 81.3% Speak English very well17 18.7% Speak English less than very well5.6% of residents speak other language at home 7 100.0% Speak English less than very well
English speakers - Foreign-born 7.2% of residents of Pittston speak English at home.
41.2% of residents speak Spanish at home 106 88.3% Speak English very well14 11.7% Speak English less than very well41.6% of residents speak other language at home 45 37.2% Speak English very well76 62.8% Speak English less than very well
White (Caucasian) - Speak only English Native:
97.0% (5,586)Foreign-born:
54.5% (17)
White (Caucasian) - Speak another language Native:
2.4% (137)Foreign-born:
100.0% (32)
Asian - Speak only English Native:
76.5% (12)Foreign-born:
8.3% (5)
Asian - Speak another language Native:
27.0% (4)Foreign-born:
93.7% (51)
Two or more races - Speak another language Native:
37.0% (126)Foreign-born:
100.0% (179)
White alone - Speak only English Native:
97.3% (5,582)Foreign-born:
35.3% (17)
White alone - Speak another language Native:
2.4% (136)Foreign-born:
46.9% (23)
Hispanic or Latino - Speak another language Native:
39.0% (158)Foreign-born:
99.8% (108)
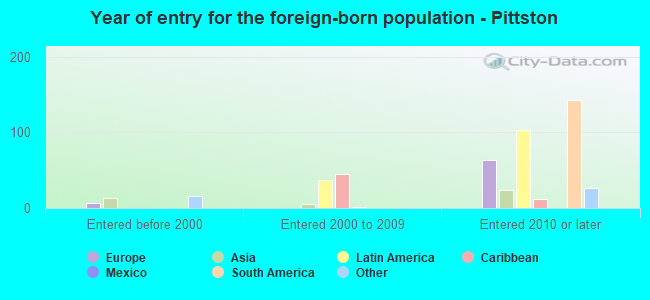
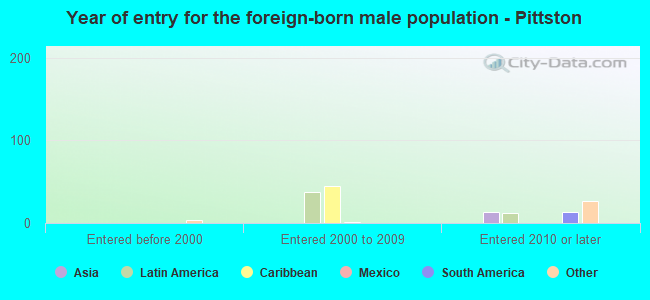
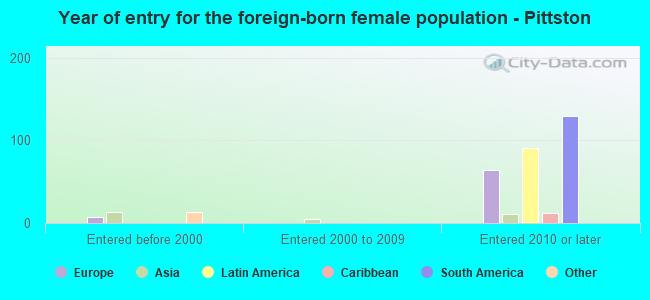
Foreign-born residents in Pittston 287 residents are foreign born (1.7% Latin America , 0.8% Europe , 0.6% Africa , 0.5% Asia ).
This city:
3.8%Pennsylvania:
7.3%
Marital status for residents in Pittston Marital status - White (Caucasian) population 15 years and over
Males 46.9% Never married33.3% Now married2.6% Separated3.3% Widowed14.0% DivorcedFemales 36.3% Never married28.5% Now married2.9% Separated9.0% Widowed23.2% DivorcedWomen who gave birth in the past 12 months Now married:
100.0% (48)Unmarried:
0.0% (0)
Women who did not give birth in the past 12 months Now married:
22.1% (269)Unmarried:
77.9% (949)
Marital status - Black or African American population 15 years and over
Males 81.3% Never married18.7% Now married0.0% Separated0.0% Widowed0.0% DivorcedFemales 53.4% Never married21.6% Now married5.2% Separated0.0% Widowed19.8% DivorcedWomen who did not give birth in the past 12 months Now married:
26.7% (28)Unmarried:
73.3% (76)
Marital status - Asian population 15 years and over
Males 14.3% Never married85.7% Now married0.0% Separated0.0% Widowed0.0% DivorcedFemales 20.0% Never married60.0% Now married0.0% Separated0.0% Widowed20.0% DivorcedWomen who gave birth in the past 12 months Now married:
100.0% (5)Unmarried:
0.0% (0)
Women who did not give birth in the past 12 months Now married:
50.0% (6)Unmarried:
50.0% (6)
Marital status - Other race population 15 years and over
Males 43.8% Never married27.1% Now married0.0% Separated0.0% Widowed29.2% DivorcedFemales 100.0% Never married0.0% Now married0.0% Separated0.0% Widowed0.0% DivorcedWomen who did not give birth in the past 12 months Now married:
0.0% (0)Unmarried:
100.0% (115)
Marital status - Two or more races population 15 years and over
Males 80.0% Never married20.0% Now married0.0% Separated0.0% Widowed0.0% DivorcedFemales 77.5% Never married0.0% Now married9.3% Separated3.3% Widowed9.9% DivorcedWomen who did not give birth in the past 12 months Now married:
10.8% (24)Unmarried:
89.2% (201)
Marital status - White alone, not Hispanic / Latino population 15 years and over
Males 46.3% Never married33.6% Now married2.6% Separated3.4% Widowed14.2% DivorcedFemales 36.2% Never married28.3% Now married3.0% Separated9.1% Widowed23.5% DivorcedWomen who gave birth in the past 12 months Now married:
100.0% (50)Unmarried:
0.0% (0)
Women who did not give birth in the past 12 months Now married:
21.2% (261)Unmarried:
78.8% (967)
Marital status - Hispanic or Latino population 15 years and over
Males 70.9% Never married29.1% Now married0.0% Separated0.0% Widowed0.0% DivorcedFemales 83.3% Never married8.4% Now married0.0% Separated2.8% Widowed5.6% DivorcedWomen who did not give birth in the past 12 months Now married:
9.3% (21)Unmarried:
90.7% (200)
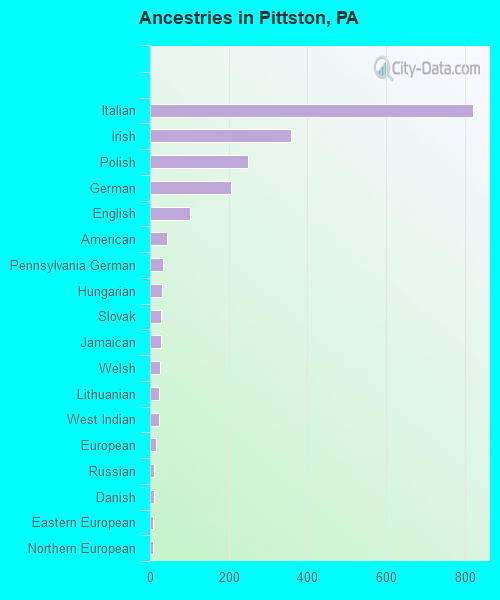
Ancestries in Pittston
820 31.4% Italian358 13.7% Irish250 9.6% Polish205 7.9% German101 3.9% English43 1.6% American34 1.3% Pennsylvania German30 1.1% Hungarian29 1.1% Slovak27 1.0% Jamaican26 1.0% Welsh22 0.8% Lithuanian22 0.8% West Indian15 0.6% European10 0.4% Russian9 0.3% Danish8 0.3% Eastern European8 0.3% Northern European7 0.3% Scottish7 0.3% African5 0.2% Carpatho Rusyn5 0.2% Croatian4 0.2% Belgian4 0.2% Scotch-Irish1 0.04% Portuguese
Children Nativity (place of birth) in Pittston
Children under 6 years - Living with two parents Both parents native 135 100.0% NativeOne native, one foreign-born parent 8 100.0% NativeChildren under 6 years - Living with one parent Native parent 500 100.0% Native
Children 6 to 17 years - Living with two parents Both parents native 201 100.0% NativeChildren 6 to 17 years - Living with one parent Native parent 745 100.0% Native
Grandparents responsible for own grandchildren in Pittston
Grandparents (30 to 59 years) White / Caucasian 38 42.4% Responsible for grandchildren52 57.6% Not responsible for grandchildrenBlack or African American 18 80.2% Responsible for grandchildren5 19.8% Not responsible for grandchildrenWhite alone, not Hispanic / Latino 42 41.8% Responsible for grandchildren59 58.2% Not responsible for grandchildren
Grandparents (60 years and over) White / Caucasian 14 100.0% Not responsible for grandchildrenWhite alone, not Hispanic / Latino 15 100.0% Not responsible for grandchildren