Races in Pharr, Texas (TX) Detailed Stats
Data:
Races - White alone (%)
Races - White alone (% change since 2000)
Races - Black alone (%)
Races - Black alone (% change since 2000)
Races - American Indian alone (%)
Races - American Indian alone (% change since 2000)
Races - Asian alone (%)
Races - Asian alone (% change since 2000)
Races - Hispanic (%)
Races - Hispanic (% change since 2000)
Races - Native Hawaiian and Other Pacific Islander alone (%)
Races - Native Hawaiian and Other Pacific Islander alone (% change since 2000)
Races - Two or more races(%)
Races - Two or more races(% change since 2000)
Races - Other race alone (%)
Races - Other race alone (% change since 2000)
Racial diversity
Place of birth - Born in state of residence (%)
Place of birth - Born in state of residence (%) - White
Place of birth - Born in state of residence (%) - Black or African American
Place of birth - Born in state of residence (%) - Asian
Place of birth - Born in state of residence (%) - Hispanic or Latino
Place of birth - Born in state of residence (%) - American Indian and Alaska Native
Place of birth - Born in state of residence (%) - Multirace
Place of birth - Born in state of residence (%) - Other Race
Place of birth - Born in other state (%)
Place of birth - Born in other state (%) - White
Place of birth - Born in other state (%) - Black or African American
Place of birth - Born in other state (%) - Asian
Place of birth - Born in other state (%) - Hispanic or Latino
Place of birth - Born in other state (%) - American Indian and Alaska Native
Place of birth - Born in other state (%) - Multirace
Place of birth - Born in other state (%) - Other Race
Place of birth - Native, outside of US (%)
Place of birth - Native, outside of US (%) - White
Place of birth - Native, outside of US (%) - Black or African American
Place of birth - Native, outside of US (%) - Asian
Place of birth - Native, outside of US (%) - Hispanic or Latino
Place of birth - Native, outside of US (%) - American Indian and Alaska Native
Place of birth - Native, outside of US (%) - Multirace
Place of birth - Native, outside of US (%) - Other Race
Place of birth - Foreign born (%)
Place of birth - Foreign born (%) - White
Place of birth - Foreign born (%) - Black or African American
Place of birth - Foreign born (%) - Asian
Place of birth - Foreign born (%) - Hispanic or Latino
Place of birth - Foreign born (%) - American Indian and Alaska Native
Place of birth - Foreign born (%) - Multirace
Place of birth - Foreign born (%) - Other Race
Residents speaking English at home (%)
Residents speaking English at home - Born in the United States (%)
Residents speaking English at home - Native, born elsewhere (%)
Residents speaking English at home - Foreign born (%)
Residents speaking Spanish at home (%)
Residents speaking Spanish at home - Born in the United States (%)
Residents speaking Spanish at home - Native, born elsewhere (%)
Residents speaking Spanish at home - Foreign born (%)
Residents speaking other language at home (%)
Residents speaking other language at home - Born in the United States (%)
Residents speaking other language at home - Native, born elsewhere (%)
Residents speaking other language at home - Foreign born (%)
Marital status - Never married (%)
Marital status - Now married (%)
Marital status - Separated (%)
Marital status - Widowed (%)
Marital status - Divorced (%)
Ancestries Reported - Arab (%)
Ancestries Reported - Czech (%)
Ancestries Reported - Danish (%)
Ancestries Reported - Dutch (%)
Ancestries Reported - English (%)
Ancestries Reported - French (%)
Ancestries Reported - French Canadian (%)
Ancestries Reported - German (%)
Ancestries Reported - Greek (%)
Ancestries Reported - Hungarian (%)
Ancestries Reported - Irish (%)
Ancestries Reported - Italian (%)
Ancestries Reported - Lithuanian (%)
Ancestries Reported - Norwegian (%)
Ancestries Reported - Polish (%)
Ancestries Reported - Portuguese (%)
Ancestries Reported - Russian (%)
Ancestries Reported - Scotch-Irish (%)
Ancestries Reported - Scottish (%)
Ancestries Reported - Slovak (%)
Ancestries Reported - Subsaharan African (%)
Ancestries Reported - Swedish (%)
Ancestries Reported - Swiss (%)
Ancestries Reported - Ukrainian (%)
Ancestries Reported - United States (%)
Ancestries Reported - Welsh (%)
Ancestries Reported - West Indian (%)
Ancestries Reported - Other (%)
Geographical mobility - Same house 1 year ago (%)
Geographical mobility - Same house 1 year ago (%) - White
Geographical mobility - Same house 1 year ago (%) - Black or African American
Geographical mobility - Same house 1 year ago (%) - Asian
Geographical mobility - Same house 1 year ago (%) - Hispanic or Latino
Geographical mobility - Same house 1 year ago (%) - American Indian and Alaska Native
Geographical mobility - Same house 1 year ago (%) - Multirace
Geographical mobility - Same house 1 year ago (%) - Other Race
Geographical mobility - Moved within same county (%)
Geographical mobility - Moved within same county (%) - White
Geographical mobility - Moved within same county (%) - Black or African American
Geographical mobility - Moved within same county (%) - Asian
Geographical mobility - Moved within same county (%) - Hispanic or Latino
Geographical mobility - Moved within same county (%) - American Indian and Alaska Native
Geographical mobility - Moved within same county (%) - Multirace
Geographical mobility - Moved within same county (%) - Other Race
Geographical mobility - Moved from different county within same state (%)
Geographical mobility - Moved from different county within same state (%) - White
Geographical mobility - Moved from different county within same state (%) - Black or African American
Geographical mobility - Moved from different county within same state (%) - Asian
Geographical mobility - Moved from different county within same state (%) - Hispanic or Latino
Geographical mobility - Moved from different county within same state (%) - American Indian and Alaska Native
Geographical mobility - Moved from different county within same state (%) - Multirace
Geographical mobility - Moved from different county within same state (%) - Other Race
Geographical mobility - Moved from different state (%)
Geographical mobility - Moved from different state (%) - White
Geographical mobility - Moved from different state (%) - Black or African American
Geographical mobility - Moved from different state (%) - Asian
Geographical mobility - Moved from different state (%) - Hispanic or Latino
Geographical mobility - Moved from different state (%) - American Indian and Alaska Native
Geographical mobility - Moved from different state (%) - Multirace
Geographical mobility - Moved from different state (%) - Other Race
Geographical mobility - Moved from abroad (%)
Geographical mobility - Moved from abroad (%) - White
Geographical mobility - Moved from abroad (%) - Black or African American
Geographical mobility - Moved from abroad (%) - Asian
Geographical mobility - Moved from abroad (%) - Hispanic or Latino
Geographical mobility - Moved from abroad (%) - American Indian and Alaska Native
Geographical mobility - Moved from abroad (%) - Multirace
Geographical mobility - Moved from abroad (%) - Other Race
Place of birth for the foreign-born population - Ireland (%)
Place of birth for the foreign-born population - Denmark (%)
Place of birth for the foreign-born population - Norway (%)
Place of birth for the foreign-born population - Sweden (%)
Place of birth for the foreign-born population - United Kingdom (%)
Place of birth for the foreign-born population - England (%)
Place of birth for the foreign-born population - Scotland (%)
Place of birth for the foreign-born population - Other Northern Europe (%)
Place of birth for the foreign-born population - Austria (%)
Place of birth for the foreign-born population - Belgium (%)
Place of birth for the foreign-born population - France (%)
Place of birth for the foreign-born population - Germany (%)
Place of birth for the foreign-born population - Netherlands (%)
Place of birth for the foreign-born population - Switzerland (%)
Place of birth for the foreign-born population - Other Western Europe (%)
Place of birth for the foreign-born population - Greece (%)
Place of birth for the foreign-born population - Italy (%)
Place of birth for the foreign-born population - Portugal (%)
Place of birth for the foreign-born population - Spain (%)
Place of birth for the foreign-born population - Other Southern Europe (%)
Place of birth for the foreign-born population - Albania (%)
Place of birth for the foreign-born population - Belarus (%)
Place of birth for the foreign-born population - Bosnia and Herzegovina (%)
Place of birth for the foreign-born population - Bulgaria (%)
Place of birth for the foreign-born population - Croatia (%)
Place of birth for the foreign-born population - Czechoslovakia (%)
Place of birth for the foreign-born population - Hungary (%)
Place of birth for the foreign-born population - Latvia (%)
Place of birth for the foreign-born population - Lithuania (%)
Place of birth for the foreign-born population - North Macedonia (Macedonia) (%)
Place of birth for the foreign-born population - Moldova (%)
Place of birth for the foreign-born population - Poland (%)
Place of birth for the foreign-born population - Romania (%)
Place of birth for the foreign-born population - Russia (%)
Place of birth for the foreign-born population - Serbia (%)
Place of birth for the foreign-born population - Ukraine (%)
Place of birth for the foreign-born population - Other Eastern Europe (%)
Place of birth for the foreign-born population - China (%)
Place of birth for the foreign-born population - Hong Kong (%)
Place of birth for the foreign-born population - Taiwan (%)
Place of birth for the foreign-born population - Japan (%)
Place of birth for the foreign-born population - Korea (%)
Place of birth for the foreign-born population - Other Eastern Asia (%)
Place of birth for the foreign-born population - Afghanistan (%)
Place of birth for the foreign-born population - Bangladesh (%)
Place of birth for the foreign-born population - India (%)
Place of birth for the foreign-born population - Iran (%)
Place of birth for the foreign-born population - Kazakhstan (%)
Place of birth for the foreign-born population - Nepal (%)
Place of birth for the foreign-born population - Pakistan (%)
Place of birth for the foreign-born population - Sri Lanka (%)
Place of birth for the foreign-born population - Uzbekistan (%)
Place of birth for the foreign-born population - Other South Central Asia (%)
Place of birth for the foreign-born population - Burma (%)
Place of birth for the foreign-born population - Cambodia (%)
Place of birth for the foreign-born population - Indonesia (%)
Place of birth for the foreign-born population - Laos (%)
Place of birth for the foreign-born population - Malaysia (%)
Place of birth for the foreign-born population - Philippines (%)
Place of birth for the foreign-born population - Singapore (%)
Place of birth for the foreign-born population - Thailand (%)
Place of birth for the foreign-born population - Vietnam (%)
Place of birth for the foreign-born population - Other South Eastern Asia (%)
Place of birth for the foreign-born population - Armenia (%)
Place of birth for the foreign-born population - Iraq (%)
Place of birth for the foreign-born population - Israel (%)
Place of birth for the foreign-born population - Jordan (%)
Place of birth for the foreign-born population - Kuwait (%)
Place of birth for the foreign-born population - Lebanon (%)
Place of birth for the foreign-born population - Saudi Arabia (%)
Place of birth for the foreign-born population - Syria (%)
Place of birth for the foreign-born population - Turkey (%)
Place of birth for the foreign-born population - Yemen (%)
Place of birth for the foreign-born population - Other Western Asia (%)
Place of birth for the foreign-born population - Eritrea (%)
Place of birth for the foreign-born population - Ethiopia (%)
Place of birth for the foreign-born population - Kenya (%)
Place of birth for the foreign-born population - Somalia (%)
Place of birth for the foreign-born population - Uganda (%)
Place of birth for the foreign-born population - Zimbabwe (%)
Place of birth for the foreign-born population - Other Eastern Africa (%)
Place of birth for the foreign-born population - Cameroon (%)
Place of birth for the foreign-born population - Congo (%)
Place of birth for the foreign-born population - Democratic Republic of Congo (Zaire) (%)
Place of birth for the foreign-born population - Other Middle Africa (%)
Place of birth for the foreign-born population - Egypt (%)
Place of birth for the foreign-born population - Morocco (%)
Place of birth for the foreign-born population - Sudan (%)
Place of birth for the foreign-born population - Other Northern Africa (%)
Place of birth for the foreign-born population - South Africa (%)
Place of birth for the foreign-born population - Other Southern Africa (%)
Place of birth for the foreign-born population - Cabo Verde (%)
Place of birth for the foreign-born population - Ghana (%)
Place of birth for the foreign-born population - Liberia (%)
Place of birth for the foreign-born population - Nigeria (%)
Place of birth for the foreign-born population - Senegal (%)
Place of birth for the foreign-born population - Sierra Leone (%)
Place of birth for the foreign-born population - Other Western Africa (%)
Place of birth for the foreign-born population - Australia (%)
Place of birth for the foreign-born population - New Zealand (%)
Place of birth for the foreign-born population - Fiji (%)
Place of birth for the foreign-born population - Micronesia (%)
Place of birth for the foreign-born population - Bahamas (%)
Place of birth for the foreign-born population - Barbados (%)
Place of birth for the foreign-born population - Cuba (%)
Place of birth for the foreign-born population - Dominica (%)
Place of birth for the foreign-born population - Dominican Republic (%)
Place of birth for the foreign-born population - Grenada (%)
Place of birth for the foreign-born population - Haiti (%)
Place of birth for the foreign-born population - Jamaica (%)
Place of birth for the foreign-born population - St. Vincent and the Grenadines (%)
Place of birth for the foreign-born population - Trinidad and Tobago (%)
Place of birth for the foreign-born population - West Indies (%)
Place of birth for the foreign-born population - Other Caribbean (%)
Place of birth for the foreign-born population - Belize (%)
Place of birth for the foreign-born population - Costa Rica (%)
Place of birth for the foreign-born population - El Salvador (%)
Place of birth for the foreign-born population - Guatemala (%)
Place of birth for the foreign-born population - Honduras (%)
Place of birth for the foreign-born population - Mexico (%)
Place of birth for the foreign-born population - Nicaragua (%)
Place of birth for the foreign-born population - Panama (%)
Place of birth for the foreign-born population - Other Central America (%)
Place of birth for the foreign-born population - Argentina (%)
Place of birth for the foreign-born population - Bolivia (%)
Place of birth for the foreign-born population - Brazil (%)
Place of birth for the foreign-born population - Chile (%)
Place of birth for the foreign-born population - Colombia (%)
Place of birth for the foreign-born population - Ecuador (%)
Place of birth for the foreign-born population - Guyana (%)
Place of birth for the foreign-born population - Peru (%)
Place of birth for the foreign-born population - Uruguay (%)
Place of birth for the foreign-born population - Venezuela (%)
Place of birth for the foreign-born population - Other South America (%)
Place of birth for the foreign-born population - Canada (%)
Place of birth for the foreign-born population - Other Northern America (%)
Place of birth for the foreign-born population - Other (%)
Latest news about races in Pharr, TX collected exclusively by city-data.com from local newspapers, TV, and radio stations
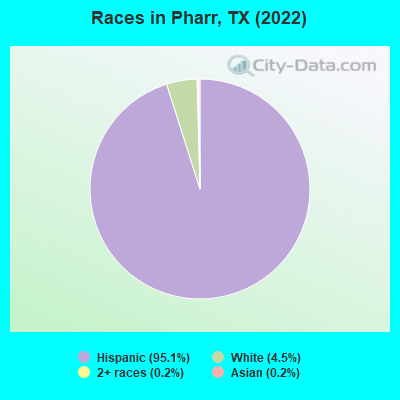
According to 2022 data, the most numerous races in Pharr, TX are Hispanic (76,824 residents), White alone (3,669 residents), and Black alone (50 residents). 16.6% of Pharr residents speak English at home. 30.9% of Pharr, TX residents are foreign-born (30.1% born in Latin America), which is 45.0% greater than the foreign-born rate of 17.0% across the entire state of Texas.
Race distribution in Pharr
2000 2022
10,933,313 52.4% White alone 6,669,666 32.0% Hispanic 2,364,255 11.3% Black alone 554,445 2.7% Asian alone 230,567 1.1% Two or more races 68,859 0.3% American Indian alone 19,958 0.10% Other race alone 10,757 0.05% Native Hawaiian and Other
12,070,642 40.2% Hispanic 11,683,430 38.9% White alone 3,508,706 11.7% Black alone 1,608,173 5.4% Asian alone 956,560 3.2% Two or more races 125,763 0.4% Other race alone 47,023 0.2% American Indian alone 29,275 0.10% Native Hawaiian and Other
Income and house value in Pharr Median household income in 2022 $41,029 White non-Hispanic householders$37,617 Some other race householders$49,340 Two or more races householders$48,959 Hispanic or Latino race householdersMedian 2022 house value $245,350 White Non-Hispanic householders$219,406 American Indian or Alaska Native householders $120,112 Asian householders$143,815 Some other race householders$180,969 Two or more races householders$139,010 Hispanic or Latino householders
Median age by race in Pharr
26.4 Median age for White residents20.9 27.3 -666,666,666.0 Median age for Black or African American residents-666,666,666.0 -666,666,666.0 50.9 Median age for American Indian / Alaska Native residents-666,666,666.0 -666,666,666.0 -666,666,666.0 Median age for Asian residents-666,666,666.0 -666,666,666.0 -666,666,666.0 Median age for Native Hawaiian / Pacific Islander residents-666,666,666.0 -666,666,666.0 37.9 Median age for Other race residents28.4 40.8 27.2 Median age for Two or more races residents25.8 28.7 43.9 Median age for White alone residents56.0 39.0 27.3 Median age for Hispanic or Latino residents24.8 27.9
Owner/renter occupied households by race in Pharr
House owners and renters - White residents 2,472 57.5% Owner occupied1,827 42.5% Renter occupiedHouse owners and renters - Black or African American residents 36 26.4% Owner occupied99 73.6% Renter occupiedHouse owners and renters - American Indian / Alaska Native residents 23 100.0% Owner occupiedHouse owners and renters - Asian residents 36 57.6% Owner occupied26 42.4% Renter occupiedHouse owners and renters - Other race residents 784 46.9% Owner occupied889 53.1% Renter occupiedHouse owners and renters - Two or more races residents 9,184 53.9% Owner occupied7,858 46.1% Renter occupiedHouse owners and renters - White alone residents 581 63.8% Owner occupied329 36.2% Renter occupiedHouse owners and renters - Hispanic or Latino residents 11,934 53.4% Owner occupied10,432 46.6% Renter occupied
Language usage in Pharr
English speakers - Total 16.6% of residents of Pharr speak English at home.
82.9% of residents speak Spanish at home 38,454 62.8% Speak English very well22,738 37.2% Speak English less than very well0.4% of residents speak other language at home 266 94.3% Speak English very well16 5.7% Speak English less than very well
English speakers - Born in the United States 48.1% of residents of Pharr speak English at home.
50.7% of residents speak Spanish at home 2,876 94.9% Speak English very well154 5.1% Speak English less than very well1.2% of residents speak other language at home 71 100.0% Speak English very well
English speakers - Native, born elsewhere 9.6% of residents of Pharr speak English at home.
86.4% of residents speak Spanish at home 218 36.6% Speak English very well377 63.4% Speak English less than very well10.2% of residents speak other language at home 70 100.0% Speak English very well
English speakers - Foreign-born 7.5% of residents of Pharr speak English at home.
92.1% of residents speak Spanish at home 5,792 25.8% Speak English very well16,686 74.2% Speak English less than very well0.4% of residents speak other language at home 91 86.7% Speak English very well14 13.3% Speak English less than very well
White (Caucasian) - Speak only English Native:
44.6% (5,070)Foreign-born:
14.0% (235)
White (Caucasian) - Speak another language Native:
55.4% (6,306)Foreign-born:
86.0% (1,438)
Asian - Speak another language Native:
25.5% (5)Foreign-born:
100.0% (96)
Other race - Speak only English Native:
22.6% (477)Foreign-born:
7.4% (131)
Other race - Speak another language Native:
77.4% (1,630)Foreign-born:
92.6% (1,649)
Two or more races - Speak only English Native:
7.2% (2,609)Foreign-born:
2.5% (499)
Two or more races - Speak another language Native:
92.8% (33,650)Foreign-born:
97.5% (19,510)
White alone - Speak only English Native:
82.7% (2,749)Foreign-born:
47.2% (52)
White alone - Speak another language Native:
17.3% (576)Foreign-born:
23.7% (26)
Hispanic or Latino - Speak only English Native:
13.5% (6,470)Foreign-born:
3.5% (825)
Hispanic or Latino - Speak another language Native:
86.5% (41,401)Foreign-born:
96.5% (22,597)
Foreign-born residents in Pharr 24,966 residents are foreign born (30.1% Latin America ).
This city:
30.9%Texas:
17.1%
Marital status for residents in Pharr Marital status - White (Caucasian) population 15 years and over
Males 32.6% Never married48.2% Now married16.6% Separated0.0% Widowed2.6% DivorcedFemales 55.3% Never married26.9% Now married1.4% Separated7.5% Widowed9.0% DivorcedWomen who gave birth in the past 12 months Now married:
100.0% (72)Unmarried:
0.0% (0)
Women who did not give birth in the past 12 months Now married:
22.8% (1,047)Unmarried:
77.2% (3,545)
Marital status - Black or African American population 15 years and over
Males 23.0% Never married59.0% Now married0.0% Separated18.0% Widowed0.0% DivorcedFemales 61.4% Never married38.6% Now married0.0% Separated0.0% Widowed0.0% DivorcedWomen who did not give birth in the past 12 months Now married:
37.7% (58)Unmarried:
62.3% (95)
Marital status - American Indian / Alaska Native population 15 years and over
Males 0.0% Never married100.0% Now married0.0% Separated0.0% Widowed0.0% DivorcedFemales 20.0% Never married80.0% Now married0.0% Separated0.0% Widowed0.0% DivorcedWomen who did not give birth in the past 12 months Now married:
70.6% (17)Unmarried:
29.4% (7)
Marital status - Asian population 15 years and over
Males 13.0% Never married87.0% Now married0.0% Separated0.0% Widowed0.0% DivorcedFemales 62.5% Never married6.2% Now married0.0% Separated31.3% Widowed0.0% DivorcedWomen who did not give birth in the past 12 months Now married:
9.1% (4)Unmarried:
90.9% (39)
Marital status - Other race population 15 years and over
Males 35.8% Never married52.1% Now married1.3% Separated2.6% Widowed8.3% DivorcedFemales 34.4% Never married42.8% Now married2.7% Separated10.5% Widowed9.7% DivorcedWomen who gave birth in the past 12 months Now married:
100.0% (102)Unmarried:
0.0% (0)
Women who did not give birth in the past 12 months Now married:
51.6% (595)Unmarried:
48.4% (557)
Marital status - Two or more races population 15 years and over
Males 47.3% Never married47.1% Now married0.7% Separated0.6% Widowed4.3% DivorcedFemales 34.4% Never married45.5% Now married9.5% Separated6.0% Widowed4.7% DivorcedWomen who gave birth in the past 12 months Now married:
88.5% (538)Unmarried:
11.5% (70)
Women who did not give birth in the past 12 months Now married:
49.7% (7,419)Unmarried:
50.3% (7,521)
Marital status - White alone, not Hispanic / Latino population 15 years and over
Males 20.2% Never married55.3% Now married0.9% Separated4.3% Widowed19.2% DivorcedFemales 18.6% Never married52.8% Now married4.5% Separated15.5% Widowed8.5% DivorcedWomen who gave birth in the past 12 months Now married:
100.0% (19)Unmarried:
0.0% (0)
Women who did not give birth in the past 12 months Now married:
40.2% (224)Unmarried:
59.8% (334)
Marital status - Hispanic or Latino population 15 years and over
Males 44.9% Never married47.8% Now married3.1% Separated0.5% Widowed3.6% DivorcedFemales 39.0% Never married42.6% Now married7.6% Separated5.8% Widowed5.1% DivorcedWomen who gave birth in the past 12 months Now married:
91.0% (712)Unmarried:
9.0% (70)
Women who did not give birth in the past 12 months Now married:
43.8% (8,928)Unmarried:
56.2% (11,455)
Ancestries in Pharr
919 1.4% American377 0.6% German302 0.4% Irish253 0.4% English98 0.1% Scandinavian66 0.10% Scottish60 0.09% Polish58 0.09% French49 0.07% Italian28 0.04% Scotch-Irish27 0.04% Belgian27 0.04% Turkish26 0.04% European24 0.04% Canadian20 0.03% Estonian15 0.02% British14 0.02% Maltese12 0.02% Hungarian9 0.01% Norwegian
Geographical mobility in Pharr Same house 1 year ago 19,192 90.0% White (Caucasian)374 92.7% Black or African American54 100.0% American Indian / Alaska Native92 71.5% Asian6,685 92.2% Other race49,134 80.6% Two or more races3,472 95.6% White alone, not Hispanic / Latino62,918 82.1% Hispanic or LatinoMoved within same county 1,720 8.1% White / Caucasian29 7.1% Black or African American3 44.4% Native Hawaiian / Pacific Islander389 5.4% Other race9,770 16.0% Two or more races95 2.6% White alone, not Hispanic / Latino11,200 14.6% Hispanic or LatinoMoved within same state 112 0.5% White / Caucasian15 12.0% Asian21 0.3% Other race423 0.7% Two or more races26 0.7% White alone, not Hispanic / Latino774 1.0% Hispanic or LatinoMoved from different state 128 0.6% White / Caucasian26 20.7% Asian58 0.8% Other race91 2.5% White alone, not Hispanic / Latino52 0.1% Hispanic or LatinoMoved from abroad 9 0.0% White85 1.2% Other race1,654 2.7% Two or more races1,694 2.2% Hispanic or Latino
Children Nativity (place of birth) in Pharr
Children under 6 years - Living with two parents Both parents native 747 100.0% NativeBoth parents foreign-born 1,128 100.0% NativeOne native, one foreign-born parent 1,282 85.2% Native223 14.8% Foreign-bornChildren under 6 years - Living with one parent Native parent 3,195 100.0% NativeForeign-born parent 979 100.0% NativeChildren 6 to 17 years - Living with two parents Both parents native 2,049 100.0% NativeBoth parents foreign-born 3,401 88.6% Native437 11.4% Foreign-bornOne native, one foreign-born parent 3,503 93.0% Native265 7.0% Foreign-bornChildren 6 to 17 years - Living with one parent Native parent 4,129 100.0% NativeForeign-born parent 4,497 51.6% Native4,226 48.4% Foreign-born
Grandparents responsible for own grandchildren in Pharr
Grandparents (30 to 59 years) White / Caucasian 252 46.0% Responsible for grandchildren297 54.0% Not responsible for grandchildrenOther race 102 55.6% Responsible for grandchildren81 44.4% Not responsible for grandchildrenTwo or more races 532 52.0% Responsible for grandchildren491 48.0% Not responsible for grandchildrenWhite alone, not Hispanic / Latino 8 100.0% Not responsible for grandchildrenHispanic or Latino 628 54.0% Responsible for grandchildren536 46.0% Not responsible for grandchildrenGrandparents (60 years and over) White / Caucasian 97 19.3% Responsible for grandchildren405 80.7% Not responsible for grandchildrenOther race 50 100.0% Not responsible for grandchildrenTwo or more races 402 33.3% Responsible for grandchildren804 66.7% Not responsible for grandchildrenWhite alone, not Hispanic / Latino 15 100.0% Not responsible for grandchildrenHispanic or Latino 402 26.3% Responsible for grandchildren1,127 73.7% Not responsible for grandchildren