Races in Oxon Hill, Maryland (MD) Detailed Stats
Data:
Races - White alone (%)
Races - White alone (% change since 2000)
Races - Black alone (%)
Races - Black alone (% change since 2000)
Races - American Indian alone (%)
Races - American Indian alone (% change since 2000)
Races - Asian alone (%)
Races - Asian alone (% change since 2000)
Races - Hispanic (%)
Races - Hispanic (% change since 2000)
Races - Native Hawaiian and Other Pacific Islander alone (%)
Races - Native Hawaiian and Other Pacific Islander alone (% change since 2000)
Races - Two or more races(%)
Races - Two or more races(% change since 2000)
Races - Other race alone (%)
Races - Other race alone (% change since 2000)
Racial diversity
Place of birth - Born in state of residence (%)
Place of birth - Born in state of residence (%) - White
Place of birth - Born in state of residence (%) - Black or African American
Place of birth - Born in state of residence (%) - Asian
Place of birth - Born in state of residence (%) - Hispanic or Latino
Place of birth - Born in state of residence (%) - American Indian and Alaska Native
Place of birth - Born in state of residence (%) - Multirace
Place of birth - Born in state of residence (%) - Other Race
Place of birth - Born in other state (%)
Place of birth - Born in other state (%) - White
Place of birth - Born in other state (%) - Black or African American
Place of birth - Born in other state (%) - Asian
Place of birth - Born in other state (%) - Hispanic or Latino
Place of birth - Born in other state (%) - American Indian and Alaska Native
Place of birth - Born in other state (%) - Multirace
Place of birth - Born in other state (%) - Other Race
Place of birth - Native, outside of US (%)
Place of birth - Native, outside of US (%) - White
Place of birth - Native, outside of US (%) - Black or African American
Place of birth - Native, outside of US (%) - Asian
Place of birth - Native, outside of US (%) - Hispanic or Latino
Place of birth - Native, outside of US (%) - American Indian and Alaska Native
Place of birth - Native, outside of US (%) - Multirace
Place of birth - Native, outside of US (%) - Other Race
Place of birth - Foreign born (%)
Place of birth - Foreign born (%) - White
Place of birth - Foreign born (%) - Black or African American
Place of birth - Foreign born (%) - Asian
Place of birth - Foreign born (%) - Hispanic or Latino
Place of birth - Foreign born (%) - American Indian and Alaska Native
Place of birth - Foreign born (%) - Multirace
Place of birth - Foreign born (%) - Other Race
Residents speaking English at home (%)
Residents speaking English at home - Born in the United States (%)
Residents speaking English at home - Native, born elsewhere (%)
Residents speaking English at home - Foreign born (%)
Residents speaking Spanish at home (%)
Residents speaking Spanish at home - Born in the United States (%)
Residents speaking Spanish at home - Native, born elsewhere (%)
Residents speaking Spanish at home - Foreign born (%)
Residents speaking other language at home (%)
Residents speaking other language at home - Born in the United States (%)
Residents speaking other language at home - Native, born elsewhere (%)
Residents speaking other language at home - Foreign born (%)
Marital status - Never married (%)
Marital status - Now married (%)
Marital status - Separated (%)
Marital status - Widowed (%)
Marital status - Divorced (%)
Ancestries Reported - Arab (%)
Ancestries Reported - Czech (%)
Ancestries Reported - Danish (%)
Ancestries Reported - Dutch (%)
Ancestries Reported - English (%)
Ancestries Reported - French (%)
Ancestries Reported - French Canadian (%)
Ancestries Reported - German (%)
Ancestries Reported - Greek (%)
Ancestries Reported - Hungarian (%)
Ancestries Reported - Irish (%)
Ancestries Reported - Italian (%)
Ancestries Reported - Lithuanian (%)
Ancestries Reported - Norwegian (%)
Ancestries Reported - Polish (%)
Ancestries Reported - Portuguese (%)
Ancestries Reported - Russian (%)
Ancestries Reported - Scotch-Irish (%)
Ancestries Reported - Scottish (%)
Ancestries Reported - Slovak (%)
Ancestries Reported - Subsaharan African (%)
Ancestries Reported - Swedish (%)
Ancestries Reported - Swiss (%)
Ancestries Reported - Ukrainian (%)
Ancestries Reported - United States (%)
Ancestries Reported - Welsh (%)
Ancestries Reported - West Indian (%)
Ancestries Reported - Other (%)
Geographical mobility - Same house 1 year ago (%)
Geographical mobility - Same house 1 year ago (%) - White
Geographical mobility - Same house 1 year ago (%) - Black or African American
Geographical mobility - Same house 1 year ago (%) - Asian
Geographical mobility - Same house 1 year ago (%) - Hispanic or Latino
Geographical mobility - Same house 1 year ago (%) - American Indian and Alaska Native
Geographical mobility - Same house 1 year ago (%) - Multirace
Geographical mobility - Same house 1 year ago (%) - Other Race
Geographical mobility - Moved within same county (%)
Geographical mobility - Moved within same county (%) - White
Geographical mobility - Moved within same county (%) - Black or African American
Geographical mobility - Moved within same county (%) - Asian
Geographical mobility - Moved within same county (%) - Hispanic or Latino
Geographical mobility - Moved within same county (%) - American Indian and Alaska Native
Geographical mobility - Moved within same county (%) - Multirace
Geographical mobility - Moved within same county (%) - Other Race
Geographical mobility - Moved from different county within same state (%)
Geographical mobility - Moved from different county within same state (%) - White
Geographical mobility - Moved from different county within same state (%) - Black or African American
Geographical mobility - Moved from different county within same state (%) - Asian
Geographical mobility - Moved from different county within same state (%) - Hispanic or Latino
Geographical mobility - Moved from different county within same state (%) - American Indian and Alaska Native
Geographical mobility - Moved from different county within same state (%) - Multirace
Geographical mobility - Moved from different county within same state (%) - Other Race
Geographical mobility - Moved from different state (%)
Geographical mobility - Moved from different state (%) - White
Geographical mobility - Moved from different state (%) - Black or African American
Geographical mobility - Moved from different state (%) - Asian
Geographical mobility - Moved from different state (%) - Hispanic or Latino
Geographical mobility - Moved from different state (%) - American Indian and Alaska Native
Geographical mobility - Moved from different state (%) - Multirace
Geographical mobility - Moved from different state (%) - Other Race
Geographical mobility - Moved from abroad (%)
Geographical mobility - Moved from abroad (%) - White
Geographical mobility - Moved from abroad (%) - Black or African American
Geographical mobility - Moved from abroad (%) - Asian
Geographical mobility - Moved from abroad (%) - Hispanic or Latino
Geographical mobility - Moved from abroad (%) - American Indian and Alaska Native
Geographical mobility - Moved from abroad (%) - Multirace
Geographical mobility - Moved from abroad (%) - Other Race
Place of birth for the foreign-born population - Ireland (%)
Place of birth for the foreign-born population - Denmark (%)
Place of birth for the foreign-born population - Norway (%)
Place of birth for the foreign-born population - Sweden (%)
Place of birth for the foreign-born population - United Kingdom (%)
Place of birth for the foreign-born population - England (%)
Place of birth for the foreign-born population - Scotland (%)
Place of birth for the foreign-born population - Other Northern Europe (%)
Place of birth for the foreign-born population - Austria (%)
Place of birth for the foreign-born population - Belgium (%)
Place of birth for the foreign-born population - France (%)
Place of birth for the foreign-born population - Germany (%)
Place of birth for the foreign-born population - Netherlands (%)
Place of birth for the foreign-born population - Switzerland (%)
Place of birth for the foreign-born population - Other Western Europe (%)
Place of birth for the foreign-born population - Greece (%)
Place of birth for the foreign-born population - Italy (%)
Place of birth for the foreign-born population - Portugal (%)
Place of birth for the foreign-born population - Spain (%)
Place of birth for the foreign-born population - Other Southern Europe (%)
Place of birth for the foreign-born population - Albania (%)
Place of birth for the foreign-born population - Belarus (%)
Place of birth for the foreign-born population - Bosnia and Herzegovina (%)
Place of birth for the foreign-born population - Bulgaria (%)
Place of birth for the foreign-born population - Croatia (%)
Place of birth for the foreign-born population - Czechoslovakia (%)
Place of birth for the foreign-born population - Hungary (%)
Place of birth for the foreign-born population - Latvia (%)
Place of birth for the foreign-born population - Lithuania (%)
Place of birth for the foreign-born population - North Macedonia (Macedonia) (%)
Place of birth for the foreign-born population - Moldova (%)
Place of birth for the foreign-born population - Poland (%)
Place of birth for the foreign-born population - Romania (%)
Place of birth for the foreign-born population - Russia (%)
Place of birth for the foreign-born population - Serbia (%)
Place of birth for the foreign-born population - Ukraine (%)
Place of birth for the foreign-born population - Other Eastern Europe (%)
Place of birth for the foreign-born population - China (%)
Place of birth for the foreign-born population - Hong Kong (%)
Place of birth for the foreign-born population - Taiwan (%)
Place of birth for the foreign-born population - Japan (%)
Place of birth for the foreign-born population - Korea (%)
Place of birth for the foreign-born population - Other Eastern Asia (%)
Place of birth for the foreign-born population - Afghanistan (%)
Place of birth for the foreign-born population - Bangladesh (%)
Place of birth for the foreign-born population - India (%)
Place of birth for the foreign-born population - Iran (%)
Place of birth for the foreign-born population - Kazakhstan (%)
Place of birth for the foreign-born population - Nepal (%)
Place of birth for the foreign-born population - Pakistan (%)
Place of birth for the foreign-born population - Sri Lanka (%)
Place of birth for the foreign-born population - Uzbekistan (%)
Place of birth for the foreign-born population - Other South Central Asia (%)
Place of birth for the foreign-born population - Burma (%)
Place of birth for the foreign-born population - Cambodia (%)
Place of birth for the foreign-born population - Indonesia (%)
Place of birth for the foreign-born population - Laos (%)
Place of birth for the foreign-born population - Malaysia (%)
Place of birth for the foreign-born population - Philippines (%)
Place of birth for the foreign-born population - Singapore (%)
Place of birth for the foreign-born population - Thailand (%)
Place of birth for the foreign-born population - Vietnam (%)
Place of birth for the foreign-born population - Other South Eastern Asia (%)
Place of birth for the foreign-born population - Armenia (%)
Place of birth for the foreign-born population - Iraq (%)
Place of birth for the foreign-born population - Israel (%)
Place of birth for the foreign-born population - Jordan (%)
Place of birth for the foreign-born population - Kuwait (%)
Place of birth for the foreign-born population - Lebanon (%)
Place of birth for the foreign-born population - Saudi Arabia (%)
Place of birth for the foreign-born population - Syria (%)
Place of birth for the foreign-born population - Turkey (%)
Place of birth for the foreign-born population - Yemen (%)
Place of birth for the foreign-born population - Other Western Asia (%)
Place of birth for the foreign-born population - Eritrea (%)
Place of birth for the foreign-born population - Ethiopia (%)
Place of birth for the foreign-born population - Kenya (%)
Place of birth for the foreign-born population - Somalia (%)
Place of birth for the foreign-born population - Uganda (%)
Place of birth for the foreign-born population - Zimbabwe (%)
Place of birth for the foreign-born population - Other Eastern Africa (%)
Place of birth for the foreign-born population - Cameroon (%)
Place of birth for the foreign-born population - Congo (%)
Place of birth for the foreign-born population - Democratic Republic of Congo (Zaire) (%)
Place of birth for the foreign-born population - Other Middle Africa (%)
Place of birth for the foreign-born population - Egypt (%)
Place of birth for the foreign-born population - Morocco (%)
Place of birth for the foreign-born population - Sudan (%)
Place of birth for the foreign-born population - Other Northern Africa (%)
Place of birth for the foreign-born population - South Africa (%)
Place of birth for the foreign-born population - Other Southern Africa (%)
Place of birth for the foreign-born population - Cabo Verde (%)
Place of birth for the foreign-born population - Ghana (%)
Place of birth for the foreign-born population - Liberia (%)
Place of birth for the foreign-born population - Nigeria (%)
Place of birth for the foreign-born population - Senegal (%)
Place of birth for the foreign-born population - Sierra Leone (%)
Place of birth for the foreign-born population - Other Western Africa (%)
Place of birth for the foreign-born population - Australia (%)
Place of birth for the foreign-born population - New Zealand (%)
Place of birth for the foreign-born population - Fiji (%)
Place of birth for the foreign-born population - Micronesia (%)
Place of birth for the foreign-born population - Bahamas (%)
Place of birth for the foreign-born population - Barbados (%)
Place of birth for the foreign-born population - Cuba (%)
Place of birth for the foreign-born population - Dominica (%)
Place of birth for the foreign-born population - Dominican Republic (%)
Place of birth for the foreign-born population - Grenada (%)
Place of birth for the foreign-born population - Haiti (%)
Place of birth for the foreign-born population - Jamaica (%)
Place of birth for the foreign-born population - St. Vincent and the Grenadines (%)
Place of birth for the foreign-born population - Trinidad and Tobago (%)
Place of birth for the foreign-born population - West Indies (%)
Place of birth for the foreign-born population - Other Caribbean (%)
Place of birth for the foreign-born population - Belize (%)
Place of birth for the foreign-born population - Costa Rica (%)
Place of birth for the foreign-born population - El Salvador (%)
Place of birth for the foreign-born population - Guatemala (%)
Place of birth for the foreign-born population - Honduras (%)
Place of birth for the foreign-born population - Mexico (%)
Place of birth for the foreign-born population - Nicaragua (%)
Place of birth for the foreign-born population - Panama (%)
Place of birth for the foreign-born population - Other Central America (%)
Place of birth for the foreign-born population - Argentina (%)
Place of birth for the foreign-born population - Bolivia (%)
Place of birth for the foreign-born population - Brazil (%)
Place of birth for the foreign-born population - Chile (%)
Place of birth for the foreign-born population - Colombia (%)
Place of birth for the foreign-born population - Ecuador (%)
Place of birth for the foreign-born population - Guyana (%)
Place of birth for the foreign-born population - Peru (%)
Place of birth for the foreign-born population - Uruguay (%)
Place of birth for the foreign-born population - Venezuela (%)
Place of birth for the foreign-born population - Other South America (%)
Place of birth for the foreign-born population - Canada (%)
Place of birth for the foreign-born population - Other Northern America (%)
Place of birth for the foreign-born population - Other (%)
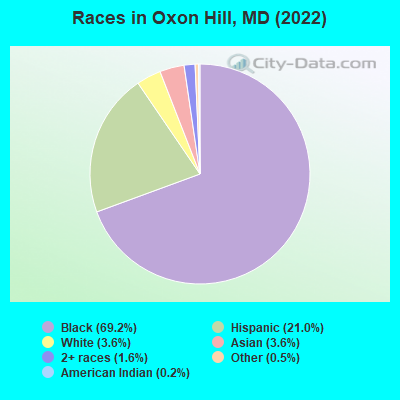
According to 2022 data, the most numerous races in Oxon Hill, MD are White alone (668 residents), Black alone (12,690 residents), and Hispanic (3,845 residents). 73.8% of Oxon Hill residents speak English at home.
Race distribution in Oxon Hill 12,690 69.2% Black alone 3,845 21.0% Hispanic 668 3.6% White alone 653 3.6% Asian alone 291 1.6% Two or more races 99 0.5% Other race alone 40 0.2% American Indian alone
2000 2022
3,286,547 62.1% White alone 1,464,735 27.7% Black alone 227,916 4.3% Hispanic 209,738 4.0% Asian alone 82,946 1.6% Two or more races 13,312 0.3% American Indian alone 9,379 0.2% Other race alone 1,913 0.04% Native Hawaiian and Other
2,906,492 47.1% White alone 1,800,914 29.2% Black alone 705,842 11.4% Hispanic 401,818 6.5% Asian alone 291,317 4.7% Two or more races 46,930 0.8% Other race alone 8,930 0.1% American Indian alone 2,417 0.04% Native Hawaiian and Other
Income and house value in Oxon Hill Median household income in 2022 $84,845 White non-Hispanic householders$98,037 Black householdersover $200,000 American Indian and Alaska Native householders$73,659 Asian householders$81,338 Some other race householders$33,659 Two or more races householders$76,682 Hispanic or Latino race householders
Median age by race in Oxon Hill
49.1 Median age for White residents48.5 49.3 49.0 Median age for Black or African American residents48.0 49.3 41.7 Median age for American Indian / Alaska Native residents49.3 32.5 58.4 Median age for Asian residents51.5 73.1 -571,600,480.8 Median age for Native Hawaiian / Pacific Islander residents-720,061,021.4 -760,942,760.2 27.3 Median age for Other race residents33.0 22.7 40.6 Median age for Two or more races residents21.5 42.1 61.4 Median age for White alone residents61.7 60.1 30.4 Median age for Hispanic or Latino residents36.3 24.0
Owner/renter occupied households by race in Oxon Hill
House owners and renters - White residents 358 82.6% Owner occupied75 17.4% Renter occupiedHouse owners and renters - Black or African American residents 3,214 56.5% Owner occupied2,479 43.5% Renter occupiedHouse owners and renters - American Indian / Alaska Native residents 107 100.0% Owner occupiedHouse owners and renters - Asian residents 280 79.5% Owner occupied72 20.5% Renter occupiedHouse owners and renters - Other race residents 512 74.5% Owner occupied175 25.5% Renter occupiedHouse owners and renters - Two or more races residents 53 21.7% Owner occupied190 78.3% Renter occupiedHouse owners and renters - White alone residents 283 78.7% Owner occupied76 21.3% Renter occupiedHouse owners and renters - Hispanic or Latino residents 661 74.6% Owner occupied225 25.4% Renter occupied
Language usage in Oxon Hill
English speakers - Total 73.8% of residents of Oxon Hill speak English at home.
19.0% of residents speak Spanish at home 1,080 33.4% Speak English very well2,151 66.6% Speak English less than very well6.1% of residents speak other language at home 731 70.8% Speak English very well302 29.2% Speak English less than very well
English speakers - Born in the United States 91.3% of residents of Oxon Hill speak English at home.
7.7% of residents speak Spanish at home 586 77.6% Speak English very well169 22.4% Speak English less than very well0.2% of residents speak other language at home 12 52.2% Speak English very well11 47.8% Speak English less than very well
English speakers - Native, born elsewhere 81.9% of residents of Oxon Hill speak English at home.
9.0% of residents speak Spanish at home 16 100.0% Speak English very well3.4% of residents speak other language at home 6 100.0% Speak English very well
English speakers - Foreign-born 14.4% of residents of Oxon Hill speak English at home.
57.1% of residents speak Spanish at home 406 19.8% Speak English very well1,648 80.2% Speak English less than very well27.5% of residents speak other language at home 702 70.9% Speak English very well288 29.1% Speak English less than very well
White (Caucasian) - Speak only English Native:
83.4% (658)Foreign-born:
6.0% (10)
White (Caucasian) - Speak another language Native:
15.9% (126)Foreign-born:
87.0% (144)
Black or African American - Speak only English Native:
99.0% (10,783)Foreign-born:
56.5% (413)
Black or African American - Speak another language Native:
0.5% (57)Foreign-born:
41.1% (301)
American Indian / Alaska Native - Speak only English Native:
28.5% (17)Foreign-born:
13.1% (75)
American Indian / Alaska Native - Speak another language Native:
78.6% (47)Foreign-born:
86.9% (498)
Asian - Speak only English Native:
44.3% (14)Foreign-born:
2.3% (14)
Asian - Speak another language Native:
53.2% (16)Foreign-born:
95.3% (575)
Other race - Speak only English Native:
8.6% (85)Foreign-born:
1.9% (30)
Other race - Speak another language Native:
90.2% (893)Foreign-born:
98.3% (1,564)
Two or more races - Speak only English Native:
79.2% (365)Foreign-born:
15.6% (9)
Two or more races - Speak another language Native:
20.6% (95)Foreign-born:
85.8% (48)
Hispanic or Latino - Speak only English Native:
15.9% (211)Foreign-born:
1.9% (39)
Hispanic or Latino - Speak another language Native:
83.5% (1,107)Foreign-born:
98.5% (2,058)
Foreign-born residents in Oxon Hill
Marital status for residents in Oxon Hill Marital status - White (Caucasian) population 15 years and over
Males 40.3% Never married40.0% Now married4.4% Separated7.4% Widowed7.9% DivorcedFemales 41.9% Never married42.1% Now married0.0% Separated6.0% Widowed9.9% DivorcedWomen who gave birth in the past 12 months Now married:
100.0% (4)Unmarried:
0.0% (0)
Women who did not give birth in the past 12 months Now married:
45.0% (97)Unmarried:
55.0% (119)
Marital status - Black or African American population 15 years and over
Males 41.4% Never married43.5% Now married1.3% Separated2.7% Widowed11.0% DivorcedFemales 40.3% Never married29.6% Now married4.7% Separated10.0% Widowed15.3% DivorcedWomen who gave birth in the past 12 months Now married:
83.3% (197)Unmarried:
16.7% (39)
Women who did not give birth in the past 12 months Now married:
20.1% (556)Unmarried:
79.9% (2,203)
Marital status - American Indian / Alaska Native population 15 years and over
Males 13.2% Never married57.1% Now married0.0% Separated0.0% Widowed29.6% DivorcedFemales 0.0% Never married100.0% Now married0.0% Separated0.0% Widowed0.0% DivorcedWomen who did not give birth in the past 12 months Now married:
100.0% (51)Unmarried:
0.0% (0)
Marital status - Asian population 15 years and over
Males 19.2% Never married63.1% Now married8.8% Separated3.2% Widowed5.7% DivorcedFemales 28.7% Never married46.2% Now married7.6% Separated17.5% Widowed0.0% DivorcedWomen who did not give birth in the past 12 months Now married:
90.5% (72)Unmarried:
9.5% (8)
Marital status - Other race population 15 years and over
Males 41.5% Never married57.0% Now married1.6% Separated0.0% Widowed0.0% DivorcedFemales 33.0% Never married57.4% Now married3.1% Separated1.8% Widowed4.7% DivorcedWomen who gave birth in the past 12 months Now married:
0.0% (0)Unmarried:
100.0% (8)
Women who did not give birth in the past 12 months Now married:
56.9% (374)Unmarried:
43.1% (283)
Marital status - Two or more races population 15 years and over
Males 46.7% Never married48.5% Now married0.0% Separated0.0% Widowed4.7% DivorcedFemales 64.4% Never married30.1% Now married0.0% Separated3.7% Widowed1.9% DivorcedWomen who gave birth in the past 12 months Now married:
0.0% (0)Unmarried:
100.0% (17)
Women who did not give birth in the past 12 months Now married:
31.8% (60)Unmarried:
68.2% (128)
Marital status - White alone, not Hispanic / Latino population 15 years and over
Males 43.8% Never married28.8% Now married6.8% Separated11.3% Widowed9.3% DivorcedFemales 46.9% Never married29.7% Now married0.0% Separated8.7% Widowed14.6% DivorcedWomen who gave birth in the past 12 months Now married:
100.0% (5)Unmarried:
0.0% (0)
Women who did not give birth in the past 12 months Now married:
3.3% (3)Unmarried:
96.7% (84)
Marital status - Hispanic or Latino population 15 years and over
Males 37.7% Never married57.1% Now married1.1% Separated0.0% Widowed4.1% DivorcedFemales 30.4% Never married64.4% Now married1.4% Separated1.3% Widowed2.5% DivorcedWomen who gave birth in the past 12 months Now married:
0.0% (0)Unmarried:
100.0% (16)
Women who did not give birth in the past 12 months Now married:
62.7% (527)Unmarried:
37.3% (314)
Ancestries in Oxon Hill
406 2.8% American229 1.6% Jamaican122 0.9% Ghanaian102 0.7% Polish92 0.6% Bahamian82 0.6% African61 0.4% Irish58 0.4% Moroccan55 0.4% Ethiopian43 0.3% Scottish40 0.3% Nigerian29 0.2% Trinidadian and Tobagonian24 0.2% English24 0.2% Guyanese20 0.1% Danish16 0.1% Haitian14 0.10% Liberian10 0.07% German9 0.06% Italian9 0.06% Turkish6 0.04% Cape Verdean6 0.04% Yugoslavian
Children Nativity (place of birth) in Oxon Hill
Children under 6 years - Living with two parents Both parents native 443 100.0% NativeBoth parents foreign-born 188 93.0% Native14 7.0% Foreign-bornOne native, one foreign-born parent 117 100.0% NativeChildren under 6 years - Living with one parent Native parent 383 100.0% NativeForeign-born parent 79 100.0% NativeChildren 6 to 17 years - Living with two parents Both parents native 387 99.8% Native1 0.2% Foreign-bornBoth parents foreign-born 432 68.6% Native197 31.4% Foreign-bornOne native, one foreign-born parent 17 100.0% NativeChildren 6 to 17 years - Living with one parent Native parent 460 100.0% NativeForeign-born parent 136 59.6% Native92 40.4% Foreign-born
Grandparents responsible for own grandchildren in Oxon Hill
Grandparents (30 to 59 years) White / Caucasian 32 100.0% Not responsible for grandchildrenBlack or African American 25 53.5% Responsible for grandchildren22 46.5% Not responsible for grandchildrenAmerican Indian / Alaska Native 42 100.0% Not responsible for grandchildrenOther race 69 100.0% Not responsible for grandchildrenTwo or more races 41 100.0% Not responsible for grandchildrenHispanic or Latino 150 100.0% Not responsible for grandchildrenGrandparents (60 years and over) Black or African American 14 8.1% Responsible for grandchildren158 91.9% Not responsible for grandchildrenAmerican Indian / Alaska Native 47 100.0% Not responsible for grandchildrenOther race 125 100.0% Not responsible for grandchildrenHispanic or Latino 197 100.0% Not responsible for grandchildren