Races in Ocean Pointe, Hawaii (HI) Detailed Stats
Data:
Races - White alone (%)
Races - White alone (% change since 2000)
Races - Black alone (%)
Races - Black alone (% change since 2000)
Races - American Indian alone (%)
Races - American Indian alone (% change since 2000)
Races - Asian alone (%)
Races - Asian alone (% change since 2000)
Races - Hispanic (%)
Races - Hispanic (% change since 2000)
Races - Native Hawaiian and Other Pacific Islander alone (%)
Races - Native Hawaiian and Other Pacific Islander alone (% change since 2000)
Races - Two or more races(%)
Races - Two or more races(% change since 2000)
Races - Other race alone (%)
Races - Other race alone (% change since 2000)
Racial diversity
Place of birth - Born in state of residence (%)
Place of birth - Born in state of residence (%) - White
Place of birth - Born in state of residence (%) - Black or African American
Place of birth - Born in state of residence (%) - Asian
Place of birth - Born in state of residence (%) - Hispanic or Latino
Place of birth - Born in state of residence (%) - American Indian and Alaska Native
Place of birth - Born in state of residence (%) - Multirace
Place of birth - Born in state of residence (%) - Other Race
Place of birth - Born in other state (%)
Place of birth - Born in other state (%) - White
Place of birth - Born in other state (%) - Black or African American
Place of birth - Born in other state (%) - Asian
Place of birth - Born in other state (%) - Hispanic or Latino
Place of birth - Born in other state (%) - American Indian and Alaska Native
Place of birth - Born in other state (%) - Multirace
Place of birth - Born in other state (%) - Other Race
Place of birth - Native, outside of US (%)
Place of birth - Native, outside of US (%) - White
Place of birth - Native, outside of US (%) - Black or African American
Place of birth - Native, outside of US (%) - Asian
Place of birth - Native, outside of US (%) - Hispanic or Latino
Place of birth - Native, outside of US (%) - American Indian and Alaska Native
Place of birth - Native, outside of US (%) - Multirace
Place of birth - Native, outside of US (%) - Other Race
Place of birth - Foreign born (%)
Place of birth - Foreign born (%) - White
Place of birth - Foreign born (%) - Black or African American
Place of birth - Foreign born (%) - Asian
Place of birth - Foreign born (%) - Hispanic or Latino
Place of birth - Foreign born (%) - American Indian and Alaska Native
Place of birth - Foreign born (%) - Multirace
Place of birth - Foreign born (%) - Other Race
Residents speaking English at home (%)
Residents speaking English at home - Born in the United States (%)
Residents speaking English at home - Native, born elsewhere (%)
Residents speaking English at home - Foreign born (%)
Residents speaking Spanish at home (%)
Residents speaking Spanish at home - Born in the United States (%)
Residents speaking Spanish at home - Native, born elsewhere (%)
Residents speaking Spanish at home - Foreign born (%)
Residents speaking other language at home (%)
Residents speaking other language at home - Born in the United States (%)
Residents speaking other language at home - Native, born elsewhere (%)
Residents speaking other language at home - Foreign born (%)
Marital status - Never married (%)
Marital status - Now married (%)
Marital status - Separated (%)
Marital status - Widowed (%)
Marital status - Divorced (%)
Ancestries Reported - Arab (%)
Ancestries Reported - Czech (%)
Ancestries Reported - Danish (%)
Ancestries Reported - Dutch (%)
Ancestries Reported - English (%)
Ancestries Reported - French (%)
Ancestries Reported - French Canadian (%)
Ancestries Reported - German (%)
Ancestries Reported - Greek (%)
Ancestries Reported - Hungarian (%)
Ancestries Reported - Irish (%)
Ancestries Reported - Italian (%)
Ancestries Reported - Lithuanian (%)
Ancestries Reported - Norwegian (%)
Ancestries Reported - Polish (%)
Ancestries Reported - Portuguese (%)
Ancestries Reported - Russian (%)
Ancestries Reported - Scotch-Irish (%)
Ancestries Reported - Scottish (%)
Ancestries Reported - Slovak (%)
Ancestries Reported - Subsaharan African (%)
Ancestries Reported - Swedish (%)
Ancestries Reported - Swiss (%)
Ancestries Reported - Ukrainian (%)
Ancestries Reported - United States (%)
Ancestries Reported - Welsh (%)
Ancestries Reported - West Indian (%)
Ancestries Reported - Other (%)
Geographical mobility - Same house 1 year ago (%)
Geographical mobility - Same house 1 year ago (%) - White
Geographical mobility - Same house 1 year ago (%) - Black or African American
Geographical mobility - Same house 1 year ago (%) - Asian
Geographical mobility - Same house 1 year ago (%) - Hispanic or Latino
Geographical mobility - Same house 1 year ago (%) - American Indian and Alaska Native
Geographical mobility - Same house 1 year ago (%) - Multirace
Geographical mobility - Same house 1 year ago (%) - Other Race
Geographical mobility - Moved within same county (%)
Geographical mobility - Moved within same county (%) - White
Geographical mobility - Moved within same county (%) - Black or African American
Geographical mobility - Moved within same county (%) - Asian
Geographical mobility - Moved within same county (%) - Hispanic or Latino
Geographical mobility - Moved within same county (%) - American Indian and Alaska Native
Geographical mobility - Moved within same county (%) - Multirace
Geographical mobility - Moved within same county (%) - Other Race
Geographical mobility - Moved from different county within same state (%)
Geographical mobility - Moved from different county within same state (%) - White
Geographical mobility - Moved from different county within same state (%) - Black or African American
Geographical mobility - Moved from different county within same state (%) - Asian
Geographical mobility - Moved from different county within same state (%) - Hispanic or Latino
Geographical mobility - Moved from different county within same state (%) - American Indian and Alaska Native
Geographical mobility - Moved from different county within same state (%) - Multirace
Geographical mobility - Moved from different county within same state (%) - Other Race
Geographical mobility - Moved from different state (%)
Geographical mobility - Moved from different state (%) - White
Geographical mobility - Moved from different state (%) - Black or African American
Geographical mobility - Moved from different state (%) - Asian
Geographical mobility - Moved from different state (%) - Hispanic or Latino
Geographical mobility - Moved from different state (%) - American Indian and Alaska Native
Geographical mobility - Moved from different state (%) - Multirace
Geographical mobility - Moved from different state (%) - Other Race
Geographical mobility - Moved from abroad (%)
Geographical mobility - Moved from abroad (%) - White
Geographical mobility - Moved from abroad (%) - Black or African American
Geographical mobility - Moved from abroad (%) - Asian
Geographical mobility - Moved from abroad (%) - Hispanic or Latino
Geographical mobility - Moved from abroad (%) - American Indian and Alaska Native
Geographical mobility - Moved from abroad (%) - Multirace
Geographical mobility - Moved from abroad (%) - Other Race
Place of birth for the foreign-born population - Ireland (%)
Place of birth for the foreign-born population - Denmark (%)
Place of birth for the foreign-born population - Norway (%)
Place of birth for the foreign-born population - Sweden (%)
Place of birth for the foreign-born population - United Kingdom (%)
Place of birth for the foreign-born population - England (%)
Place of birth for the foreign-born population - Scotland (%)
Place of birth for the foreign-born population - Other Northern Europe (%)
Place of birth for the foreign-born population - Austria (%)
Place of birth for the foreign-born population - Belgium (%)
Place of birth for the foreign-born population - France (%)
Place of birth for the foreign-born population - Germany (%)
Place of birth for the foreign-born population - Netherlands (%)
Place of birth for the foreign-born population - Switzerland (%)
Place of birth for the foreign-born population - Other Western Europe (%)
Place of birth for the foreign-born population - Greece (%)
Place of birth for the foreign-born population - Italy (%)
Place of birth for the foreign-born population - Portugal (%)
Place of birth for the foreign-born population - Spain (%)
Place of birth for the foreign-born population - Other Southern Europe (%)
Place of birth for the foreign-born population - Albania (%)
Place of birth for the foreign-born population - Belarus (%)
Place of birth for the foreign-born population - Bosnia and Herzegovina (%)
Place of birth for the foreign-born population - Bulgaria (%)
Place of birth for the foreign-born population - Croatia (%)
Place of birth for the foreign-born population - Czechoslovakia (%)
Place of birth for the foreign-born population - Hungary (%)
Place of birth for the foreign-born population - Latvia (%)
Place of birth for the foreign-born population - Lithuania (%)
Place of birth for the foreign-born population - North Macedonia (Macedonia) (%)
Place of birth for the foreign-born population - Moldova (%)
Place of birth for the foreign-born population - Poland (%)
Place of birth for the foreign-born population - Romania (%)
Place of birth for the foreign-born population - Russia (%)
Place of birth for the foreign-born population - Serbia (%)
Place of birth for the foreign-born population - Ukraine (%)
Place of birth for the foreign-born population - Other Eastern Europe (%)
Place of birth for the foreign-born population - China (%)
Place of birth for the foreign-born population - Hong Kong (%)
Place of birth for the foreign-born population - Taiwan (%)
Place of birth for the foreign-born population - Japan (%)
Place of birth for the foreign-born population - Korea (%)
Place of birth for the foreign-born population - Other Eastern Asia (%)
Place of birth for the foreign-born population - Afghanistan (%)
Place of birth for the foreign-born population - Bangladesh (%)
Place of birth for the foreign-born population - India (%)
Place of birth for the foreign-born population - Iran (%)
Place of birth for the foreign-born population - Kazakhstan (%)
Place of birth for the foreign-born population - Nepal (%)
Place of birth for the foreign-born population - Pakistan (%)
Place of birth for the foreign-born population - Sri Lanka (%)
Place of birth for the foreign-born population - Uzbekistan (%)
Place of birth for the foreign-born population - Other South Central Asia (%)
Place of birth for the foreign-born population - Burma (%)
Place of birth for the foreign-born population - Cambodia (%)
Place of birth for the foreign-born population - Indonesia (%)
Place of birth for the foreign-born population - Laos (%)
Place of birth for the foreign-born population - Malaysia (%)
Place of birth for the foreign-born population - Philippines (%)
Place of birth for the foreign-born population - Singapore (%)
Place of birth for the foreign-born population - Thailand (%)
Place of birth for the foreign-born population - Vietnam (%)
Place of birth for the foreign-born population - Other South Eastern Asia (%)
Place of birth for the foreign-born population - Armenia (%)
Place of birth for the foreign-born population - Iraq (%)
Place of birth for the foreign-born population - Israel (%)
Place of birth for the foreign-born population - Jordan (%)
Place of birth for the foreign-born population - Kuwait (%)
Place of birth for the foreign-born population - Lebanon (%)
Place of birth for the foreign-born population - Saudi Arabia (%)
Place of birth for the foreign-born population - Syria (%)
Place of birth for the foreign-born population - Turkey (%)
Place of birth for the foreign-born population - Yemen (%)
Place of birth for the foreign-born population - Other Western Asia (%)
Place of birth for the foreign-born population - Eritrea (%)
Place of birth for the foreign-born population - Ethiopia (%)
Place of birth for the foreign-born population - Kenya (%)
Place of birth for the foreign-born population - Somalia (%)
Place of birth for the foreign-born population - Uganda (%)
Place of birth for the foreign-born population - Zimbabwe (%)
Place of birth for the foreign-born population - Other Eastern Africa (%)
Place of birth for the foreign-born population - Cameroon (%)
Place of birth for the foreign-born population - Congo (%)
Place of birth for the foreign-born population - Democratic Republic of Congo (Zaire) (%)
Place of birth for the foreign-born population - Other Middle Africa (%)
Place of birth for the foreign-born population - Egypt (%)
Place of birth for the foreign-born population - Morocco (%)
Place of birth for the foreign-born population - Sudan (%)
Place of birth for the foreign-born population - Other Northern Africa (%)
Place of birth for the foreign-born population - South Africa (%)
Place of birth for the foreign-born population - Other Southern Africa (%)
Place of birth for the foreign-born population - Cabo Verde (%)
Place of birth for the foreign-born population - Ghana (%)
Place of birth for the foreign-born population - Liberia (%)
Place of birth for the foreign-born population - Nigeria (%)
Place of birth for the foreign-born population - Senegal (%)
Place of birth for the foreign-born population - Sierra Leone (%)
Place of birth for the foreign-born population - Other Western Africa (%)
Place of birth for the foreign-born population - Australia (%)
Place of birth for the foreign-born population - New Zealand (%)
Place of birth for the foreign-born population - Fiji (%)
Place of birth for the foreign-born population - Micronesia (%)
Place of birth for the foreign-born population - Bahamas (%)
Place of birth for the foreign-born population - Barbados (%)
Place of birth for the foreign-born population - Cuba (%)
Place of birth for the foreign-born population - Dominica (%)
Place of birth for the foreign-born population - Dominican Republic (%)
Place of birth for the foreign-born population - Grenada (%)
Place of birth for the foreign-born population - Haiti (%)
Place of birth for the foreign-born population - Jamaica (%)
Place of birth for the foreign-born population - St. Vincent and the Grenadines (%)
Place of birth for the foreign-born population - Trinidad and Tobago (%)
Place of birth for the foreign-born population - West Indies (%)
Place of birth for the foreign-born population - Other Caribbean (%)
Place of birth for the foreign-born population - Belize (%)
Place of birth for the foreign-born population - Costa Rica (%)
Place of birth for the foreign-born population - El Salvador (%)
Place of birth for the foreign-born population - Guatemala (%)
Place of birth for the foreign-born population - Honduras (%)
Place of birth for the foreign-born population - Mexico (%)
Place of birth for the foreign-born population - Nicaragua (%)
Place of birth for the foreign-born population - Panama (%)
Place of birth for the foreign-born population - Other Central America (%)
Place of birth for the foreign-born population - Argentina (%)
Place of birth for the foreign-born population - Bolivia (%)
Place of birth for the foreign-born population - Brazil (%)
Place of birth for the foreign-born population - Chile (%)
Place of birth for the foreign-born population - Colombia (%)
Place of birth for the foreign-born population - Ecuador (%)
Place of birth for the foreign-born population - Guyana (%)
Place of birth for the foreign-born population - Peru (%)
Place of birth for the foreign-born population - Uruguay (%)
Place of birth for the foreign-born population - Venezuela (%)
Place of birth for the foreign-born population - Other South America (%)
Place of birth for the foreign-born population - Canada (%)
Place of birth for the foreign-born population - Other Northern America (%)
Place of birth for the foreign-born population - Other (%)
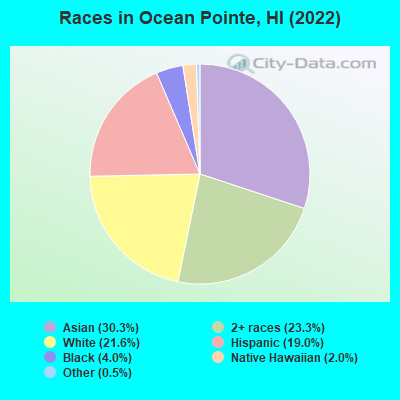
According to 2022 data, the most numerous races in Ocean Pointe, HI are Asian alone (4,825 residents), Two or more races (3,707 residents), and White alone (3,437 residents). 80.3% of Ocean Pointe residents speak English at home.
Race distribution in Ocean Pointe 4,825 30.3% Asian alone 3,707 23.3% Two or more races 3,437 21.6% White alone 3,024 19.0% Hispanic 644 4.0% Black alone 317 2.0% Native Hawaiian and Other 80 0.5% Other race alone
2000 2022
494,149 40.8% Asian alone 277,091 22.9% White alone 218,700 18.1% Two or more races 108,441 9.0% Native Hawaiian and Other 87,699 7.2% Hispanic 20,829 1.7% Black alone 2,089 0.2% Other race alone 2,539 0.2% American Indian alone
498,125 34.6% Asian alone 318,574 22.1% Two or more races 297,937 20.7% White alone 160,103 11.1% Hispanic 134,567 9.3% Native Hawaiian and Other 23,682 1.6% Black alone 5,378 0.4% Other race alone 1,830 0.1% American Indian alone
Income and house value in Ocean Pointe Median household income in 2022 $140,227 White non-Hispanic householders$116,084 Black householders$120,406 Asian householders$111,659 Native Hawaiian and other Pacific Islander householders$140,615 Two or more races householders$120,851 Hispanic or Latino race householders
Median age by race in Ocean Pointe
36.9 Median age for White residents37.1 33.8 32.8 Median age for Black or African American residents32.9 56.6 51.7 Median age for American Indian / Alaska Native residents-715,953,306.7 -629,508,196.1 37.2 Median age for Asian residents34.8 39.2 37.9 Median age for Native Hawaiian / Pacific Islander residents37.3 38.3 27.4 Median age for Other race residents26.8 30.6 16.2 Median age for Two or more races residents14.9 16.8 38.8 Median age for White alone residents38.9 38.0 20.5 Median age for Hispanic or Latino residents13.4 29.9
Owner/renter occupied households by race in Ocean Pointe
House owners and renters - White residents 1,121 66.8% Owner occupied557 33.2% Renter occupiedHouse owners and renters - Black or African American residents 259 67.6% Owner occupied124 32.4% Renter occupiedHouse owners and renters - American Indian / Alaska Native residents 22 100.0% Owner occupiedHouse owners and renters - Asian residents 1,466 81.8% Owner occupied327 18.2% Renter occupiedHouse owners and renters - Native Hawaiian / Pacific Islander residents 95 100.0% Owner occupiedHouse owners and renters - Other race residents 121 85.6% Owner occupied20 14.4% Renter occupiedHouse owners and renters - Two or more races residents 828 81.9% Owner occupied183 18.1% Renter occupiedHouse owners and renters - White alone residents 1,026 66.9% Owner occupied508 33.1% Renter occupiedHouse owners and renters - Hispanic or Latino residents 467 61.8% Owner occupied288 38.2% Renter occupied
Language usage in Ocean Pointe
English speakers - Total 80.3% of residents of Ocean Pointe speak English at home.
3.7% of residents speak Spanish at home 507 93.9% Speak English very well33 6.1% Speak English less than very well16.4% of residents speak other language at home 1,753 73.5% Speak English very well632 26.5% Speak English less than very well
English speakers - Born in the United States 92.0% of residents of Ocean Pointe speak English at home.
5.0% of residents speak Spanish at home 321 100.0% Speak English very well3.2% of residents speak other language at home 191 91.8% Speak English very well17 8.2% Speak English less than very well
English speakers - Native, born elsewhere 68.0% of residents of Ocean Pointe speak English at home.
7.7% of residents speak Spanish at home 46 76.7% Speak English very well14 23.3% Speak English less than very well24.5% of residents speak other language at home 183 96.3% Speak English very well7 3.7% Speak English less than very well
English speakers - Foreign-born 31.7% of residents of Ocean Pointe speak English at home.
4.4% of residents speak Spanish at home 89 85.6% Speak English very well15 14.4% Speak English less than very well63.4% of residents speak other language at home 916 61.4% Speak English very well577 38.6% Speak English less than very well
White (Caucasian) - Speak only English Native:
95.3% (3,556)Foreign-born:
54.2% (101)
White (Caucasian) - Speak another language Native:
4.8% (180)Foreign-born:
45.8% (85)
Black or African American - Speak only English Native:
91.6% (652)Foreign-born:
100.0% (35)
Asian - Speak only English Native:
86.1% (2,421)Foreign-born:
25.6% (460)
Asian - Speak another language Native:
13.9% (391)Foreign-born:
74.3% (1,332)
Native Hawaiian / Pacific Islander - Speak another language Native:
19.7% (56)Foreign-born:
100.0% (58)
Other race - Speak only English Native:
73.1% (238)Foreign-born:
26.7% (24)
Other race - Speak another language Native:
27.6% (90)Foreign-born:
75.1% (68)
Two or more races - Speak only English Native:
88.4% (3,854)Foreign-born:
56.6% (103)
Two or more races - Speak another language Native:
11.6% (506)Foreign-born:
44.1% (80)
White alone - Speak only English Native:
98.7% (2,928)Foreign-born:
64.2% (102)
White alone - Speak another language Native:
1.6% (47)Foreign-born:
35.9% (57)
Hispanic or Latino - Speak only English Native:
85.2% (2,117)Foreign-born:
47.3% (100)
Hispanic or Latino - Speak another language Native:
15.0% (372)Foreign-born:
58.4% (123)
Foreign-born residents in Ocean Pointe
Marital status for residents in Ocean Pointe Marital status - White (Caucasian) population 15 years and over
Males 16.4% Never married80.6% Now married0.4% Separated0.4% Widowed2.3% DivorcedFemales 12.3% Never married72.5% Now married0.0% Separated5.6% Widowed9.6% DivorcedWomen who gave birth in the past 12 months Now married:
100.0% (44)Unmarried:
0.0% (0)
Women who did not give birth in the past 12 months Now married:
74.2% (708)Unmarried:
25.8% (246)
Marital status - Black or African American population 15 years and over
Males 4.8% Never married66.9% Now married18.4% Separated0.0% Widowed10.0% DivorcedFemales 8.2% Never married45.6% Now married0.0% Separated30.5% Widowed15.7% DivorcedWomen who did not give birth in the past 12 months Now married:
53.2% (72)Unmarried:
46.8% (63)
Marital status - American Indian / Alaska Native population 15 years and over
Males 0.0% Never married100.0% Now married0.0% Separated0.0% Widowed0.0% DivorcedFemales 0.0% Never married100.0% Now married0.0% Separated0.0% Widowed0.0% DivorcedWomen who did not give birth in the past 12 months Now married:
100.0% (38)Unmarried:
0.0% (0)
Marital status - Asian population 15 years and over
Males 30.2% Never married66.6% Now married0.0% Separated1.3% Widowed1.9% DivorcedFemales 15.7% Never married74.7% Now married1.3% Separated2.6% Widowed5.8% DivorcedWomen who gave birth in the past 12 months Now married:
74.4% (122)Unmarried:
25.6% (42)
Women who did not give birth in the past 12 months Now married:
74.4% (1,087)Unmarried:
25.6% (375)
Marital status - Native Hawaiian / Pacific Islander population 15 years and over
Males 7.6% Never married51.0% Now married15.9% Separated9.7% Widowed15.9% DivorcedFemales 40.6% Never married34.1% Now married0.0% Separated25.4% Widowed0.0% DivorcedWomen who gave birth in the past 12 months Now married:
0.0% (0)Unmarried:
100.0% (4)
Women who did not give birth in the past 12 months Now married:
53.4% (42)Unmarried:
46.6% (36)
Marital status - Other race population 15 years and over
Males 31.5% Never married68.5% Now married0.0% Separated0.0% Widowed0.0% DivorcedFemales 22.7% Never married74.7% Now married0.0% Separated2.5% Widowed0.0% DivorcedWomen who did not give birth in the past 12 months Now married:
74.3% (162)Unmarried:
25.7% (56)
Marital status - Two or more races population 15 years and over
Males 46.9% Never married44.7% Now married0.0% Separated0.0% Widowed8.4% DivorcedFemales 35.7% Never married46.3% Now married0.4% Separated2.2% Widowed15.4% DivorcedWomen who gave birth in the past 12 months Now married:
62.7% (73)Unmarried:
37.3% (44)
Women who did not give birth in the past 12 months Now married:
47.6% (462)Unmarried:
52.4% (508)
Marital status - White alone, not Hispanic / Latino population 15 years and over
Males 12.9% Never married83.6% Now married0.5% Separated0.5% Widowed2.6% DivorcedFemales 14.4% Never married67.8% Now married0.0% Separated6.6% Widowed11.2% DivorcedWomen who gave birth in the past 12 months Now married:
100.0% (45)Unmarried:
0.0% (0)
Women who did not give birth in the past 12 months Now married:
68.2% (542)Unmarried:
31.8% (253)
Marital status - Hispanic or Latino population 15 years and over
Males 40.8% Never married55.8% Now married0.0% Separated0.0% Widowed3.4% DivorcedFemales 17.7% Never married60.4% Now married0.5% Separated1.4% Widowed20.0% DivorcedWomen who gave birth in the past 12 months Now married:
100.0% (29)Unmarried:
0.0% (0)
Women who did not give birth in the past 12 months Now married:
64.8% (490)Unmarried:
35.2% (267)
Ancestries in Ocean Pointe
578 7.5% German283 3.7% Irish203 2.6% Italian183 2.4% American69 0.9% Scottish67 0.9% English37 0.5% European35 0.5% Turkish28 0.4% Portuguese23 0.3% British West Indian19 0.2% Canadian18 0.2% Dutch13 0.2% Brazilian13 0.2% Swedish9 0.1% Scotch-Irish7 0.09% French7 0.09% Polish4 0.05% French Canadian
Children Nativity (place of birth) in Ocean Pointe
Children under 6 years - Living with two parents Both parents native 970 99.8% Native1 0.2% Foreign-bornBoth parents foreign-born 130 94.8% Native7 5.2% Foreign-bornOne native, one foreign-born parent 209 100.0% NativeChildren under 6 years - Living with one parent Native parent 196 100.0% NativeForeign-born parent 40 100.0% NativeChildren 6 to 17 years - Living with two parents Both parents native 2,025 99.2% Native16 0.8% Foreign-bornBoth parents foreign-born 163 77.5% Native47 22.5% Foreign-bornOne native, one foreign-born parent 540 100.0% NativeChildren 6 to 17 years - Living with one parent Native parent 333 100.0% NativeForeign-born parent 149 45.6% Native177 54.4% Foreign-born
Grandparents responsible for own grandchildren in Ocean Pointe
Grandparents (30 to 59 years) White / Caucasian 29 100.0% Not responsible for grandchildrenAsian 29 100.0% Not responsible for grandchildrenTwo or more races 34 76.7% Responsible for grandchildren10 23.3% Not responsible for grandchildrenWhite alone, not Hispanic / Latino 32 100.0% Not responsible for grandchildrenHispanic or Latino 71 100.0% Responsible for grandchildrenGrandparents (60 years and over) White / Caucasian 1 100.0% Responsible for grandchildrenAsian 3 5.0% Responsible for grandchildren51 95.0% Not responsible for grandchildrenTwo or more races 42 45.1% Responsible for grandchildren51 54.9% Not responsible for grandchildrenWhite alone, not Hispanic / Latino 1 100.0% Responsible for grandchildrenHispanic or Latino 11 100.0% Responsible for grandchildren