Races in Oakdale, Minnesota (MN) Detailed Stats
Data:
Races - White alone (%)
Races - White alone (% change since 2000)
Races - Black alone (%)
Races - Black alone (% change since 2000)
Races - American Indian alone (%)
Races - American Indian alone (% change since 2000)
Races - Asian alone (%)
Races - Asian alone (% change since 2000)
Races - Hispanic (%)
Races - Hispanic (% change since 2000)
Races - Native Hawaiian and Other Pacific Islander alone (%)
Races - Native Hawaiian and Other Pacific Islander alone (% change since 2000)
Races - Two or more races(%)
Races - Two or more races(% change since 2000)
Races - Other race alone (%)
Races - Other race alone (% change since 2000)
Racial diversity
Place of birth - Born in state of residence (%)
Place of birth - Born in state of residence (%) - White
Place of birth - Born in state of residence (%) - Black or African American
Place of birth - Born in state of residence (%) - Asian
Place of birth - Born in state of residence (%) - Hispanic or Latino
Place of birth - Born in state of residence (%) - American Indian and Alaska Native
Place of birth - Born in state of residence (%) - Multirace
Place of birth - Born in state of residence (%) - Other Race
Place of birth - Born in other state (%)
Place of birth - Born in other state (%) - White
Place of birth - Born in other state (%) - Black or African American
Place of birth - Born in other state (%) - Asian
Place of birth - Born in other state (%) - Hispanic or Latino
Place of birth - Born in other state (%) - American Indian and Alaska Native
Place of birth - Born in other state (%) - Multirace
Place of birth - Born in other state (%) - Other Race
Place of birth - Native, outside of US (%)
Place of birth - Native, outside of US (%) - White
Place of birth - Native, outside of US (%) - Black or African American
Place of birth - Native, outside of US (%) - Asian
Place of birth - Native, outside of US (%) - Hispanic or Latino
Place of birth - Native, outside of US (%) - American Indian and Alaska Native
Place of birth - Native, outside of US (%) - Multirace
Place of birth - Native, outside of US (%) - Other Race
Place of birth - Foreign born (%)
Place of birth - Foreign born (%) - White
Place of birth - Foreign born (%) - Black or African American
Place of birth - Foreign born (%) - Asian
Place of birth - Foreign born (%) - Hispanic or Latino
Place of birth - Foreign born (%) - American Indian and Alaska Native
Place of birth - Foreign born (%) - Multirace
Place of birth - Foreign born (%) - Other Race
Residents speaking English at home (%)
Residents speaking English at home - Born in the United States (%)
Residents speaking English at home - Native, born elsewhere (%)
Residents speaking English at home - Foreign born (%)
Residents speaking Spanish at home (%)
Residents speaking Spanish at home - Born in the United States (%)
Residents speaking Spanish at home - Native, born elsewhere (%)
Residents speaking Spanish at home - Foreign born (%)
Residents speaking other language at home (%)
Residents speaking other language at home - Born in the United States (%)
Residents speaking other language at home - Native, born elsewhere (%)
Residents speaking other language at home - Foreign born (%)
Marital status - Never married (%)
Marital status - Now married (%)
Marital status - Separated (%)
Marital status - Widowed (%)
Marital status - Divorced (%)
Ancestries Reported - Arab (%)
Ancestries Reported - Czech (%)
Ancestries Reported - Danish (%)
Ancestries Reported - Dutch (%)
Ancestries Reported - English (%)
Ancestries Reported - French (%)
Ancestries Reported - French Canadian (%)
Ancestries Reported - German (%)
Ancestries Reported - Greek (%)
Ancestries Reported - Hungarian (%)
Ancestries Reported - Irish (%)
Ancestries Reported - Italian (%)
Ancestries Reported - Lithuanian (%)
Ancestries Reported - Norwegian (%)
Ancestries Reported - Polish (%)
Ancestries Reported - Portuguese (%)
Ancestries Reported - Russian (%)
Ancestries Reported - Scotch-Irish (%)
Ancestries Reported - Scottish (%)
Ancestries Reported - Slovak (%)
Ancestries Reported - Subsaharan African (%)
Ancestries Reported - Swedish (%)
Ancestries Reported - Swiss (%)
Ancestries Reported - Ukrainian (%)
Ancestries Reported - United States (%)
Ancestries Reported - Welsh (%)
Ancestries Reported - West Indian (%)
Ancestries Reported - Other (%)
Geographical mobility - Same house 1 year ago (%)
Geographical mobility - Same house 1 year ago (%) - White
Geographical mobility - Same house 1 year ago (%) - Black or African American
Geographical mobility - Same house 1 year ago (%) - Asian
Geographical mobility - Same house 1 year ago (%) - Hispanic or Latino
Geographical mobility - Same house 1 year ago (%) - American Indian and Alaska Native
Geographical mobility - Same house 1 year ago (%) - Multirace
Geographical mobility - Same house 1 year ago (%) - Other Race
Geographical mobility - Moved within same county (%)
Geographical mobility - Moved within same county (%) - White
Geographical mobility - Moved within same county (%) - Black or African American
Geographical mobility - Moved within same county (%) - Asian
Geographical mobility - Moved within same county (%) - Hispanic or Latino
Geographical mobility - Moved within same county (%) - American Indian and Alaska Native
Geographical mobility - Moved within same county (%) - Multirace
Geographical mobility - Moved within same county (%) - Other Race
Geographical mobility - Moved from different county within same state (%)
Geographical mobility - Moved from different county within same state (%) - White
Geographical mobility - Moved from different county within same state (%) - Black or African American
Geographical mobility - Moved from different county within same state (%) - Asian
Geographical mobility - Moved from different county within same state (%) - Hispanic or Latino
Geographical mobility - Moved from different county within same state (%) - American Indian and Alaska Native
Geographical mobility - Moved from different county within same state (%) - Multirace
Geographical mobility - Moved from different county within same state (%) - Other Race
Geographical mobility - Moved from different state (%)
Geographical mobility - Moved from different state (%) - White
Geographical mobility - Moved from different state (%) - Black or African American
Geographical mobility - Moved from different state (%) - Asian
Geographical mobility - Moved from different state (%) - Hispanic or Latino
Geographical mobility - Moved from different state (%) - American Indian and Alaska Native
Geographical mobility - Moved from different state (%) - Multirace
Geographical mobility - Moved from different state (%) - Other Race
Geographical mobility - Moved from abroad (%)
Geographical mobility - Moved from abroad (%) - White
Geographical mobility - Moved from abroad (%) - Black or African American
Geographical mobility - Moved from abroad (%) - Asian
Geographical mobility - Moved from abroad (%) - Hispanic or Latino
Geographical mobility - Moved from abroad (%) - American Indian and Alaska Native
Geographical mobility - Moved from abroad (%) - Multirace
Geographical mobility - Moved from abroad (%) - Other Race
Place of birth for the foreign-born population - Ireland (%)
Place of birth for the foreign-born population - Denmark (%)
Place of birth for the foreign-born population - Norway (%)
Place of birth for the foreign-born population - Sweden (%)
Place of birth for the foreign-born population - United Kingdom (%)
Place of birth for the foreign-born population - England (%)
Place of birth for the foreign-born population - Scotland (%)
Place of birth for the foreign-born population - Other Northern Europe (%)
Place of birth for the foreign-born population - Austria (%)
Place of birth for the foreign-born population - Belgium (%)
Place of birth for the foreign-born population - France (%)
Place of birth for the foreign-born population - Germany (%)
Place of birth for the foreign-born population - Netherlands (%)
Place of birth for the foreign-born population - Switzerland (%)
Place of birth for the foreign-born population - Other Western Europe (%)
Place of birth for the foreign-born population - Greece (%)
Place of birth for the foreign-born population - Italy (%)
Place of birth for the foreign-born population - Portugal (%)
Place of birth for the foreign-born population - Spain (%)
Place of birth for the foreign-born population - Other Southern Europe (%)
Place of birth for the foreign-born population - Albania (%)
Place of birth for the foreign-born population - Belarus (%)
Place of birth for the foreign-born population - Bosnia and Herzegovina (%)
Place of birth for the foreign-born population - Bulgaria (%)
Place of birth for the foreign-born population - Croatia (%)
Place of birth for the foreign-born population - Czechoslovakia (%)
Place of birth for the foreign-born population - Hungary (%)
Place of birth for the foreign-born population - Latvia (%)
Place of birth for the foreign-born population - Lithuania (%)
Place of birth for the foreign-born population - North Macedonia (Macedonia) (%)
Place of birth for the foreign-born population - Moldova (%)
Place of birth for the foreign-born population - Poland (%)
Place of birth for the foreign-born population - Romania (%)
Place of birth for the foreign-born population - Russia (%)
Place of birth for the foreign-born population - Serbia (%)
Place of birth for the foreign-born population - Ukraine (%)
Place of birth for the foreign-born population - Other Eastern Europe (%)
Place of birth for the foreign-born population - China (%)
Place of birth for the foreign-born population - Hong Kong (%)
Place of birth for the foreign-born population - Taiwan (%)
Place of birth for the foreign-born population - Japan (%)
Place of birth for the foreign-born population - Korea (%)
Place of birth for the foreign-born population - Other Eastern Asia (%)
Place of birth for the foreign-born population - Afghanistan (%)
Place of birth for the foreign-born population - Bangladesh (%)
Place of birth for the foreign-born population - India (%)
Place of birth for the foreign-born population - Iran (%)
Place of birth for the foreign-born population - Kazakhstan (%)
Place of birth for the foreign-born population - Nepal (%)
Place of birth for the foreign-born population - Pakistan (%)
Place of birth for the foreign-born population - Sri Lanka (%)
Place of birth for the foreign-born population - Uzbekistan (%)
Place of birth for the foreign-born population - Other South Central Asia (%)
Place of birth for the foreign-born population - Burma (%)
Place of birth for the foreign-born population - Cambodia (%)
Place of birth for the foreign-born population - Indonesia (%)
Place of birth for the foreign-born population - Laos (%)
Place of birth for the foreign-born population - Malaysia (%)
Place of birth for the foreign-born population - Philippines (%)
Place of birth for the foreign-born population - Singapore (%)
Place of birth for the foreign-born population - Thailand (%)
Place of birth for the foreign-born population - Vietnam (%)
Place of birth for the foreign-born population - Other South Eastern Asia (%)
Place of birth for the foreign-born population - Armenia (%)
Place of birth for the foreign-born population - Iraq (%)
Place of birth for the foreign-born population - Israel (%)
Place of birth for the foreign-born population - Jordan (%)
Place of birth for the foreign-born population - Kuwait (%)
Place of birth for the foreign-born population - Lebanon (%)
Place of birth for the foreign-born population - Saudi Arabia (%)
Place of birth for the foreign-born population - Syria (%)
Place of birth for the foreign-born population - Turkey (%)
Place of birth for the foreign-born population - Yemen (%)
Place of birth for the foreign-born population - Other Western Asia (%)
Place of birth for the foreign-born population - Eritrea (%)
Place of birth for the foreign-born population - Ethiopia (%)
Place of birth for the foreign-born population - Kenya (%)
Place of birth for the foreign-born population - Somalia (%)
Place of birth for the foreign-born population - Uganda (%)
Place of birth for the foreign-born population - Zimbabwe (%)
Place of birth for the foreign-born population - Other Eastern Africa (%)
Place of birth for the foreign-born population - Cameroon (%)
Place of birth for the foreign-born population - Congo (%)
Place of birth for the foreign-born population - Democratic Republic of Congo (Zaire) (%)
Place of birth for the foreign-born population - Other Middle Africa (%)
Place of birth for the foreign-born population - Egypt (%)
Place of birth for the foreign-born population - Morocco (%)
Place of birth for the foreign-born population - Sudan (%)
Place of birth for the foreign-born population - Other Northern Africa (%)
Place of birth for the foreign-born population - South Africa (%)
Place of birth for the foreign-born population - Other Southern Africa (%)
Place of birth for the foreign-born population - Cabo Verde (%)
Place of birth for the foreign-born population - Ghana (%)
Place of birth for the foreign-born population - Liberia (%)
Place of birth for the foreign-born population - Nigeria (%)
Place of birth for the foreign-born population - Senegal (%)
Place of birth for the foreign-born population - Sierra Leone (%)
Place of birth for the foreign-born population - Other Western Africa (%)
Place of birth for the foreign-born population - Australia (%)
Place of birth for the foreign-born population - New Zealand (%)
Place of birth for the foreign-born population - Fiji (%)
Place of birth for the foreign-born population - Micronesia (%)
Place of birth for the foreign-born population - Bahamas (%)
Place of birth for the foreign-born population - Barbados (%)
Place of birth for the foreign-born population - Cuba (%)
Place of birth for the foreign-born population - Dominica (%)
Place of birth for the foreign-born population - Dominican Republic (%)
Place of birth for the foreign-born population - Grenada (%)
Place of birth for the foreign-born population - Haiti (%)
Place of birth for the foreign-born population - Jamaica (%)
Place of birth for the foreign-born population - St. Vincent and the Grenadines (%)
Place of birth for the foreign-born population - Trinidad and Tobago (%)
Place of birth for the foreign-born population - West Indies (%)
Place of birth for the foreign-born population - Other Caribbean (%)
Place of birth for the foreign-born population - Belize (%)
Place of birth for the foreign-born population - Costa Rica (%)
Place of birth for the foreign-born population - El Salvador (%)
Place of birth for the foreign-born population - Guatemala (%)
Place of birth for the foreign-born population - Honduras (%)
Place of birth for the foreign-born population - Mexico (%)
Place of birth for the foreign-born population - Nicaragua (%)
Place of birth for the foreign-born population - Panama (%)
Place of birth for the foreign-born population - Other Central America (%)
Place of birth for the foreign-born population - Argentina (%)
Place of birth for the foreign-born population - Bolivia (%)
Place of birth for the foreign-born population - Brazil (%)
Place of birth for the foreign-born population - Chile (%)
Place of birth for the foreign-born population - Colombia (%)
Place of birth for the foreign-born population - Ecuador (%)
Place of birth for the foreign-born population - Guyana (%)
Place of birth for the foreign-born population - Peru (%)
Place of birth for the foreign-born population - Uruguay (%)
Place of birth for the foreign-born population - Venezuela (%)
Place of birth for the foreign-born population - Other South America (%)
Place of birth for the foreign-born population - Canada (%)
Place of birth for the foreign-born population - Other Northern America (%)
Place of birth for the foreign-born population - Other (%)
Latest news about races in Oakdale, MN collected exclusively by city-data.com from local newspapers, TV, and radio stations
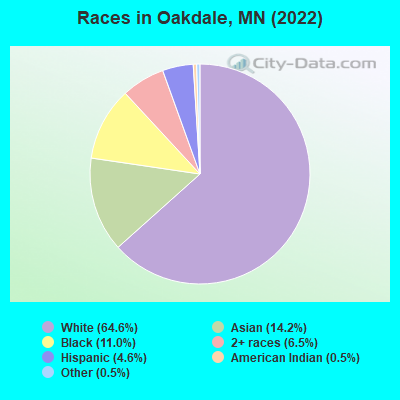
According to 2022 data, the most numerous races in Oakdale, MN are White alone (18,601 residents), Black alone (3,168 residents), and Hispanic (1,332 residents). 81.3% of Oakdale residents speak English at home. 11.1% of Oakdale, MN residents are foreign-born (4.2% born in Asia, 4.1% born in Africa, 2.1% born in Latin America), which is 28.2% greater than the foreign-born rate of 8.0% across the entire state of Minnesota.
Race distribution in Oakdale
2000 2022
4,337,143 88.2% White alone 168,813 3.4% Black alone 143,382 2.9% Hispanic 141,083 2.9% Asian alone 70,304 1.4% Two or more races 52,009 1.1% American Indian alone 5,031 0.1% Other race alone 1,714 0.03% Native Hawaiian and Other
4,356,347 76.2% White alone 395,179 6.9% Black alone 333,830 5.8% Hispanic 294,800 5.2% Asian alone 259,649 4.5% Two or more races 42,125 0.7% American Indian alone 32,976 0.6% Other race alone 2,278 0.04% Native Hawaiian and Other
Income and house value in Oakdale Median household income in 2022 $84,629 White non-Hispanic householders$43,835 Black householders$84,429 American Indian and Alaska Native householders$105,226 Asian householders$70,954 Some other race householders$87,879 Two or more races householders$66,913 Hispanic or Latino race householdersMedian 2022 house value $314,374 White Non-Hispanic householders$318,045 Black or African American householders$217,996 American Indian or Alaska Native householders $352,007 Asian householders$393,311 Some other race householders$324,241 Two or more races householders$318,504 Hispanic or Latino householders
Median age by race in Oakdale
51.2 Median age for White residents50.2 52.8 34.3 Median age for Black or African American residents25.1 36.4 46.3 Median age for American Indian / Alaska Native residents62.7 21.6 27.4 Median age for Asian residents28.5 23.4 -744,336,568.8 Median age for Native Hawaiian / Pacific Islander residents-856,799,036.4 -534,959,349.1 34.5 Median age for Other race residents55.3 24.2 20.6 Median age for Two or more races residents13.4 35.6 51.3 Median age for White alone residents50.2 53.2 32.4 Median age for Hispanic or Latino residents31.2 32.1
Owner/renter occupied households by race in Oakdale
House owners and renters - White residents 7,583 83.8% Owner occupied1,462 16.2% Renter occupiedHouse owners and renters - Black or African American residents 433 28.0% Owner occupied1,112 72.0% Renter occupiedHouse owners and renters - American Indian / Alaska Native residents 36 63.8% Owner occupied21 36.2% Renter occupiedHouse owners and renters - Asian residents 832 89.9% Owner occupied93 10.1% Renter occupiedHouse owners and renters - Other race residents 75 28.4% Owner occupied189 71.6% Renter occupiedHouse owners and renters - Two or more races residents 235 35.0% Owner occupied435 65.0% Renter occupiedHouse owners and renters - White alone residents 7,574 83.7% Owner occupied1,470 16.3% Renter occupiedHouse owners and renters - Hispanic or Latino residents 96 24.3% Owner occupied301 75.7% Renter occupied
Language usage in Oakdale
English speakers - Total 81.3% of residents of Oakdale speak English at home.
2.3% of residents speak Spanish at home 231 36.1% Speak English very well409 63.9% Speak English less than very well17.9% of residents speak other language at home 3,287 67.0% Speak English very well1,621 33.0% Speak English less than very well
English speakers - Born in the United States 91.7% of residents of Oakdale speak English at home.
0.4% of residents speak Spanish at home 18 100.0% Speak English very well8.9% of residents speak other language at home 302 69.7% Speak English very well131 30.3% Speak English less than very well
English speakers - Native, born elsewhere 78.3% of residents of Oakdale speak English at home.
0.2% of residents speak Spanish at home 1 100.0% Speak English less than very well6.1% of residents speak other language at home 29 100.0% Speak English very well
English speakers - Foreign-born 17.7% of residents of Oakdale speak English at home.
10.5% of residents speak Spanish at home 110 27.4% Speak English very well292 72.6% Speak English less than very well72.6% of residents speak other language at home 1,615 57.9% Speak English very well1,176 42.1% Speak English less than very well
White (Caucasian) - Speak only English Native:
99.2% (17,847)Foreign-born:
73.6% (129)
White (Caucasian) - Speak another language Native:
1.0% (171)Foreign-born:
35.9% (63)
Black or African American - Speak only English Native:
63.6% (556)Foreign-born:
5.2% (131)
Black or African American - Speak another language Native:
50.1% (439)Foreign-born:
84.6% (2,112)
American Indian / Alaska Native - Speak another language Native:
8.1% (10)Foreign-born:
100.0% (20)
Asian - Speak only English Native:
42.9% (1,115)Foreign-born:
16.1% (213)
Asian - Speak another language Native:
56.7% (1,472)Foreign-born:
84.3% (1,119)
Other race - Speak only English Native:
21.8% (106)Foreign-born:
7.9% (18)
Other race - Speak another language Native:
90.2% (437)Foreign-born:
92.2% (208)
Two or more races - Speak only English Native:
98.0% (1,926)Foreign-born:
25.5% (73)
Two or more races - Speak another language Native:
3.0% (59)Foreign-born:
69.5% (199)
White alone - Speak only English Native:
98.8% (17,708)Foreign-born:
65.1% (127)
White alone - Speak another language Native:
1.2% (208)Foreign-born:
38.1% (74)
Hispanic or Latino - Speak only English Native:
68.7% (612)Foreign-born:
2.5% (9)
Hispanic or Latino - Speak another language Native:
31.3% (279)Foreign-born:
97.7% (335)
Foreign-born residents in Oakdale 3,209 residents are foreign born (4.2% Asia , 4.1% Africa , 2.1% Latin America ).
This city:
11.1%Minnesota:
8.5%
Marital status for residents in Oakdale Marital status - White (Caucasian) population 15 years and over
Males 31.2% Never married52.4% Now married0.0% Separated3.0% Widowed13.4% DivorcedFemales 26.9% Never married49.7% Now married0.4% Separated8.6% Widowed14.4% DivorcedWomen who gave birth in the past 12 months Now married:
48.7% (106)Unmarried:
51.3% (112)
Women who did not give birth in the past 12 months Now married:
36.2% (1,232)Unmarried:
63.8% (2,168)
Marital status - Black or African American population 15 years and over
Males 44.7% Never married53.4% Now married0.6% Separated0.0% Widowed1.3% DivorcedFemales 31.8% Never married46.4% Now married6.1% Separated7.2% Widowed8.4% DivorcedWomen who gave birth in the past 12 months Now married:
24.0% (31)Unmarried:
76.0% (98)
Women who did not give birth in the past 12 months Now married:
56.0% (273)Unmarried:
44.0% (215)
Marital status - American Indian / Alaska Native population 15 years and over
Males 44.7% Never married55.3% Now married0.0% Separated0.0% Widowed0.0% DivorcedFemales 79.5% Never married15.9% Now married0.0% Separated0.0% Widowed4.5% DivorcedWomen who did not give birth in the past 12 months Now married:
16.7% (15)Unmarried:
83.3% (73)
Marital status - Asian population 15 years and over
Males 60.8% Never married36.3% Now married0.5% Separated0.0% Widowed2.5% DivorcedFemales 41.8% Never married44.9% Now married0.5% Separated2.8% Widowed9.9% DivorcedWomen who gave birth in the past 12 months Now married:
0.0% (0)Unmarried:
100.0% (48)
Women who did not give birth in the past 12 months Now married:
43.4% (365)Unmarried:
56.6% (476)
Marital status - Other race population 15 years and over
Males 27.0% Never married61.7% Now married0.0% Separated0.0% Widowed11.3% DivorcedFemales 20.8% Never married55.1% Now married0.0% Separated6.2% Widowed18.0% DivorcedWomen who gave birth in the past 12 months Now married:
100.0% (16)Unmarried:
0.0% (0)
Women who did not give birth in the past 12 months Now married:
27.7% (34)Unmarried:
72.3% (89)
Marital status - Two or more races population 15 years and over
Males 63.5% Never married26.6% Now married0.0% Separated3.6% Widowed6.3% DivorcedFemales 46.3% Never married35.8% Now married0.4% Separated6.7% Widowed10.8% DivorcedWomen who gave birth in the past 12 months Now married:
100.0% (44)Unmarried:
0.0% (0)
Women who did not give birth in the past 12 months Now married:
25.2% (180)Unmarried:
74.8% (535)
Marital status - White alone, not Hispanic / Latino population 15 years and over
Males 31.1% Never married52.3% Now married0.0% Separated3.0% Widowed13.5% DivorcedFemales 26.9% Never married49.3% Now married0.4% Separated8.7% Widowed14.7% DivorcedWomen who gave birth in the past 12 months Now married:
43.3% (87)Unmarried:
56.7% (114)
Women who did not give birth in the past 12 months Now married:
35.9% (1,209)Unmarried:
64.1% (2,158)
Marital status - Hispanic or Latino population 15 years and over
Males 46.8% Never married41.5% Now married0.0% Separated0.6% Widowed11.1% DivorcedFemales 35.0% Never married51.7% Now married0.0% Separated1.5% Widowed11.8% DivorcedWomen who gave birth in the past 12 months Now married:
100.0% (79)Unmarried:
0.0% (0)
Women who did not give birth in the past 12 months Now married:
28.8% (94)Unmarried:
71.2% (232)
Ancestries in Oakdale
1,946 15.3% German919 7.2% Norwegian863 6.8% American855 6.7% Ethiopian472 3.7% English388 3.1% Swedish371 2.9% Irish289 2.3% Nigerian260 2.0% European242 1.9% Italian191 1.5% Scandinavian190 1.5% Polish98 0.8% Guyanese97 0.8% Haitian85 0.7% Finnish80 0.6% French75 0.6% Greek74 0.6% African71 0.6% Kenyan57 0.4% Northern European55 0.4% Scottish54 0.4% Dutch46 0.4% Jamaican44 0.3% Scotch-Irish42 0.3% Belgian41 0.3% Somali40 0.3% Czech37 0.3% Danish26 0.2% Ghanaian21 0.2% Lebanese21 0.2% Eastern European19 0.1% Romanian16 0.1% British13 0.1% Trinidadian and Tobagonian13 0.1% Welsh11 0.09% French Canadian10 0.08% Ukrainian10 0.08% British West Indian8 0.06% Brazilian8 0.06% Serbian7 0.06% Liberian4 0.03% Hungarian
Geographical mobility in Oakdale Same house 1 year ago 16,914 91.5% White (Caucasian)2,722 91.2% Black or African American145 100.0% American Indian / Alaska Native3,795 93.5% Asian620 96.0% Other race2,233 87.3% Two or more races16,868 91.5% White alone, not Hispanic / Latino1,132 93.3% Hispanic or LatinoMoved within same county 390 2.1% White / Caucasian1 0.0% Black or African American23 0.6% Asian92 3.6% Two or more races397 2.2% White alone, not Hispanic / LatinoMoved within same state 1,031 5.6% White / Caucasian242 8.1% Black or African American187 4.6% Asian32 4.9% Other race172 6.7% Two or more races1,007 5.5% White alone, not Hispanic / Latino61 5.0% Hispanic or LatinoMoved from different state 169 0.9% White / Caucasian119 2.9% Asian173 0.9% White alone, not Hispanic / LatinoMoved from abroad 31 0.2% White9 1.5% Other race32 0.2% White alone, not Hispanic / Latino10 0.8% Hispanic or Latino
Children Nativity (place of birth) in Oakdale
Children under 6 years - Living with two parents Both parents native 568 100.0% NativeBoth parents foreign-born 298 100.0% NativeOne native, one foreign-born parent 83 100.0% NativeChildren under 6 years - Living with one parent Native parent 450 100.0% NativeForeign-born parent 68 100.0% NativeChildren 6 to 17 years - Living with two parents Both parents native 1,401 100.0% NativeBoth parents foreign-born 860 98.2% Native16 1.8% Foreign-bornOne native, one foreign-born parent 102 100.0% NativeChildren 6 to 17 years - Living with one parent Native parent 1,052 100.0% NativeForeign-born parent 567 60.4% Native372 39.6% Foreign-born
Grandparents responsible for own grandchildren in Oakdale
Grandparents (30 to 59 years) White / Caucasian 16 14.6% Responsible for grandchildren91 85.4% Not responsible for grandchildrenBlack or African American 22 100.0% Not responsible for grandchildrenAmerican Indian / Alaska Native 2 100.0% Not responsible for grandchildrenAsian 14 100.0% Not responsible for grandchildrenWhite alone, not Hispanic / Latino 16 14.3% Responsible for grandchildren94 85.7% Not responsible for grandchildrenGrandparents (60 years and over) White / Caucasian 10 8.7% Responsible for grandchildren103 91.3% Not responsible for grandchildrenBlack or African American 25 62.4% Responsible for grandchildren15 37.6% Not responsible for grandchildrenAsian 40 100.0% Not responsible for grandchildrenWhite alone, not Hispanic / Latino 10 8.9% Responsible for grandchildren103 91.1% Not responsible for grandchildren