Races in O'Fallon, Illinois (IL) Detailed Stats
Data:
Races - White alone (%)
Races - White alone (% change since 2000)
Races - Black alone (%)
Races - Black alone (% change since 2000)
Races - American Indian alone (%)
Races - American Indian alone (% change since 2000)
Races - Asian alone (%)
Races - Asian alone (% change since 2000)
Races - Hispanic (%)
Races - Hispanic (% change since 2000)
Races - Native Hawaiian and Other Pacific Islander alone (%)
Races - Native Hawaiian and Other Pacific Islander alone (% change since 2000)
Races - Two or more races(%)
Races - Two or more races(% change since 2000)
Races - Other race alone (%)
Races - Other race alone (% change since 2000)
Racial diversity
Place of birth - Born in state of residence (%)
Place of birth - Born in state of residence (%) - White
Place of birth - Born in state of residence (%) - Black or African American
Place of birth - Born in state of residence (%) - Asian
Place of birth - Born in state of residence (%) - Hispanic or Latino
Place of birth - Born in state of residence (%) - American Indian and Alaska Native
Place of birth - Born in state of residence (%) - Multirace
Place of birth - Born in state of residence (%) - Other Race
Place of birth - Born in other state (%)
Place of birth - Born in other state (%) - White
Place of birth - Born in other state (%) - Black or African American
Place of birth - Born in other state (%) - Asian
Place of birth - Born in other state (%) - Hispanic or Latino
Place of birth - Born in other state (%) - American Indian and Alaska Native
Place of birth - Born in other state (%) - Multirace
Place of birth - Born in other state (%) - Other Race
Place of birth - Native, outside of US (%)
Place of birth - Native, outside of US (%) - White
Place of birth - Native, outside of US (%) - Black or African American
Place of birth - Native, outside of US (%) - Asian
Place of birth - Native, outside of US (%) - Hispanic or Latino
Place of birth - Native, outside of US (%) - American Indian and Alaska Native
Place of birth - Native, outside of US (%) - Multirace
Place of birth - Native, outside of US (%) - Other Race
Place of birth - Foreign born (%)
Place of birth - Foreign born (%) - White
Place of birth - Foreign born (%) - Black or African American
Place of birth - Foreign born (%) - Asian
Place of birth - Foreign born (%) - Hispanic or Latino
Place of birth - Foreign born (%) - American Indian and Alaska Native
Place of birth - Foreign born (%) - Multirace
Place of birth - Foreign born (%) - Other Race
Residents speaking English at home (%)
Residents speaking English at home - Born in the United States (%)
Residents speaking English at home - Native, born elsewhere (%)
Residents speaking English at home - Foreign born (%)
Residents speaking Spanish at home (%)
Residents speaking Spanish at home - Born in the United States (%)
Residents speaking Spanish at home - Native, born elsewhere (%)
Residents speaking Spanish at home - Foreign born (%)
Residents speaking other language at home (%)
Residents speaking other language at home - Born in the United States (%)
Residents speaking other language at home - Native, born elsewhere (%)
Residents speaking other language at home - Foreign born (%)
Marital status - Never married (%)
Marital status - Now married (%)
Marital status - Separated (%)
Marital status - Widowed (%)
Marital status - Divorced (%)
Ancestries Reported - Arab (%)
Ancestries Reported - Czech (%)
Ancestries Reported - Danish (%)
Ancestries Reported - Dutch (%)
Ancestries Reported - English (%)
Ancestries Reported - French (%)
Ancestries Reported - French Canadian (%)
Ancestries Reported - German (%)
Ancestries Reported - Greek (%)
Ancestries Reported - Hungarian (%)
Ancestries Reported - Irish (%)
Ancestries Reported - Italian (%)
Ancestries Reported - Lithuanian (%)
Ancestries Reported - Norwegian (%)
Ancestries Reported - Polish (%)
Ancestries Reported - Portuguese (%)
Ancestries Reported - Russian (%)
Ancestries Reported - Scotch-Irish (%)
Ancestries Reported - Scottish (%)
Ancestries Reported - Slovak (%)
Ancestries Reported - Subsaharan African (%)
Ancestries Reported - Swedish (%)
Ancestries Reported - Swiss (%)
Ancestries Reported - Ukrainian (%)
Ancestries Reported - United States (%)
Ancestries Reported - Welsh (%)
Ancestries Reported - West Indian (%)
Ancestries Reported - Other (%)
Geographical mobility - Same house 1 year ago (%)
Geographical mobility - Same house 1 year ago (%) - White
Geographical mobility - Same house 1 year ago (%) - Black or African American
Geographical mobility - Same house 1 year ago (%) - Asian
Geographical mobility - Same house 1 year ago (%) - Hispanic or Latino
Geographical mobility - Same house 1 year ago (%) - American Indian and Alaska Native
Geographical mobility - Same house 1 year ago (%) - Multirace
Geographical mobility - Same house 1 year ago (%) - Other Race
Geographical mobility - Moved within same county (%)
Geographical mobility - Moved within same county (%) - White
Geographical mobility - Moved within same county (%) - Black or African American
Geographical mobility - Moved within same county (%) - Asian
Geographical mobility - Moved within same county (%) - Hispanic or Latino
Geographical mobility - Moved within same county (%) - American Indian and Alaska Native
Geographical mobility - Moved within same county (%) - Multirace
Geographical mobility - Moved within same county (%) - Other Race
Geographical mobility - Moved from different county within same state (%)
Geographical mobility - Moved from different county within same state (%) - White
Geographical mobility - Moved from different county within same state (%) - Black or African American
Geographical mobility - Moved from different county within same state (%) - Asian
Geographical mobility - Moved from different county within same state (%) - Hispanic or Latino
Geographical mobility - Moved from different county within same state (%) - American Indian and Alaska Native
Geographical mobility - Moved from different county within same state (%) - Multirace
Geographical mobility - Moved from different county within same state (%) - Other Race
Geographical mobility - Moved from different state (%)
Geographical mobility - Moved from different state (%) - White
Geographical mobility - Moved from different state (%) - Black or African American
Geographical mobility - Moved from different state (%) - Asian
Geographical mobility - Moved from different state (%) - Hispanic or Latino
Geographical mobility - Moved from different state (%) - American Indian and Alaska Native
Geographical mobility - Moved from different state (%) - Multirace
Geographical mobility - Moved from different state (%) - Other Race
Geographical mobility - Moved from abroad (%)
Geographical mobility - Moved from abroad (%) - White
Geographical mobility - Moved from abroad (%) - Black or African American
Geographical mobility - Moved from abroad (%) - Asian
Geographical mobility - Moved from abroad (%) - Hispanic or Latino
Geographical mobility - Moved from abroad (%) - American Indian and Alaska Native
Geographical mobility - Moved from abroad (%) - Multirace
Geographical mobility - Moved from abroad (%) - Other Race
Place of birth for the foreign-born population - Ireland (%)
Place of birth for the foreign-born population - Denmark (%)
Place of birth for the foreign-born population - Norway (%)
Place of birth for the foreign-born population - Sweden (%)
Place of birth for the foreign-born population - United Kingdom (%)
Place of birth for the foreign-born population - England (%)
Place of birth for the foreign-born population - Scotland (%)
Place of birth for the foreign-born population - Other Northern Europe (%)
Place of birth for the foreign-born population - Austria (%)
Place of birth for the foreign-born population - Belgium (%)
Place of birth for the foreign-born population - France (%)
Place of birth for the foreign-born population - Germany (%)
Place of birth for the foreign-born population - Netherlands (%)
Place of birth for the foreign-born population - Switzerland (%)
Place of birth for the foreign-born population - Other Western Europe (%)
Place of birth for the foreign-born population - Greece (%)
Place of birth for the foreign-born population - Italy (%)
Place of birth for the foreign-born population - Portugal (%)
Place of birth for the foreign-born population - Spain (%)
Place of birth for the foreign-born population - Other Southern Europe (%)
Place of birth for the foreign-born population - Albania (%)
Place of birth for the foreign-born population - Belarus (%)
Place of birth for the foreign-born population - Bosnia and Herzegovina (%)
Place of birth for the foreign-born population - Bulgaria (%)
Place of birth for the foreign-born population - Croatia (%)
Place of birth for the foreign-born population - Czechoslovakia (%)
Place of birth for the foreign-born population - Hungary (%)
Place of birth for the foreign-born population - Latvia (%)
Place of birth for the foreign-born population - Lithuania (%)
Place of birth for the foreign-born population - North Macedonia (Macedonia) (%)
Place of birth for the foreign-born population - Moldova (%)
Place of birth for the foreign-born population - Poland (%)
Place of birth for the foreign-born population - Romania (%)
Place of birth for the foreign-born population - Russia (%)
Place of birth for the foreign-born population - Serbia (%)
Place of birth for the foreign-born population - Ukraine (%)
Place of birth for the foreign-born population - Other Eastern Europe (%)
Place of birth for the foreign-born population - China (%)
Place of birth for the foreign-born population - Hong Kong (%)
Place of birth for the foreign-born population - Taiwan (%)
Place of birth for the foreign-born population - Japan (%)
Place of birth for the foreign-born population - Korea (%)
Place of birth for the foreign-born population - Other Eastern Asia (%)
Place of birth for the foreign-born population - Afghanistan (%)
Place of birth for the foreign-born population - Bangladesh (%)
Place of birth for the foreign-born population - India (%)
Place of birth for the foreign-born population - Iran (%)
Place of birth for the foreign-born population - Kazakhstan (%)
Place of birth for the foreign-born population - Nepal (%)
Place of birth for the foreign-born population - Pakistan (%)
Place of birth for the foreign-born population - Sri Lanka (%)
Place of birth for the foreign-born population - Uzbekistan (%)
Place of birth for the foreign-born population - Other South Central Asia (%)
Place of birth for the foreign-born population - Burma (%)
Place of birth for the foreign-born population - Cambodia (%)
Place of birth for the foreign-born population - Indonesia (%)
Place of birth for the foreign-born population - Laos (%)
Place of birth for the foreign-born population - Malaysia (%)
Place of birth for the foreign-born population - Philippines (%)
Place of birth for the foreign-born population - Singapore (%)
Place of birth for the foreign-born population - Thailand (%)
Place of birth for the foreign-born population - Vietnam (%)
Place of birth for the foreign-born population - Other South Eastern Asia (%)
Place of birth for the foreign-born population - Armenia (%)
Place of birth for the foreign-born population - Iraq (%)
Place of birth for the foreign-born population - Israel (%)
Place of birth for the foreign-born population - Jordan (%)
Place of birth for the foreign-born population - Kuwait (%)
Place of birth for the foreign-born population - Lebanon (%)
Place of birth for the foreign-born population - Saudi Arabia (%)
Place of birth for the foreign-born population - Syria (%)
Place of birth for the foreign-born population - Turkey (%)
Place of birth for the foreign-born population - Yemen (%)
Place of birth for the foreign-born population - Other Western Asia (%)
Place of birth for the foreign-born population - Eritrea (%)
Place of birth for the foreign-born population - Ethiopia (%)
Place of birth for the foreign-born population - Kenya (%)
Place of birth for the foreign-born population - Somalia (%)
Place of birth for the foreign-born population - Uganda (%)
Place of birth for the foreign-born population - Zimbabwe (%)
Place of birth for the foreign-born population - Other Eastern Africa (%)
Place of birth for the foreign-born population - Cameroon (%)
Place of birth for the foreign-born population - Congo (%)
Place of birth for the foreign-born population - Democratic Republic of Congo (Zaire) (%)
Place of birth for the foreign-born population - Other Middle Africa (%)
Place of birth for the foreign-born population - Egypt (%)
Place of birth for the foreign-born population - Morocco (%)
Place of birth for the foreign-born population - Sudan (%)
Place of birth for the foreign-born population - Other Northern Africa (%)
Place of birth for the foreign-born population - South Africa (%)
Place of birth for the foreign-born population - Other Southern Africa (%)
Place of birth for the foreign-born population - Cabo Verde (%)
Place of birth for the foreign-born population - Ghana (%)
Place of birth for the foreign-born population - Liberia (%)
Place of birth for the foreign-born population - Nigeria (%)
Place of birth for the foreign-born population - Senegal (%)
Place of birth for the foreign-born population - Sierra Leone (%)
Place of birth for the foreign-born population - Other Western Africa (%)
Place of birth for the foreign-born population - Australia (%)
Place of birth for the foreign-born population - New Zealand (%)
Place of birth for the foreign-born population - Fiji (%)
Place of birth for the foreign-born population - Micronesia (%)
Place of birth for the foreign-born population - Bahamas (%)
Place of birth for the foreign-born population - Barbados (%)
Place of birth for the foreign-born population - Cuba (%)
Place of birth for the foreign-born population - Dominica (%)
Place of birth for the foreign-born population - Dominican Republic (%)
Place of birth for the foreign-born population - Grenada (%)
Place of birth for the foreign-born population - Haiti (%)
Place of birth for the foreign-born population - Jamaica (%)
Place of birth for the foreign-born population - St. Vincent and the Grenadines (%)
Place of birth for the foreign-born population - Trinidad and Tobago (%)
Place of birth for the foreign-born population - West Indies (%)
Place of birth for the foreign-born population - Other Caribbean (%)
Place of birth for the foreign-born population - Belize (%)
Place of birth for the foreign-born population - Costa Rica (%)
Place of birth for the foreign-born population - El Salvador (%)
Place of birth for the foreign-born population - Guatemala (%)
Place of birth for the foreign-born population - Honduras (%)
Place of birth for the foreign-born population - Mexico (%)
Place of birth for the foreign-born population - Nicaragua (%)
Place of birth for the foreign-born population - Panama (%)
Place of birth for the foreign-born population - Other Central America (%)
Place of birth for the foreign-born population - Argentina (%)
Place of birth for the foreign-born population - Bolivia (%)
Place of birth for the foreign-born population - Brazil (%)
Place of birth for the foreign-born population - Chile (%)
Place of birth for the foreign-born population - Colombia (%)
Place of birth for the foreign-born population - Ecuador (%)
Place of birth for the foreign-born population - Guyana (%)
Place of birth for the foreign-born population - Peru (%)
Place of birth for the foreign-born population - Uruguay (%)
Place of birth for the foreign-born population - Venezuela (%)
Place of birth for the foreign-born population - Other South America (%)
Place of birth for the foreign-born population - Canada (%)
Place of birth for the foreign-born population - Other Northern America (%)
Place of birth for the foreign-born population - Other (%)
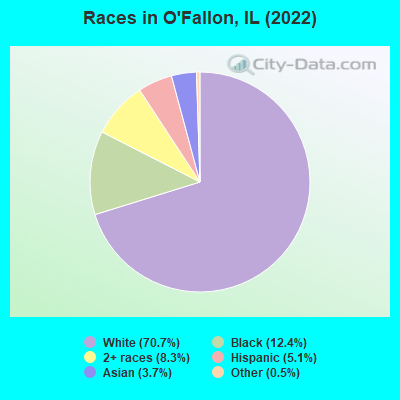
According to 2022 data, the most numerous races in O'Fallon, IL are White alone (22,340 residents), Hispanic (1,605 residents), and Black alone (3,910 residents). 93.7% of O'Fallon residents speak English at home. 4.1% of O'Fallon, IL residents are foreign-born (2.1% born in Asia, 0.8% born in Europe, 0.5% born in Latin America, 0.5% born in Africa), which is 239.1% less than the foreign-born rate of 14.0% across the entire state of Illinois.
Race distribution in O'Fallon
2000 2022
8,424,140 67.8% White alone 1,856,152 14.9% Black alone 1,530,262 12.3% Hispanic 419,916 3.4% Asian alone 153,996 1.2% Two or more races 13,479 0.1% Other race alone 18,232 0.1% American Indian alone 3,116 0.03% Native Hawaiian and Other
7,356,301 58.5% White alone 2,299,726 18.3% Hispanic 1,660,423 13.2% Black alone 747,296 5.9% Asian alone 458,599 3.6% Two or more races 45,386 0.4% Other race alone 10,405 0.08% American Indian alone 3,896 0.03% Native Hawaiian and Other
Income and house value in O'Fallon Median household income in 2022 $101,426 White non-Hispanic householders$86,475 Black householders$91,988 Asian householdersover $200,000 Some other race householders$116,448 Two or more races householders$134,663 Hispanic or Latino race householdersMedian 2022 house value $298,798 White Non-Hispanic householders$356,356 Black or African American householders$237,737 American Indian or Alaska Native householders $304,554 Asian householders$81,331 Some other race householders$287,787 Two or more races householders$324,324 Hispanic or Latino householders
Median age by race in O'Fallon
39.9 Median age for White residents38.6 40.5 43.4 Median age for Black or African American residents32.6 47.2 -923,913,042.6 Median age for American Indian / Alaska Native residents-852,320,674.3 -688,956,432.9 38.9 Median age for Asian residents40.3 35.3 -593,236,714.4 Median age for Native Hawaiian / Pacific Islander residents-666,666,666.0 -576,015,108.0 36.6 Median age for Other race residents42.1 32.6 22.3 Median age for Two or more races residents22.4 20.6 39.8 Median age for White alone residents38.3 40.0 23.8 Median age for Hispanic or Latino residents21.9 30.2
Owner/renter occupied households by race in O'Fallon
House owners and renters - White residents 7,143 77.1% Owner occupied2,119 22.9% Renter occupiedHouse owners and renters - Black or African American residents 933 55.7% Owner occupied742 44.3% Renter occupiedHouse owners and renters - American Indian / Alaska Native residents 24 86.7% Owner occupied4 13.3% Renter occupiedHouse owners and renters - Asian residents 245 77.7% Owner occupied70 22.3% Renter occupiedHouse owners and renters - Other race residents 88 77.4% Owner occupied26 22.6% Renter occupiedHouse owners and renters - Two or more races residents 584 61.6% Owner occupied363 38.4% Renter occupiedHouse owners and renters - White alone residents 7,152 76.8% Owner occupied2,162 23.2% Renter occupiedHouse owners and renters - Hispanic or Latino residents 162 60.5% Owner occupied106 39.5% Renter occupied
Language usage in O'Fallon
English speakers - Total 93.7% of residents of O'Fallon speak English at home.
2.9% of residents speak Spanish at home 522 61.1% Speak English very well332 38.9% Speak English less than very well3.2% of residents speak other language at home 656 70.2% Speak English very well278 29.8% Speak English less than very well
English speakers - Born in the United States 95.2% of residents of O'Fallon speak English at home.
3.5% of residents speak Spanish at home 433 90.0% Speak English very well48 10.0% Speak English less than very well1.0% of residents speak other language at home 114 80.3% Speak English very well28 19.7% Speak English less than very well
English speakers - Native, born elsewhere 94.0% of residents of O'Fallon speak English at home.
2.7% of residents speak Spanish at home 27 100.0% Speak English very well8.5% of residents speak other language at home 63 74.1% Speak English very well22 25.9% Speak English less than very well
English speakers - Foreign-born 25.5% of residents of O'Fallon speak English at home.
8.9% of residents speak Spanish at home 38 34.5% Speak English very well72 65.5% Speak English less than very well62.2% of residents speak other language at home 565 73.7% Speak English very well202 26.3% Speak English less than very well
White (Caucasian) - Speak only English Native:
98.2% (20,393)Foreign-born:
86.0% (277)
White (Caucasian) - Speak another language Native:
1.7% (352)Foreign-born:
24.2% (78)
Black or African American - Speak only English Native:
98.9% (3,468)Foreign-born:
100.0% (59)
Asian - Speak only English Native:
44.5% (213)Foreign-born:
13.3% (88)
Asian - Speak another language Native:
56.2% (269)Foreign-born:
100.0% (658)
Other race - Speak another language Native:
22.4% (77)Foreign-born:
100.0% (22)
Two or more races - Speak only English Native:
91.1% (3,153)Foreign-born:
13.2% (39)
Two or more races - Speak another language Native:
9.0% (313)Foreign-born:
85.6% (255)
White alone - Speak only English Native:
98.9% (20,327)Foreign-born:
84.8% (329)
White alone - Speak another language Native:
1.1% (230)Foreign-born:
20.2% (78)
Hispanic or Latino - Speak only English Native:
65.2% (915)Foreign-born:
8.1% (8)
Hispanic or Latino - Speak another language Native:
34.9% (489)Foreign-born:
100.0% (97)
Foreign-born residents in O'Fallon 1,304 residents are foreign born (2.1% Asia , 0.8% Europe , 0.5% Latin America , 0.5% Africa ).
This city:
4.1%Illinois:
14.1%
Marital status for residents in O'Fallon Marital status - White (Caucasian) population 15 years and over
Males 27.0% Never married64.5% Now married0.8% Separated1.8% Widowed5.9% DivorcedFemales 20.5% Never married61.2% Now married0.6% Separated9.2% Widowed8.5% DivorcedWomen who gave birth in the past 12 months Now married:
85.0% (371)Unmarried:
15.0% (65)
Women who did not give birth in the past 12 months Now married:
53.6% (2,360)Unmarried:
46.4% (2,047)
Marital status - Black or African American population 15 years and over
Males 36.3% Never married44.3% Now married0.0% Separated5.8% Widowed13.6% DivorcedFemales 27.3% Never married43.1% Now married9.9% Separated5.7% Widowed14.0% DivorcedWomen who gave birth in the past 12 months Now married:
39.4% (70)Unmarried:
60.6% (108)
Women who did not give birth in the past 12 months Now married:
47.1% (396)Unmarried:
52.9% (445)
Marital status - Asian population 15 years and over
Males 12.1% Never married87.9% Now married0.0% Separated0.0% Widowed0.0% DivorcedFemales 23.8% Never married70.8% Now married2.2% Separated3.1% Widowed0.0% DivorcedWomen who gave birth in the past 12 months Now married:
100.0% (34)Unmarried:
0.0% (0)
Women who did not give birth in the past 12 months Now married:
68.7% (191)Unmarried:
31.3% (87)
Marital status - Other race population 15 years and over
Males 29.5% Never married44.6% Now married5.0% Separated0.0% Widowed20.9% DivorcedFemales 29.9% Never married56.3% Now married0.0% Separated13.8% Widowed0.0% DivorcedWomen who did not give birth in the past 12 months Now married:
61.2% (48)Unmarried:
38.8% (30)
Marital status - Two or more races population 15 years and over
Males 35.9% Never married56.3% Now married0.0% Separated0.6% Widowed7.1% DivorcedFemales 37.3% Never married47.6% Now married0.0% Separated2.4% Widowed12.8% DivorcedWomen who gave birth in the past 12 months Now married:
0.0% (0)Unmarried:
100.0% (24)
Women who did not give birth in the past 12 months Now married:
45.7% (349)Unmarried:
54.3% (415)
Marital status - White alone, not Hispanic / Latino population 15 years and over
Males 27.0% Never married64.3% Now married0.8% Separated1.8% Widowed6.0% DivorcedFemales 20.4% Never married61.0% Now married0.6% Separated9.3% Widowed8.7% DivorcedWomen who gave birth in the past 12 months Now married:
84.5% (370)Unmarried:
15.5% (68)
Women who did not give birth in the past 12 months Now married:
53.3% (2,378)Unmarried:
46.7% (2,082)
Marital status - Hispanic or Latino population 15 years and over
Males 48.5% Never married47.8% Now married1.6% Separated0.0% Widowed2.0% DivorcedFemales 17.6% Never married79.0% Now married0.0% Separated1.7% Widowed1.7% DivorcedWomen who gave birth in the past 12 months Now married:
48.5% (17)Unmarried:
51.5% (18)
Women who did not give birth in the past 12 months Now married:
79.6% (283)Unmarried:
20.4% (72)
Ancestries in O'Fallon
2,701 19.3% German1,384 9.9% English796 5.7% American643 4.6% Irish548 3.9% Polish492 3.5% European340 2.4% Italian182 1.3% Scottish145 1.0% Arab125 0.9% French91 0.7% Swiss84 0.6% Scotch-Irish76 0.5% Swedish74 0.5% French Canadian73 0.5% Dutch70 0.5% African65 0.5% Jamaican53 0.4% British47 0.3% Norwegian46 0.3% Haitian44 0.3% Welsh43 0.3% Egyptian33 0.2% Lithuanian26 0.2% Eastern European25 0.2% Iraqi23 0.2% Greek23 0.2% Portuguese23 0.2% Russian21 0.2% Syrian20 0.1% Czech19 0.1% Scandinavian18 0.1% Lebanese17 0.1% Croatian17 0.1% Guyanese11 0.08% Hungarian9 0.06% Canadian8 0.06% Serbian8 0.06% Slovak7 0.05% Slavic6 0.04% Finnish5 0.04% Danish
Geographical mobility in O'Fallon Same house 1 year ago 20,518 92.1% White (Caucasian)3,094 81.5% Black or African American941 81.7% Asian293 100.0% Other race3,751 88.8% Two or more races20,365 92.1% White alone, not Hispanic / Latino1,389 91.7% Hispanic or LatinoMoved within same county 641 2.9% White / Caucasian431 11.4% Black or African American22 89.3% American Indian / Alaska Native41 3.5% Asian148 3.5% Two or more races655 3.0% White alone, not Hispanic / Latino10 0.7% Hispanic or LatinoMoved within same state 269 1.2% White / Caucasian44 1.0% Two or more races277 1.3% White alone, not Hispanic / Latino34 2.3% Hispanic or LatinoMoved from different state 805 3.6% White / Caucasian155 4.1% Black or African American3 12.3% American Indian / Alaska Native138 12.0% Asian234 5.5% Two or more races782 3.5% White alone, not Hispanic / Latino26 1.7% Hispanic or LatinoMoved from abroad 183 0.8% White108 2.9% Black or African American27 2.4% Asian83 2.0% Two or more races147 0.7% White alone, not Hispanic / Latino85 5.6% Hispanic or Latino
Children Nativity (place of birth) in O'Fallon
Children under 6 years - Living with two parents Both parents native 1,457 99.3% Native10 0.7% Foreign-bornBoth parents foreign-born 49 100.0% NativeOne native, one foreign-born parent 73 100.0% NativeChildren under 6 years - Living with one parent Native parent 597 100.0% NativeForeign-born parent 80 100.0% NativeChildren 6 to 17 years - Living with two parents Both parents native 3,414 100.0% NativeBoth parents foreign-born 114 100.0% NativeOne native, one foreign-born parent 391 88.1% Native53 11.9% Foreign-bornChildren 6 to 17 years - Living with one parent Native parent 2,071 100.0% NativeForeign-born parent 26 50.8% Native26 49.2% Foreign-born
Grandparents responsible for own grandchildren in O'Fallon
Grandparents (30 to 59 years) White / Caucasian 11 11.3% Responsible for grandchildren90 88.7% Not responsible for grandchildrenBlack or African American 32 45.4% Responsible for grandchildren38 54.6% Not responsible for grandchildrenWhite alone, not Hispanic / Latino 11 11.1% Responsible for grandchildren92 88.9% Not responsible for grandchildren
Grandparents (60 years and over) White / Caucasian 7 3.5% Responsible for grandchildren179 96.5% Not responsible for grandchildrenBlack or African American 1 1.6% Responsible for grandchildren79 98.4% Not responsible for grandchildrenWhite alone, not Hispanic / Latino 7 3.7% Responsible for grandchildren181 96.3% Not responsible for grandchildren