Races in New Brunswick, New Jersey (NJ) Detailed Stats
Data:
Races - White alone (%)
Races - White alone (% change since 2000)
Races - Black alone (%)
Races - Black alone (% change since 2000)
Races - American Indian alone (%)
Races - American Indian alone (% change since 2000)
Races - Asian alone (%)
Races - Asian alone (% change since 2000)
Races - Hispanic (%)
Races - Hispanic (% change since 2000)
Races - Native Hawaiian and Other Pacific Islander alone (%)
Races - Native Hawaiian and Other Pacific Islander alone (% change since 2000)
Races - Two or more races(%)
Races - Two or more races(% change since 2000)
Races - Other race alone (%)
Races - Other race alone (% change since 2000)
Racial diversity
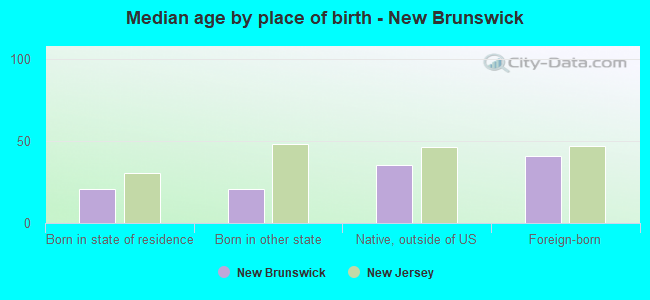
Place of birth - Born in state of residence (%)
Place of birth - Born in state of residence (%) - White
Place of birth - Born in state of residence (%) - Black or African American
Place of birth - Born in state of residence (%) - Asian
Place of birth - Born in state of residence (%) - Hispanic or Latino
Place of birth - Born in state of residence (%) - American Indian and Alaska Native
Place of birth - Born in state of residence (%) - Multirace
Place of birth - Born in state of residence (%) - Other Race
Place of birth - Born in other state (%)
Place of birth - Born in other state (%) - White
Place of birth - Born in other state (%) - Black or African American
Place of birth - Born in other state (%) - Asian
Place of birth - Born in other state (%) - Hispanic or Latino
Place of birth - Born in other state (%) - American Indian and Alaska Native
Place of birth - Born in other state (%) - Multirace
Place of birth - Born in other state (%) - Other Race
Place of birth - Native, outside of US (%)
Place of birth - Native, outside of US (%) - White
Place of birth - Native, outside of US (%) - Black or African American
Place of birth - Native, outside of US (%) - Asian
Place of birth - Native, outside of US (%) - Hispanic or Latino
Place of birth - Native, outside of US (%) - American Indian and Alaska Native
Place of birth - Native, outside of US (%) - Multirace
Place of birth - Native, outside of US (%) - Other Race
Place of birth - Foreign born (%)
Place of birth - Foreign born (%) - White
Place of birth - Foreign born (%) - Black or African American
Place of birth - Foreign born (%) - Asian
Place of birth - Foreign born (%) - Hispanic or Latino
Place of birth - Foreign born (%) - American Indian and Alaska Native
Place of birth - Foreign born (%) - Multirace
Place of birth - Foreign born (%) - Other Race
Residents speaking English at home (%)
Residents speaking English at home - Born in the United States (%)
Residents speaking English at home - Native, born elsewhere (%)
Residents speaking English at home - Foreign born (%)
Residents speaking Spanish at home (%)
Residents speaking Spanish at home - Born in the United States (%)
Residents speaking Spanish at home - Native, born elsewhere (%)
Residents speaking Spanish at home - Foreign born (%)
Residents speaking other language at home (%)
Residents speaking other language at home - Born in the United States (%)
Residents speaking other language at home - Native, born elsewhere (%)
Residents speaking other language at home - Foreign born (%)
Marital status - Never married (%)
Marital status - Now married (%)
Marital status - Separated (%)
Marital status - Widowed (%)
Marital status - Divorced (%)
Ancestries Reported - Arab (%)
Ancestries Reported - Czech (%)
Ancestries Reported - Danish (%)
Ancestries Reported - Dutch (%)
Ancestries Reported - English (%)
Ancestries Reported - French (%)
Ancestries Reported - French Canadian (%)
Ancestries Reported - German (%)
Ancestries Reported - Greek (%)
Ancestries Reported - Hungarian (%)
Ancestries Reported - Irish (%)
Ancestries Reported - Italian (%)
Ancestries Reported - Lithuanian (%)
Ancestries Reported - Norwegian (%)
Ancestries Reported - Polish (%)
Ancestries Reported - Portuguese (%)
Ancestries Reported - Russian (%)
Ancestries Reported - Scotch-Irish (%)
Ancestries Reported - Scottish (%)
Ancestries Reported - Slovak (%)
Ancestries Reported - Subsaharan African (%)
Ancestries Reported - Swedish (%)
Ancestries Reported - Swiss (%)
Ancestries Reported - Ukrainian (%)
Ancestries Reported - United States (%)
Ancestries Reported - Welsh (%)
Ancestries Reported - West Indian (%)
Ancestries Reported - Other (%)
Geographical mobility - Same house 1 year ago (%)
Geographical mobility - Same house 1 year ago (%) - White
Geographical mobility - Same house 1 year ago (%) - Black or African American
Geographical mobility - Same house 1 year ago (%) - Asian
Geographical mobility - Same house 1 year ago (%) - Hispanic or Latino
Geographical mobility - Same house 1 year ago (%) - American Indian and Alaska Native
Geographical mobility - Same house 1 year ago (%) - Multirace
Geographical mobility - Same house 1 year ago (%) - Other Race
Geographical mobility - Moved within same county (%)
Geographical mobility - Moved within same county (%) - White
Geographical mobility - Moved within same county (%) - Black or African American
Geographical mobility - Moved within same county (%) - Asian
Geographical mobility - Moved within same county (%) - Hispanic or Latino
Geographical mobility - Moved within same county (%) - American Indian and Alaska Native
Geographical mobility - Moved within same county (%) - Multirace
Geographical mobility - Moved within same county (%) - Other Race
Geographical mobility - Moved from different county within same state (%)
Geographical mobility - Moved from different county within same state (%) - White
Geographical mobility - Moved from different county within same state (%) - Black or African American
Geographical mobility - Moved from different county within same state (%) - Asian
Geographical mobility - Moved from different county within same state (%) - Hispanic or Latino
Geographical mobility - Moved from different county within same state (%) - American Indian and Alaska Native
Geographical mobility - Moved from different county within same state (%) - Multirace
Geographical mobility - Moved from different county within same state (%) - Other Race
Geographical mobility - Moved from different state (%)
Geographical mobility - Moved from different state (%) - White
Geographical mobility - Moved from different state (%) - Black or African American
Geographical mobility - Moved from different state (%) - Asian
Geographical mobility - Moved from different state (%) - Hispanic or Latino
Geographical mobility - Moved from different state (%) - American Indian and Alaska Native
Geographical mobility - Moved from different state (%) - Multirace
Geographical mobility - Moved from different state (%) - Other Race
Geographical mobility - Moved from abroad (%)
Geographical mobility - Moved from abroad (%) - White
Geographical mobility - Moved from abroad (%) - Black or African American
Geographical mobility - Moved from abroad (%) - Asian
Geographical mobility - Moved from abroad (%) - Hispanic or Latino
Geographical mobility - Moved from abroad (%) - American Indian and Alaska Native
Geographical mobility - Moved from abroad (%) - Multirace
Geographical mobility - Moved from abroad (%) - Other Race
Place of birth for the foreign-born population - Ireland (%)
Place of birth for the foreign-born population - Denmark (%)
Place of birth for the foreign-born population - Norway (%)
Place of birth for the foreign-born population - Sweden (%)
Place of birth for the foreign-born population - United Kingdom (%)
Place of birth for the foreign-born population - England (%)
Place of birth for the foreign-born population - Scotland (%)
Place of birth for the foreign-born population - Other Northern Europe (%)
Place of birth for the foreign-born population - Austria (%)
Place of birth for the foreign-born population - Belgium (%)
Place of birth for the foreign-born population - France (%)
Place of birth for the foreign-born population - Germany (%)
Place of birth for the foreign-born population - Netherlands (%)
Place of birth for the foreign-born population - Switzerland (%)
Place of birth for the foreign-born population - Other Western Europe (%)
Place of birth for the foreign-born population - Greece (%)
Place of birth for the foreign-born population - Italy (%)
Place of birth for the foreign-born population - Portugal (%)
Place of birth for the foreign-born population - Spain (%)
Place of birth for the foreign-born population - Other Southern Europe (%)
Place of birth for the foreign-born population - Albania (%)
Place of birth for the foreign-born population - Belarus (%)
Place of birth for the foreign-born population - Bosnia and Herzegovina (%)
Place of birth for the foreign-born population - Bulgaria (%)
Place of birth for the foreign-born population - Croatia (%)
Place of birth for the foreign-born population - Czechoslovakia (%)
Place of birth for the foreign-born population - Hungary (%)
Place of birth for the foreign-born population - Latvia (%)
Place of birth for the foreign-born population - Lithuania (%)
Place of birth for the foreign-born population - North Macedonia (Macedonia) (%)
Place of birth for the foreign-born population - Moldova (%)
Place of birth for the foreign-born population - Poland (%)
Place of birth for the foreign-born population - Romania (%)
Place of birth for the foreign-born population - Russia (%)
Place of birth for the foreign-born population - Serbia (%)
Place of birth for the foreign-born population - Ukraine (%)
Place of birth for the foreign-born population - Other Eastern Europe (%)
Place of birth for the foreign-born population - China (%)
Place of birth for the foreign-born population - Hong Kong (%)
Place of birth for the foreign-born population - Taiwan (%)
Place of birth for the foreign-born population - Japan (%)
Place of birth for the foreign-born population - Korea (%)
Place of birth for the foreign-born population - Other Eastern Asia (%)
Place of birth for the foreign-born population - Afghanistan (%)
Place of birth for the foreign-born population - Bangladesh (%)
Place of birth for the foreign-born population - India (%)
Place of birth for the foreign-born population - Iran (%)
Place of birth for the foreign-born population - Kazakhstan (%)
Place of birth for the foreign-born population - Nepal (%)
Place of birth for the foreign-born population - Pakistan (%)
Place of birth for the foreign-born population - Sri Lanka (%)
Place of birth for the foreign-born population - Uzbekistan (%)
Place of birth for the foreign-born population - Other South Central Asia (%)
Place of birth for the foreign-born population - Burma (%)
Place of birth for the foreign-born population - Cambodia (%)
Place of birth for the foreign-born population - Indonesia (%)
Place of birth for the foreign-born population - Laos (%)
Place of birth for the foreign-born population - Malaysia (%)
Place of birth for the foreign-born population - Philippines (%)
Place of birth for the foreign-born population - Singapore (%)
Place of birth for the foreign-born population - Thailand (%)
Place of birth for the foreign-born population - Vietnam (%)
Place of birth for the foreign-born population - Other South Eastern Asia (%)
Place of birth for the foreign-born population - Armenia (%)
Place of birth for the foreign-born population - Iraq (%)
Place of birth for the foreign-born population - Israel (%)
Place of birth for the foreign-born population - Jordan (%)
Place of birth for the foreign-born population - Kuwait (%)
Place of birth for the foreign-born population - Lebanon (%)
Place of birth for the foreign-born population - Saudi Arabia (%)
Place of birth for the foreign-born population - Syria (%)
Place of birth for the foreign-born population - Turkey (%)
Place of birth for the foreign-born population - Yemen (%)
Place of birth for the foreign-born population - Other Western Asia (%)
Place of birth for the foreign-born population - Eritrea (%)
Place of birth for the foreign-born population - Ethiopia (%)
Place of birth for the foreign-born population - Kenya (%)
Place of birth for the foreign-born population - Somalia (%)
Place of birth for the foreign-born population - Uganda (%)
Place of birth for the foreign-born population - Zimbabwe (%)
Place of birth for the foreign-born population - Other Eastern Africa (%)
Place of birth for the foreign-born population - Cameroon (%)
Place of birth for the foreign-born population - Congo (%)
Place of birth for the foreign-born population - Democratic Republic of Congo (Zaire) (%)
Place of birth for the foreign-born population - Other Middle Africa (%)
Place of birth for the foreign-born population - Egypt (%)
Place of birth for the foreign-born population - Morocco (%)
Place of birth for the foreign-born population - Sudan (%)
Place of birth for the foreign-born population - Other Northern Africa (%)
Place of birth for the foreign-born population - South Africa (%)
Place of birth for the foreign-born population - Other Southern Africa (%)
Place of birth for the foreign-born population - Cabo Verde (%)
Place of birth for the foreign-born population - Ghana (%)
Place of birth for the foreign-born population - Liberia (%)
Place of birth for the foreign-born population - Nigeria (%)
Place of birth for the foreign-born population - Senegal (%)
Place of birth for the foreign-born population - Sierra Leone (%)
Place of birth for the foreign-born population - Other Western Africa (%)
Place of birth for the foreign-born population - Australia (%)
Place of birth for the foreign-born population - New Zealand (%)
Place of birth for the foreign-born population - Fiji (%)
Place of birth for the foreign-born population - Micronesia (%)
Place of birth for the foreign-born population - Bahamas (%)
Place of birth for the foreign-born population - Barbados (%)
Place of birth for the foreign-born population - Cuba (%)
Place of birth for the foreign-born population - Dominica (%)
Place of birth for the foreign-born population - Dominican Republic (%)
Place of birth for the foreign-born population - Grenada (%)
Place of birth for the foreign-born population - Haiti (%)
Place of birth for the foreign-born population - Jamaica (%)
Place of birth for the foreign-born population - St. Vincent and the Grenadines (%)
Place of birth for the foreign-born population - Trinidad and Tobago (%)
Place of birth for the foreign-born population - West Indies (%)
Place of birth for the foreign-born population - Other Caribbean (%)
Place of birth for the foreign-born population - Belize (%)
Place of birth for the foreign-born population - Costa Rica (%)
Place of birth for the foreign-born population - El Salvador (%)
Place of birth for the foreign-born population - Guatemala (%)
Place of birth for the foreign-born population - Honduras (%)
Place of birth for the foreign-born population - Mexico (%)
Place of birth for the foreign-born population - Nicaragua (%)
Place of birth for the foreign-born population - Panama (%)
Place of birth for the foreign-born population - Other Central America (%)
Place of birth for the foreign-born population - Argentina (%)
Place of birth for the foreign-born population - Bolivia (%)
Place of birth for the foreign-born population - Brazil (%)
Place of birth for the foreign-born population - Chile (%)
Place of birth for the foreign-born population - Colombia (%)
Place of birth for the foreign-born population - Ecuador (%)
Place of birth for the foreign-born population - Guyana (%)
Place of birth for the foreign-born population - Peru (%)
Place of birth for the foreign-born population - Uruguay (%)
Place of birth for the foreign-born population - Venezuela (%)
Place of birth for the foreign-born population - Other South America (%)
Place of birth for the foreign-born population - Canada (%)
Place of birth for the foreign-born population - Other Northern America (%)
Place of birth for the foreign-born population - Other (%)
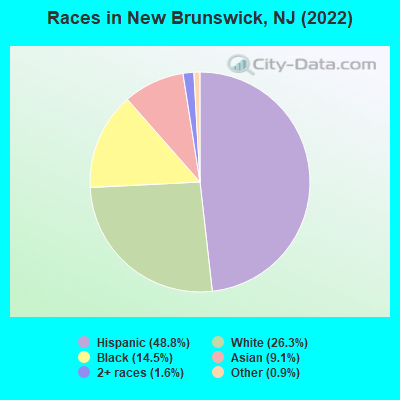
According to 2022 data, the most numerous races in New Brunswick, NJ are White alone (14,675 residents), Hispanic (27,231 residents), and Black alone (8,098 residents). 45.8% of New Brunswick residents speak English at home. 34.3% of New Brunswick, NJ residents are foreign-born (26.4% born in Latin America, 4.3% born in Asia), which is 32.9% greater than the foreign-born rate of 23.0% across the entire state of New Jersey.
Race distribution in New Brunswick
2000 2022
5,557,209 66.0% White alone 1,117,191 13.3% Hispanic 1,096,171 13.0% Black alone 477,012 5.7% Asian alone 133,689 1.6% Two or more races 19,565 0.2% Other race alone 11,338 0.1% American Indian alone 2,175 0.03% Native Hawaiian and Other
4,766,476 51.5% White alone 2,028,470 21.9% Hispanic 1,111,632 12.0% Black alone 923,546 10.0% Asian alone 332,237 3.6% Two or more races 89,847 1.0% Other race alone 8,557 0.09% American Indian alone 934 0.01% Native Hawaiian and Other
Income and house value in New Brunswick Median household income in 2022 $83,323 White non-Hispanic householders$45,318 Black householders$70,353 American Indian and Alaska Native householders$70,685 Asian householders$57,568 Some other race householders$54,264 Two or more races householders$53,787 Hispanic or Latino race householdersMedian 2022 house value $338,138 White Non-Hispanic householders$250,463 Black or African American householders $293,808 Asian householders$258,590 Some other race householders$265,486 Two or more races householders$271,643 Hispanic or Latino householders
Median age by race in New Brunswick
23.7 Median age for White residents23.3 24.0 32.6 Median age for Black or African American residents31.4 33.4 31.5 Median age for American Indian / Alaska Native residents29.3 34.5 22.2 Median age for Asian residents22.7 21.8 -939,393,938.5 Median age for Native Hawaiian / Pacific Islander residents-860,335,194.7 -713,070,378.3 29.0 Median age for Other race residents26.8 30.5 24.2 Median age for Two or more races residents24.8 23.3 21.5 Median age for White alone residents21.6 21.4 29.6 Median age for Hispanic or Latino residents30.0 29.8
Owner/renter occupied households by race in New Brunswick
House owners and renters - White residents 1,435 24.8% Owner occupied4,349 75.2% Renter occupiedHouse owners and renters - Black or African American residents 586 17.3% Owner occupied2,795 82.7% Renter occupiedHouse owners and renters - American Indian / Alaska Native residents 92 11.5% Owner occupied709 88.5% Renter occupiedHouse owners and renters - Asian residents 105 6.5% Owner occupied1,507 93.5% Renter occupiedHouse owners and renters - Other race residents 974 26.1% Owner occupied2,754 73.9% Renter occupiedHouse owners and renters - Two or more races residents 382 35.2% Owner occupied704 64.8% Renter occupiedHouse owners and renters - White alone residents 1,079 28.3% Owner occupied2,738 71.7% Renter occupiedHouse owners and renters - Hispanic or Latino residents 1,424 21.9% Owner occupied5,072 78.1% Renter occupied
Language usage in New Brunswick
English speakers - Total 45.8% of residents of New Brunswick speak English at home.
45.7% of residents speak Spanish at home 11,201 46.3% Speak English very well13,008 53.7% Speak English less than very well8.8% of residents speak other language at home 3,360 71.6% Speak English very well1,331 28.4% Speak English less than very well
English speakers - Born in the United States 81.2% of residents of New Brunswick speak English at home.
10.9% of residents speak Spanish at home 962 89.3% Speak English very well115 10.7% Speak English less than very well7.5% of residents speak other language at home 703 94.2% Speak English very well43 5.8% Speak English less than very well
English speakers - Native, born elsewhere 27.1% of residents of New Brunswick speak English at home.
67.6% of residents speak Spanish at home 690 68.4% Speak English very well319 31.6% Speak English less than very well4.5% of residents speak other language at home 67 100.0% Speak English very well
English speakers - Foreign-born 14.4% of residents of New Brunswick speak English at home.
77.0% of residents speak Spanish at home 2,936 19.5% Speak English very well12,082 80.5% Speak English less than very well15.6% of residents speak other language at home 1,787 58.6% Speak English very well1,263 41.4% Speak English less than very well
White (Caucasian) - Speak only English Native:
70.4% (11,008)Foreign-born:
17.2% (822)
White (Caucasian) - Speak another language Native:
20.3% (3,167)Foreign-born:
81.6% (3,902)
Black or African American - Speak only English Native:
95.6% (6,674)Foreign-born:
41.4% (535)
Black or African American - Speak another language Native:
4.8% (332)Foreign-born:
58.2% (750)
American Indian / Alaska Native - Speak only English Native:
9.9% (74)Foreign-born:
3.2% (83)
American Indian / Alaska Native - Speak another language Native:
100.0% (748)Foreign-born:
94.0% (2,398)
Asian - Speak only English Native:
61.7% (1,760)Foreign-born:
19.9% (446)
Asian - Speak another language Native:
37.6% (1,073)Foreign-born:
81.2% (1,822)
Other race - Speak only English Native:
23.5% (1,349)Foreign-born:
12.3% (1,114)
Other race - Speak another language Native:
74.6% (4,280)Foreign-born:
89.3% (8,110)
Two or more races - Speak only English Native:
45.3% (1,184)Foreign-born:
12.7% (259)
Two or more races - Speak another language Native:
55.3% (1,447)Foreign-born:
87.4% (1,786)
White alone - Speak only English Native:
81.7% (10,456)Foreign-born:
50.2% (701)
White alone - Speak another language Native:
14.8% (1,890)Foreign-born:
52.4% (731)
Hispanic or Latino - Speak only English Native:
18.1% (1,815)Foreign-born:
7.7% (1,225)
Hispanic or Latino - Speak another language Native:
79.5% (7,963)Foreign-born:
92.4% (14,772)
Foreign-born residents in New Brunswick 19,129 residents are foreign born (26.4% Latin America , 4.3% Asia ).
This city:
34.3%New Jersey:
23.2%
Marital status for residents in New Brunswick Marital status - White (Caucasian) population 15 years and over
Males 71.1% Never married23.5% Now married1.1% Separated0.3% Widowed4.0% DivorcedFemales 68.0% Never married21.8% Now married1.2% Separated4.1% Widowed5.0% DivorcedWomen who gave birth in the past 12 months Now married:
43.0% (28)Unmarried:
57.0% (37)
Women who did not give birth in the past 12 months Now married:
15.3% (1,052)Unmarried:
84.7% (5,800)
Marital status - Black or African American population 15 years and over
Males 65.8% Never married21.4% Now married0.8% Separated5.4% Widowed6.6% DivorcedFemales 61.6% Never married17.5% Now married4.4% Separated7.3% Widowed9.3% DivorcedWomen who gave birth in the past 12 months Now married:
16.4% (55)Unmarried:
83.6% (281)
Women who did not give birth in the past 12 months Now married:
18.1% (412)Unmarried:
81.9% (1,869)
Marital status - American Indian / Alaska Native population 15 years and over
Males 46.2% Never married44.1% Now married4.1% Separated0.0% Widowed5.6% DivorcedFemales 52.9% Never married32.6% Now married4.6% Separated2.3% Widowed7.5% DivorcedWomen who gave birth in the past 12 months Now married:
0.0% (0)Unmarried:
100.0% (25)
Women who did not give birth in the past 12 months Now married:
37.8% (262)Unmarried:
62.2% (432)
Marital status - Asian population 15 years and over
Males 85.9% Never married10.1% Now married0.0% Separated0.0% Widowed4.0% DivorcedFemales 85.8% Never married10.7% Now married0.8% Separated0.9% Widowed1.8% DivorcedWomen who gave birth in the past 12 months Now married:
100.0% (3)Unmarried:
0.0% (0)
Women who did not give birth in the past 12 months Now married:
7.7% (180)Unmarried:
92.3% (2,148)
Marital status - Other race population 15 years and over
Males 59.6% Never married30.7% Now married2.4% Separated1.0% Widowed6.3% DivorcedFemales 51.3% Never married37.6% Now married5.7% Separated1.1% Widowed4.3% DivorcedWomen who gave birth in the past 12 months Now married:
27.8% (42)Unmarried:
72.2% (110)
Women who did not give birth in the past 12 months Now married:
36.6% (1,365)Unmarried:
63.4% (2,359)
Marital status - Two or more races population 15 years and over
Males 54.1% Never married32.4% Now married2.6% Separated0.7% Widowed10.3% DivorcedFemales 62.5% Never married17.8% Now married4.0% Separated1.5% Widowed14.2% DivorcedWomen who gave birth in the past 12 months Now married:
52.7% (51)Unmarried:
47.3% (46)
Women who did not give birth in the past 12 months Now married:
19.4% (311)Unmarried:
80.6% (1,290)
Marital status - White alone, not Hispanic / Latino population 15 years and over
Males 76.8% Never married18.2% Now married0.5% Separated0.4% Widowed4.0% DivorcedFemales 72.0% Never married18.6% Now married0.4% Separated5.7% Widowed3.3% DivorcedWomen who gave birth in the past 12 months Now married:
100.0% (7)Unmarried:
0.0% (0)
Women who did not give birth in the past 12 months Now married:
12.7% (623)Unmarried:
87.3% (4,300)
Marital status - Hispanic or Latino population 15 years and over
Males 57.5% Never married32.8% Now married2.6% Separated0.7% Widowed6.4% DivorcedFemales 57.8% Never married29.4% Now married3.8% Separated1.4% Widowed7.6% DivorcedWomen who gave birth in the past 12 months Now married:
37.2% (101)Unmarried:
62.8% (170)
Women who did not give birth in the past 12 months Now married:
25.9% (1,976)Unmarried:
74.1% (5,652)
Ancestries in New Brunswick
1,803 5.8% American509 1.6% Italian242 0.8% Lebanese232 0.7% Hungarian229 0.7% Irish214 0.7% U.S. Virgin Islander198 0.6% Polish176 0.6% Jamaican167 0.5% English152 0.5% Russian141 0.5% Palestinian140 0.5% African128 0.4% German115 0.4% Ghanaian92 0.3% Brazilian92 0.3% Trinidadian and Tobagonian83 0.3% Portuguese65 0.2% Ukrainian62 0.2% Egyptian61 0.2% European56 0.2% Guyanese47 0.2% Iranian43 0.1% Barbadian36 0.1% Romanian28 0.09% Austrian28 0.09% Greek25 0.08% Haitian24 0.08% Danish22 0.07% Carpatho Rusyn22 0.07% Dutch22 0.07% Swedish19 0.06% British West Indian18 0.06% Albanian17 0.05% Czechoslovakian16 0.05% Israeli16 0.05% Turkish14 0.05% French Canadian11 0.04% Arab10 0.03% French10 0.03% Scottish9 0.03% Nigerian9 0.03% West Indian7 0.02% Eastern European6 0.02% Kenyan5 0.02% Lithuanian3 0.01% Syrian
Geographical mobility in New Brunswick Same house 1 year ago 17,604 81.7% White (Caucasian)7,109 80.6% Black or African American2,374 82.1% American Indian / Alaska Native3,003 58.7% Asian13,401 86.6% Other race4,429 88.0% Two or more races11,380 77.7% White alone, not Hispanic / Latino23,445 86.8% Hispanic or LatinoMoved within same county 872 4.0% White / Caucasian809 9.2% Black or African American628 21.7% American Indian / Alaska Native302 5.9% Asian547 3.5% Other race100 2.0% Two or more races547 3.7% White alone, not Hispanic / Latino1,281 4.7% Hispanic or LatinoMoved within same state 1,229 5.7% White / Caucasian330 3.7% Black or African American486 9.5% Asian318 2.1% Other race153 3.0% Two or more races1,041 7.1% White alone, not Hispanic / Latino614 2.3% Hispanic or LatinoMoved from different state 1,482 6.9% White / Caucasian726 8.2% Black or African American581 11.4% Asian428 2.8% Other race107 2.1% Two or more races1,380 9.4% White alone, not Hispanic / Latino842 3.1% Hispanic or LatinoMoved from abroad 143 0.7% White90 1.0% Black or African American230 4.5% Asian1,104 7.1% Other race152 3.0% Two or more races150 1.0% White alone, not Hispanic / Latino1,050 3.9% Hispanic or Latino
Children Nativity (place of birth) in New Brunswick
Children under 6 years - Living with two parents Both parents native 262 100.0% NativeBoth parents foreign-born 722 97.3% Native20 2.7% Foreign-bornOne native, one foreign-born parent 253 89.1% Native31 10.9% Foreign-bornChildren under 6 years - Living with one parent Native parent 705 100.0% NativeForeign-born parent 1,028 92.0% Native90 8.0% Foreign-bornChildren 6 to 17 years - Living with two parents Both parents native 605 100.0% NativeBoth parents foreign-born 2,087 95.3% Native103 4.7% Foreign-bornOne native, one foreign-born parent 605 100.0% NativeChildren 6 to 17 years - Living with one parent Native parent 297 100.0% NativeForeign-born parent 3,271 56.7% Native2,495 43.3% Foreign-born
Place of birth for residents in New Brunswick 15,560 Americas14,967 Latin America8,561 Central America5,130 Caribbean2,461 Asia1,297 Eastern Asia1,275 South America1,155 China618 Europe594 South Central Asia592 Northern America477 Africa435 Eastern Europe396 Western Africa331 South Eastern Asia237 Western Asia91 Southern Europe90 Western Europe80 Eastern Africa11 Oceania11 Australia and New Zealand Subregion1 Northern Europe1 Northern Africa6,086 Mexico4,657 Dominican Republic1,462 Honduras1,011 China592 Canada523 India418 Guatemala406 Ecuador288 El Salvador271 Peru253 Guyana247 Philippines238 Colombia206 Nigeria191 Nicaragua144 Taiwan141 Korea127 Russia114 Ghana113 Panama112 Cuba111 Poland103 Barbados90 Germany82 Lebanon74 Ukraine69 Hungary65 Turkey61 Trinidad and Tobago52 Liberia51 Argentina49 Dominica44 Haiti42 Portugal42 Jamaica41 Vietnam33 Pakistan33 Romania32 Singapore31 Grenada27 Zimbabwe27 Iran26 Spain22 Sierra Leone21 St. Lucia19 Albania17 Brazil15 Kuwait14 Israel12 Greece11 Australia10 Italy10 Bangladesh9 Burma (Myanmar)7 Kenya3 Georgia1 Egypt1 Indonesia1 England
Grandparents responsible for own grandchildren in New Brunswick
Grandparents (30 to 59 years) White / Caucasian 32 100.0% Not responsible for grandchildrenBlack or African American 109 60.7% Responsible for grandchildren71 39.3% Not responsible for grandchildrenAmerican Indian / Alaska Native 32 18.5% Responsible for grandchildren139 81.5% Not responsible for grandchildrenOther race 66 28.1% Responsible for grandchildren169 71.9% Not responsible for grandchildrenTwo or more races 10 100.0% Not responsible for grandchildrenHispanic or Latino 139 32.5% Responsible for grandchildren289 67.5% Not responsible for grandchildrenGrandparents (60 years and over) White / Caucasian 87 44.4% Responsible for grandchildren109 55.6% Not responsible for grandchildrenBlack or African American 95 54.0% Responsible for grandchildren81 46.0% Not responsible for grandchildrenAmerican Indian / Alaska Native 44 100.0% Not responsible for grandchildrenOther race 197 100.0% Not responsible for grandchildrenTwo or more races 54 100.0% Not responsible for grandchildrenHispanic or Latino 80 17.9% Responsible for grandchildren366 82.1% Not responsible for grandchildren