Races in McAllen, Texas (TX) Detailed Stats
Data:
Races - White alone (%)
Races - White alone (% change since 2000)
Races - Black alone (%)
Races - Black alone (% change since 2000)
Races - American Indian alone (%)
Races - American Indian alone (% change since 2000)
Races - Asian alone (%)
Races - Asian alone (% change since 2000)
Races - Hispanic (%)
Races - Hispanic (% change since 2000)
Races - Native Hawaiian and Other Pacific Islander alone (%)
Races - Native Hawaiian and Other Pacific Islander alone (% change since 2000)
Races - Two or more races(%)
Races - Two or more races(% change since 2000)
Races - Other race alone (%)
Races - Other race alone (% change since 2000)
Racial diversity
Place of birth - Born in state of residence (%)
Place of birth - Born in state of residence (%) - White
Place of birth - Born in state of residence (%) - Black or African American
Place of birth - Born in state of residence (%) - Asian
Place of birth - Born in state of residence (%) - Hispanic or Latino
Place of birth - Born in state of residence (%) - American Indian and Alaska Native
Place of birth - Born in state of residence (%) - Multirace
Place of birth - Born in state of residence (%) - Other Race
Place of birth - Born in other state (%)
Place of birth - Born in other state (%) - White
Place of birth - Born in other state (%) - Black or African American
Place of birth - Born in other state (%) - Asian
Place of birth - Born in other state (%) - Hispanic or Latino
Place of birth - Born in other state (%) - American Indian and Alaska Native
Place of birth - Born in other state (%) - Multirace
Place of birth - Born in other state (%) - Other Race
Place of birth - Native, outside of US (%)
Place of birth - Native, outside of US (%) - White
Place of birth - Native, outside of US (%) - Black or African American
Place of birth - Native, outside of US (%) - Asian
Place of birth - Native, outside of US (%) - Hispanic or Latino
Place of birth - Native, outside of US (%) - American Indian and Alaska Native
Place of birth - Native, outside of US (%) - Multirace
Place of birth - Native, outside of US (%) - Other Race
Place of birth - Foreign born (%)
Place of birth - Foreign born (%) - White
Place of birth - Foreign born (%) - Black or African American
Place of birth - Foreign born (%) - Asian
Place of birth - Foreign born (%) - Hispanic or Latino
Place of birth - Foreign born (%) - American Indian and Alaska Native
Place of birth - Foreign born (%) - Multirace
Place of birth - Foreign born (%) - Other Race
Residents speaking English at home (%)
Residents speaking English at home - Born in the United States (%)
Residents speaking English at home - Native, born elsewhere (%)
Residents speaking English at home - Foreign born (%)
Residents speaking Spanish at home (%)
Residents speaking Spanish at home - Born in the United States (%)
Residents speaking Spanish at home - Native, born elsewhere (%)
Residents speaking Spanish at home - Foreign born (%)
Residents speaking other language at home (%)
Residents speaking other language at home - Born in the United States (%)
Residents speaking other language at home - Native, born elsewhere (%)
Residents speaking other language at home - Foreign born (%)
Marital status - Never married (%)
Marital status - Now married (%)
Marital status - Separated (%)
Marital status - Widowed (%)
Marital status - Divorced (%)
Ancestries Reported - Arab (%)
Ancestries Reported - Czech (%)
Ancestries Reported - Danish (%)
Ancestries Reported - Dutch (%)
Ancestries Reported - English (%)
Ancestries Reported - French (%)
Ancestries Reported - French Canadian (%)
Ancestries Reported - German (%)
Ancestries Reported - Greek (%)
Ancestries Reported - Hungarian (%)
Ancestries Reported - Irish (%)
Ancestries Reported - Italian (%)
Ancestries Reported - Lithuanian (%)
Ancestries Reported - Norwegian (%)
Ancestries Reported - Polish (%)
Ancestries Reported - Portuguese (%)
Ancestries Reported - Russian (%)
Ancestries Reported - Scotch-Irish (%)
Ancestries Reported - Scottish (%)
Ancestries Reported - Slovak (%)
Ancestries Reported - Subsaharan African (%)
Ancestries Reported - Swedish (%)
Ancestries Reported - Swiss (%)
Ancestries Reported - Ukrainian (%)
Ancestries Reported - United States (%)
Ancestries Reported - Welsh (%)
Ancestries Reported - West Indian (%)
Ancestries Reported - Other (%)
Geographical mobility - Same house 1 year ago (%)
Geographical mobility - Same house 1 year ago (%) - White
Geographical mobility - Same house 1 year ago (%) - Black or African American
Geographical mobility - Same house 1 year ago (%) - Asian
Geographical mobility - Same house 1 year ago (%) - Hispanic or Latino
Geographical mobility - Same house 1 year ago (%) - American Indian and Alaska Native
Geographical mobility - Same house 1 year ago (%) - Multirace
Geographical mobility - Same house 1 year ago (%) - Other Race
Geographical mobility - Moved within same county (%)
Geographical mobility - Moved within same county (%) - White
Geographical mobility - Moved within same county (%) - Black or African American
Geographical mobility - Moved within same county (%) - Asian
Geographical mobility - Moved within same county (%) - Hispanic or Latino
Geographical mobility - Moved within same county (%) - American Indian and Alaska Native
Geographical mobility - Moved within same county (%) - Multirace
Geographical mobility - Moved within same county (%) - Other Race
Geographical mobility - Moved from different county within same state (%)
Geographical mobility - Moved from different county within same state (%) - White
Geographical mobility - Moved from different county within same state (%) - Black or African American
Geographical mobility - Moved from different county within same state (%) - Asian
Geographical mobility - Moved from different county within same state (%) - Hispanic or Latino
Geographical mobility - Moved from different county within same state (%) - American Indian and Alaska Native
Geographical mobility - Moved from different county within same state (%) - Multirace
Geographical mobility - Moved from different county within same state (%) - Other Race
Geographical mobility - Moved from different state (%)
Geographical mobility - Moved from different state (%) - White
Geographical mobility - Moved from different state (%) - Black or African American
Geographical mobility - Moved from different state (%) - Asian
Geographical mobility - Moved from different state (%) - Hispanic or Latino
Geographical mobility - Moved from different state (%) - American Indian and Alaska Native
Geographical mobility - Moved from different state (%) - Multirace
Geographical mobility - Moved from different state (%) - Other Race
Geographical mobility - Moved from abroad (%)
Geographical mobility - Moved from abroad (%) - White
Geographical mobility - Moved from abroad (%) - Black or African American
Geographical mobility - Moved from abroad (%) - Asian
Geographical mobility - Moved from abroad (%) - Hispanic or Latino
Geographical mobility - Moved from abroad (%) - American Indian and Alaska Native
Geographical mobility - Moved from abroad (%) - Multirace
Geographical mobility - Moved from abroad (%) - Other Race
Place of birth for the foreign-born population - Ireland (%)
Place of birth for the foreign-born population - Denmark (%)
Place of birth for the foreign-born population - Norway (%)
Place of birth for the foreign-born population - Sweden (%)
Place of birth for the foreign-born population - United Kingdom (%)
Place of birth for the foreign-born population - England (%)
Place of birth for the foreign-born population - Scotland (%)
Place of birth for the foreign-born population - Other Northern Europe (%)
Place of birth for the foreign-born population - Austria (%)
Place of birth for the foreign-born population - Belgium (%)
Place of birth for the foreign-born population - France (%)
Place of birth for the foreign-born population - Germany (%)
Place of birth for the foreign-born population - Netherlands (%)
Place of birth for the foreign-born population - Switzerland (%)
Place of birth for the foreign-born population - Other Western Europe (%)
Place of birth for the foreign-born population - Greece (%)
Place of birth for the foreign-born population - Italy (%)
Place of birth for the foreign-born population - Portugal (%)
Place of birth for the foreign-born population - Spain (%)
Place of birth for the foreign-born population - Other Southern Europe (%)
Place of birth for the foreign-born population - Albania (%)
Place of birth for the foreign-born population - Belarus (%)
Place of birth for the foreign-born population - Bosnia and Herzegovina (%)
Place of birth for the foreign-born population - Bulgaria (%)
Place of birth for the foreign-born population - Croatia (%)
Place of birth for the foreign-born population - Czechoslovakia (%)
Place of birth for the foreign-born population - Hungary (%)
Place of birth for the foreign-born population - Latvia (%)
Place of birth for the foreign-born population - Lithuania (%)
Place of birth for the foreign-born population - North Macedonia (Macedonia) (%)
Place of birth for the foreign-born population - Moldova (%)
Place of birth for the foreign-born population - Poland (%)
Place of birth for the foreign-born population - Romania (%)
Place of birth for the foreign-born population - Russia (%)
Place of birth for the foreign-born population - Serbia (%)
Place of birth for the foreign-born population - Ukraine (%)
Place of birth for the foreign-born population - Other Eastern Europe (%)
Place of birth for the foreign-born population - China (%)
Place of birth for the foreign-born population - Hong Kong (%)
Place of birth for the foreign-born population - Taiwan (%)
Place of birth for the foreign-born population - Japan (%)
Place of birth for the foreign-born population - Korea (%)
Place of birth for the foreign-born population - Other Eastern Asia (%)
Place of birth for the foreign-born population - Afghanistan (%)
Place of birth for the foreign-born population - Bangladesh (%)
Place of birth for the foreign-born population - India (%)
Place of birth for the foreign-born population - Iran (%)
Place of birth for the foreign-born population - Kazakhstan (%)
Place of birth for the foreign-born population - Nepal (%)
Place of birth for the foreign-born population - Pakistan (%)
Place of birth for the foreign-born population - Sri Lanka (%)
Place of birth for the foreign-born population - Uzbekistan (%)
Place of birth for the foreign-born population - Other South Central Asia (%)
Place of birth for the foreign-born population - Burma (%)
Place of birth for the foreign-born population - Cambodia (%)
Place of birth for the foreign-born population - Indonesia (%)
Place of birth for the foreign-born population - Laos (%)
Place of birth for the foreign-born population - Malaysia (%)
Place of birth for the foreign-born population - Philippines (%)
Place of birth for the foreign-born population - Singapore (%)
Place of birth for the foreign-born population - Thailand (%)
Place of birth for the foreign-born population - Vietnam (%)
Place of birth for the foreign-born population - Other South Eastern Asia (%)
Place of birth for the foreign-born population - Armenia (%)
Place of birth for the foreign-born population - Iraq (%)
Place of birth for the foreign-born population - Israel (%)
Place of birth for the foreign-born population - Jordan (%)
Place of birth for the foreign-born population - Kuwait (%)
Place of birth for the foreign-born population - Lebanon (%)
Place of birth for the foreign-born population - Saudi Arabia (%)
Place of birth for the foreign-born population - Syria (%)
Place of birth for the foreign-born population - Turkey (%)
Place of birth for the foreign-born population - Yemen (%)
Place of birth for the foreign-born population - Other Western Asia (%)
Place of birth for the foreign-born population - Eritrea (%)
Place of birth for the foreign-born population - Ethiopia (%)
Place of birth for the foreign-born population - Kenya (%)
Place of birth for the foreign-born population - Somalia (%)
Place of birth for the foreign-born population - Uganda (%)
Place of birth for the foreign-born population - Zimbabwe (%)
Place of birth for the foreign-born population - Other Eastern Africa (%)
Place of birth for the foreign-born population - Cameroon (%)
Place of birth for the foreign-born population - Congo (%)
Place of birth for the foreign-born population - Democratic Republic of Congo (Zaire) (%)
Place of birth for the foreign-born population - Other Middle Africa (%)
Place of birth for the foreign-born population - Egypt (%)
Place of birth for the foreign-born population - Morocco (%)
Place of birth for the foreign-born population - Sudan (%)
Place of birth for the foreign-born population - Other Northern Africa (%)
Place of birth for the foreign-born population - South Africa (%)
Place of birth for the foreign-born population - Other Southern Africa (%)
Place of birth for the foreign-born population - Cabo Verde (%)
Place of birth for the foreign-born population - Ghana (%)
Place of birth for the foreign-born population - Liberia (%)
Place of birth for the foreign-born population - Nigeria (%)
Place of birth for the foreign-born population - Senegal (%)
Place of birth for the foreign-born population - Sierra Leone (%)
Place of birth for the foreign-born population - Other Western Africa (%)
Place of birth for the foreign-born population - Australia (%)
Place of birth for the foreign-born population - New Zealand (%)
Place of birth for the foreign-born population - Fiji (%)
Place of birth for the foreign-born population - Micronesia (%)
Place of birth for the foreign-born population - Bahamas (%)
Place of birth for the foreign-born population - Barbados (%)
Place of birth for the foreign-born population - Cuba (%)
Place of birth for the foreign-born population - Dominica (%)
Place of birth for the foreign-born population - Dominican Republic (%)
Place of birth for the foreign-born population - Grenada (%)
Place of birth for the foreign-born population - Haiti (%)
Place of birth for the foreign-born population - Jamaica (%)
Place of birth for the foreign-born population - St. Vincent and the Grenadines (%)
Place of birth for the foreign-born population - Trinidad and Tobago (%)
Place of birth for the foreign-born population - West Indies (%)
Place of birth for the foreign-born population - Other Caribbean (%)
Place of birth for the foreign-born population - Belize (%)
Place of birth for the foreign-born population - Costa Rica (%)
Place of birth for the foreign-born population - El Salvador (%)
Place of birth for the foreign-born population - Guatemala (%)
Place of birth for the foreign-born population - Honduras (%)
Place of birth for the foreign-born population - Mexico (%)
Place of birth for the foreign-born population - Nicaragua (%)
Place of birth for the foreign-born population - Panama (%)
Place of birth for the foreign-born population - Other Central America (%)
Place of birth for the foreign-born population - Argentina (%)
Place of birth for the foreign-born population - Bolivia (%)
Place of birth for the foreign-born population - Brazil (%)
Place of birth for the foreign-born population - Chile (%)
Place of birth for the foreign-born population - Colombia (%)
Place of birth for the foreign-born population - Ecuador (%)
Place of birth for the foreign-born population - Guyana (%)
Place of birth for the foreign-born population - Peru (%)
Place of birth for the foreign-born population - Uruguay (%)
Place of birth for the foreign-born population - Venezuela (%)
Place of birth for the foreign-born population - Other South America (%)
Place of birth for the foreign-born population - Canada (%)
Place of birth for the foreign-born population - Other Northern America (%)
Place of birth for the foreign-born population - Other (%)
Latest news about races in McAllen, TX collected exclusively by city-data.com from local newspapers, TV, and radio stations
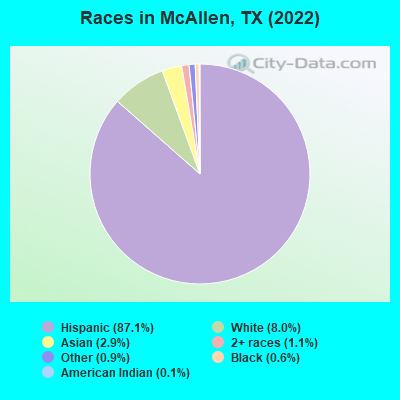
According to 2022 data, the most numerous races in McAllen, TX are Hispanic (126,429 residents), White alone (11,645 residents), and Black alone (862 residents). 24.5% of McAllen residents speak English at home. 25.8% of McAllen, TX residents are foreign-born (23.1% born in Latin America), which is 34.1% greater than the foreign-born rate of 17.0% across the entire state of Texas.
Race distribution in McAllen
2000 2022
10,933,313 52.4% White alone 6,669,666 32.0% Hispanic 2,364,255 11.3% Black alone 554,445 2.7% Asian alone 230,567 1.1% Two or more races 68,859 0.3% American Indian alone 19,958 0.10% Other race alone 10,757 0.05% Native Hawaiian and Other
12,070,642 40.2% Hispanic 11,683,430 38.9% White alone 3,508,706 11.7% Black alone 1,608,173 5.4% Asian alone 956,560 3.2% Two or more races 125,763 0.4% Other race alone 47,023 0.2% American Indian alone 29,275 0.10% Native Hawaiian and Other
Income and house value in McAllen Median household income in 2022 $75,186 White non-Hispanic householders$90,743 Black householdersover $200,000 American Indian and Alaska Native householders$125,241 Asian householders$31,263 Some other race householders$60,492 Two or more races householders$51,345 Hispanic or Latino race householdersMedian 2022 house value $224,721 White Non-Hispanic householders$247,145 Black or African American householders$170,228 American Indian or Alaska Native householders $239,670 Asian householders$151,662 Some other race householders$137,678 Two or more races householders$158,896 Hispanic or Latino householders
Median age by race in McAllen
31.7 Median age for White residents30.1 34.0 17.9 Median age for Black or African American residents18.8 20.2 20.2 Median age for American Indian / Alaska Native residents14.6 45.8 41.1 Median age for Asian residents34.6 47.5 -666,666,666.0 Median age for Native Hawaiian / Pacific Islander residents-666,666,666.0 -666,666,666.0 40.8 Median age for Other race residents35.2 46.4 34.3 Median age for Two or more races residents32.4 37.2 45.2 Median age for White alone residents44.6 50.1 32.8 Median age for Hispanic or Latino residents30.3 37.1
Owner/renter occupied households by race in McAllen
House owners and renters - White residents 11,697 57.9% Owner occupied8,501 42.1% Renter occupiedHouse owners and renters - Black or African American residents 136 37.4% Owner occupied228 62.6% Renter occupiedHouse owners and renters - American Indian / Alaska Native residents 160 76.6% Owner occupied49 23.4% Renter occupiedHouse owners and renters - Asian residents 1,111 80.6% Owner occupied268 19.4% Renter occupiedHouse owners and renters - Native Hawaiian / Pacific Islander residents 5 14.4% Owner occupied28 85.6% Renter occupiedHouse owners and renters - Other race residents 4,711 53.5% Owner occupied4,092 46.5% Renter occupiedHouse owners and renters - Two or more races residents 12,879 68.3% Owner occupied5,991 31.7% Renter occupiedHouse owners and renters - White alone residents 4,115 64.0% Owner occupied2,314 36.0% Renter occupiedHouse owners and renters - Hispanic or Latino residents 24,363 59.9% Owner occupied16,338 40.1% Renter occupied
Language usage in McAllen
English speakers - Total 24.5% of residents of McAllen speak English at home.
72.8% of residents speak Spanish at home 65,139 66.1% Speak English very well33,420 33.9% Speak English less than very well2.8% of residents speak other language at home 2,563 68.7% Speak English very well1,170 31.3% Speak English less than very well
English speakers - Born in the United States 65.3% of residents of McAllen speak English at home.
33.8% of residents speak Spanish at home 4,183 81.3% Speak English very well962 18.7% Speak English less than very well0.9% of residents speak other language at home 81 61.8% Speak English very well50 38.2% Speak English less than very well
English speakers - Native, born elsewhere 13.6% of residents of McAllen speak English at home.
75.7% of residents speak Spanish at home 1,133 87.4% Speak English very well163 12.6% Speak English less than very well10.7% of residents speak other language at home 24 13.1% Speak English very well159 86.9% Speak English less than very well
English speakers - Foreign-born 6.4% of residents of McAllen speak English at home.
84.6% of residents speak Spanish at home 9,299 32.0% Speak English very well19,736 68.0% Speak English less than very well9.0% of residents speak other language at home 2,271 73.5% Speak English very well819 26.5% Speak English less than very well
White (Caucasian) - Speak only English Native:
33.4% (16,539)Foreign-born:
18.9% (988)
White (Caucasian) - Speak another language Native:
66.6% (33,045)Foreign-born:
81.1% (4,240)
Black or African American - Speak only English Native:
96.0% (1,077)Foreign-born:
21.0% (55)
Black or African American - Speak another language Native:
4.0% (45)Foreign-born:
80.8% (211)
American Indian / Alaska Native - Speak another language Native:
58.6% (337)Foreign-born:
98.9% (167)
Asian - Speak only English Native:
76.9% (527)Foreign-born:
15.4% (514)
Asian - Speak another language Native:
23.1% (158)Foreign-born:
84.6% (2,814)
Other race - Speak only English Native:
19.0% (1,463)Foreign-born:
1.2% (161)
Other race - Speak another language Native:
81.0% (6,231)Foreign-born:
98.8% (13,152)
Two or more races - Speak only English Native:
28.2% (11,960)Foreign-born:
2.1% (254)
Two or more races - Speak another language Native:
71.8% (30,478)Foreign-born:
97.9% (11,762)
White alone - Speak only English Native:
82.8% (8,994)Foreign-born:
18.9% (61)
White alone - Speak another language Native:
17.2% (1,863)Foreign-born:
92.9% (298)
Hispanic or Latino - Speak only English Native:
20.7% (17,873)Foreign-born:
4.7% (1,403)
Hispanic or Latino - Speak another language Native:
79.3% (68,394)Foreign-born:
95.3% (28,656)
Foreign-born residents in McAllen 37,448 residents are foreign born (23.1% Latin America ).
This city:
25.8%Texas:
17.1%
Marital status for residents in McAllen Marital status - White (Caucasian) population 15 years and over
Males 43.3% Never married44.3% Now married2.4% Separated2.0% Widowed8.0% DivorcedFemales 32.6% Never married46.2% Now married3.9% Separated6.3% Widowed10.9% DivorcedWomen who gave birth in the past 12 months Now married:
100.0% (556)Unmarried:
0.0% (0)
Women who did not give birth in the past 12 months Now married:
40.0% (4,936)Unmarried:
60.0% (7,414)
Marital status - Black or African American population 15 years and over
Males 52.1% Never married24.7% Now married0.0% Separated0.0% Widowed23.1% DivorcedFemales 28.0% Never married52.7% Now married0.0% Separated11.0% Widowed8.3% DivorcedWomen who did not give birth in the past 12 months Now married:
65.3% (160)Unmarried:
34.7% (85)
Marital status - American Indian / Alaska Native population 15 years and over
Males 60.2% Never married31.2% Now married0.0% Separated0.0% Widowed8.5% DivorcedFemales 34.4% Never married40.5% Now married6.5% Separated11.1% Widowed7.6% DivorcedWomen who gave birth in the past 12 months Now married:
100.0% (20)Unmarried:
0.0% (0)
Women who did not give birth in the past 12 months Now married:
49.7% (113)Unmarried:
50.3% (115)
Marital status - Asian population 15 years and over
Males 37.3% Never married60.1% Now married0.0% Separated1.5% Widowed1.2% DivorcedFemales 27.3% Never married62.3% Now married1.9% Separated5.6% Widowed3.0% DivorcedWomen who gave birth in the past 12 months Now married:
100.0% (9)Unmarried:
0.0% (0)
Women who did not give birth in the past 12 months Now married:
52.9% (545)Unmarried:
47.1% (485)
Marital status - Native Hawaiian / Pacific Islander population 15 years and over
Males 0.0% Never married88.0% Now married0.0% Separated0.0% Widowed12.0% DivorcedFemales 0.0% Never married100.0% Now married0.0% Separated0.0% Widowed0.0% DivorcedMarital status - Other race population 15 years and over
Males 28.2% Never married64.3% Now married0.0% Separated1.0% Widowed6.6% DivorcedFemales 21.7% Never married47.0% Now married3.7% Separated14.8% Widowed12.7% DivorcedWomen who gave birth in the past 12 months Now married:
64.5% (249)Unmarried:
35.5% (137)
Women who did not give birth in the past 12 months Now married:
53.6% (2,767)Unmarried:
46.4% (2,394)
Marital status - Two or more races population 15 years and over
Males 40.3% Never married50.1% Now married1.6% Separated1.7% Widowed6.4% DivorcedFemales 37.1% Never married43.8% Now married3.0% Separated8.2% Widowed7.9% DivorcedWomen who gave birth in the past 12 months Now married:
91.5% (767)Unmarried:
8.5% (71)
Women who did not give birth in the past 12 months Now married:
36.8% (5,153)Unmarried:
63.2% (8,865)
Marital status - White alone, not Hispanic / Latino population 15 years and over
Males 30.9% Never married56.2% Now married1.5% Separated3.5% Widowed7.9% DivorcedFemales 21.3% Never married57.7% Now married0.7% Separated9.2% Widowed11.0% DivorcedWomen who gave birth in the past 12 months Now married:
100.0% (125)Unmarried:
0.0% (0)
Women who did not give birth in the past 12 months Now married:
57.2% (1,300)Unmarried:
42.8% (973)
Marital status - Hispanic or Latino population 15 years and over
Males 41.4% Never married48.9% Now married1.5% Separated1.4% Widowed6.9% DivorcedFemales 34.0% Never married43.6% Now married3.9% Separated8.6% Widowed10.0% DivorcedWomen who gave birth in the past 12 months Now married:
87.4% (1,447)Unmarried:
12.6% (208)
Women who did not give birth in the past 12 months Now married:
39.0% (11,346)Unmarried:
61.0% (17,730)
Ancestries in McAllen
2,776 2.5% American1,472 1.3% English877 0.8% German505 0.5% Italian494 0.4% Irish226 0.2% Polish167 0.1% French106 0.09% Nigerian90 0.08% European76 0.07% Lebanese61 0.05% Canadian52 0.05% Russian50 0.04% Arab41 0.04% Scottish36 0.03% Iranian35 0.03% Scotch-Irish30 0.03% Eastern European29 0.03% Danish28 0.03% Ukrainian26 0.02% Hungarian26 0.02% Romanian24 0.02% Czechoslovakian24 0.02% Swedish22 0.02% Portuguese21 0.02% Australian21 0.02% French Canadian17 0.02% Brazilian15 0.01% Yugoslavian14 0.01% Syrian14 0.01% Czech13 0.01% Austrian13 0.01% Dutch9 0.01% Scandinavian8 0.01% Carpatho Rusyn6 0.01% British6 0.01% Welsh
Geographical mobility in McAllen Same house 1 year ago 49,830 85.7% White (Caucasian)1,299 87.6% Black or African American822 100.0% American Indian / Alaska Native3,940 90.7% Asian4 8.4% Native Hawaiian / Pacific Islander19,026 88.4% Other race52,049 90.7% Two or more races10,289 89.2% White alone, not Hispanic / Latino108,837 89.0% Hispanic or LatinoMoved within same county 6,434 11.1% White / Caucasian153 10.3% Black or African American114 2.6% Asian1,631 7.6% Other race3,651 6.4% Two or more races668 5.8% White alone, not Hispanic / Latino10,613 8.7% Hispanic or LatinoMoved within same state 787 1.4% White / Caucasian34 0.8% Asian123 0.6% Other race229 0.4% Two or more races275 2.4% White alone, not Hispanic / Latino964 0.8% Hispanic or LatinoMoved from different state 1,102 1.9% White / Caucasian25 1.7% Black or African American75 100.0% Native Hawaiian / Pacific Islander69 0.3% Other race362 0.6% Two or more races400 3.5% White alone, not Hispanic / Latino554 0.5% Hispanic or LatinoMoved from abroad 25 0.0% White246 5.7% Asian682 3.2% Other race1,088 1.9% Two or more races19 0.2% White alone, not Hispanic / Latino1,379 1.1% Hispanic or Latino
Children Nativity (place of birth) in McAllen
Children under 6 years - Living with two parents Both parents native 5,521 100.0% NativeBoth parents foreign-born 1,130 100.0% NativeOne native, one foreign-born parent 1,466 100.0% NativeChildren under 6 years - Living with one parent Native parent 1,937 100.0% NativeForeign-born parent 504 100.0% NativeChildren 6 to 17 years - Living with two parents Both parents native 6,389 99.5% Native33 0.5% Foreign-bornBoth parents foreign-born 5,798 92.9% Native442 7.1% Foreign-bornOne native, one foreign-born parent 2,697 98.8% Native33 1.2% Foreign-bornChildren 6 to 17 years - Living with one parent Native parent 6,732 100.0% NativeForeign-born parent 2,927 57.4% Native2,174 42.6% Foreign-born
Grandparents responsible for own grandchildren in McAllen
Grandparents (30 to 59 years) White / Caucasian 62 20.6% Responsible for grandchildren240 79.4% Not responsible for grandchildrenOther race 205 60.1% Responsible for grandchildren136 39.9% Not responsible for grandchildrenTwo or more races 217 33.6% Responsible for grandchildren429 66.4% Not responsible for grandchildrenWhite alone, not Hispanic / Latino 5 15.8% Responsible for grandchildren27 84.2% Not responsible for grandchildrenHispanic or Latino 630 31.0% Responsible for grandchildren1,399 69.0% Not responsible for grandchildrenGrandparents (60 years and over) White / Caucasian 85 13.2% Responsible for grandchildren556 86.8% Not responsible for grandchildrenOther race 128 26.7% Responsible for grandchildren352 73.3% Not responsible for grandchildrenTwo or more races 265 25.2% Responsible for grandchildren788 74.8% Not responsible for grandchildrenWhite alone, not Hispanic / Latino 24 50.8% Responsible for grandchildren23 49.2% Not responsible for grandchildrenHispanic or Latino 265 11.3% Responsible for grandchildren2,080 88.7% Not responsible for grandchildren