Races in Makawao, Hawaii (HI) Detailed Stats
Ancestries, Foreign-born residents, place of birth
Settings
X


Recent posts about races in Makawao, Hawaii on our local forum with over 2,400,000 registered users:
 | To buy a house in Makawao or Pukalani - ? (8 replies) |
| Things I found out during my house hunting trip this week.... (22 replies) |
| Makawao vs. Kihei/Wailea (11 replies) |
| Elementary schools on maui (9 replies) |
| A Maui move or not - at our age we can't afford to make a mistake! (53 replies) |
| Moving to Maui with children? (41 replies) |
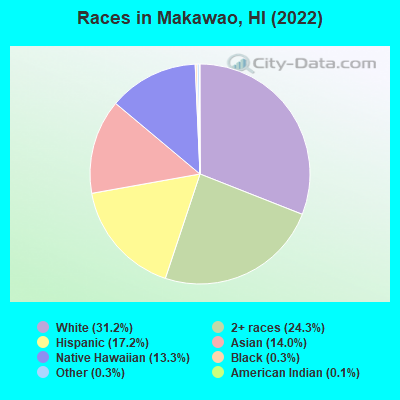
According to 2022 data, the most numerous races in Makawao, HI are Asian alone (1,077 residents), Two or more races (1,870 residents), and White alone (2,399 residents). 93.6% of Makawao residents speak English at home. 6.0% of Makawao, HI residents are foreign-born (3.2% born in Asia, 0.9% born in Latin America, 0.7% born in Oceania), which is 202.0% less than the foreign-born rate of 18.0% across the entire state of Hawaii.
Race distribution in Makawao
2000
2022

- 2,40238.0%White alone
- 1,60825.4%Two or more races
- 1,02516.2%Asian alone
- 75511.9%Hispanic
- 4757.5%Native Hawaiian and Other
Pacific Islander alone - 230.4%American Indian alone
- 200.3%Black alone
- 190.3%Other race alone

-
- 2,39931.2%White alone
- 1,87024.3%Two or more races
- 1,32217.2%Hispanic
- 1,07714.0%Asian alone
- 1,01913.3%Native Hawaiian and Other
Pacific Islander alone - 210.3%Black alone
- 210.3%Other race alone
- 80.1%American Indian alone
2000
2022
-
- 494,14940.8%Asian alone
- 277,09122.9%White alone
- 218,70018.1%Two or more races
- 108,4419.0%Native Hawaiian and Other
Pacific Islander alone - 87,6997.2%Hispanic
- 20,8291.7%Black alone
- 2,0890.2%Other race alone
- 2,5390.2%American Indian alone

-
- 498,12534.6%Asian alone
- 318,57422.1%Two or more races
- 297,93720.7%White alone
- 160,10311.1%Hispanic
- 134,5679.3%Native Hawaiian and Other
Pacific Islander alone - 23,6821.6%Black alone
- 5,3780.4%Other race alone
- 1,8300.1%American Indian alone

Income and house value in Makawao
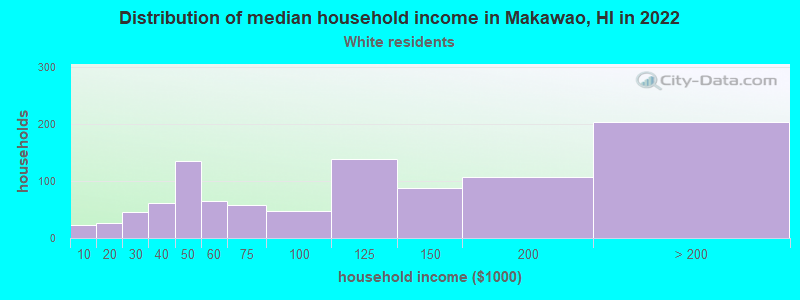
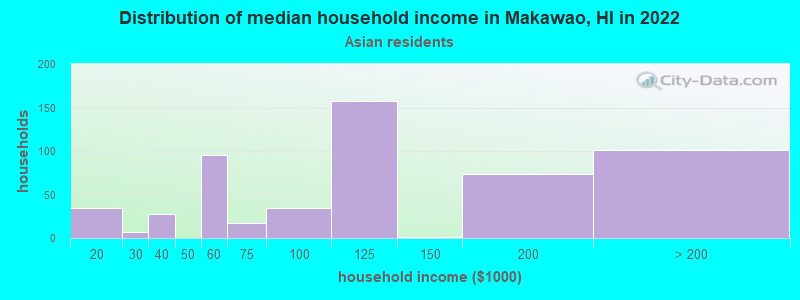
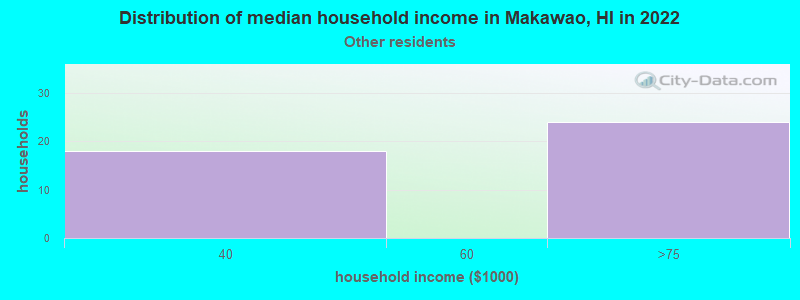
- Median household income in 2022
- $106,716White non-Hispanic householders
- $113,471Asian householders
- $107,778Native Hawaiian and other Pacific Islander householders
- $120,070Two or more races householders
- $74,305Hispanic or Latino race householders
- Median 2022 house value
- $929,950White Non-Hispanic householders
- $828,725Asian householders
- $908,314Native Hawaiian and other Pacific Islander householders
- over $1,000,000Some other race householders
- $866,588Two or more races householders
- $925,700Hispanic or Latino householders
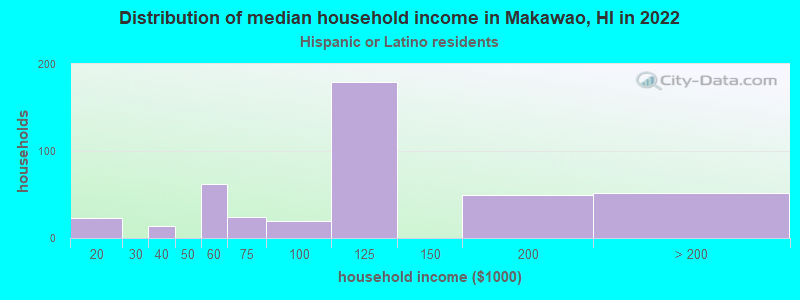
Household income for White non-Hispanic householders
Household income for Asian householders
Household income for Native Hawaiian and other Pacific Islander householders

Household income for Some other race householders
Household income for Two or more races householders
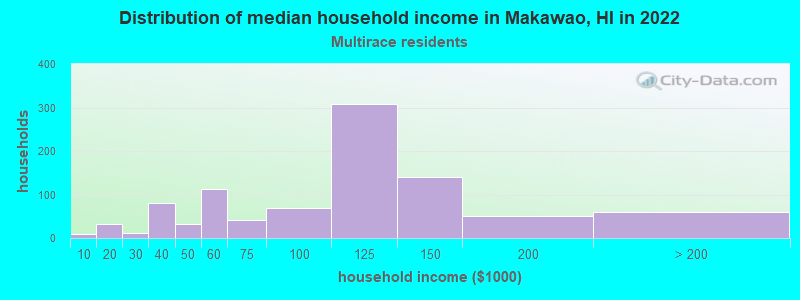
Household income for Hispanic or Latino race householders
Median age by race in Makawao
- 49.9Median age for White residents
- 50.0Males
- 50.4Females
- -722,911,496.4Median age for Black or African American residents
- -767,462,421.9Males
- -743,362,831.1Females
- -505,841,923.9Median age for American Indian / Alaska Native residents
- -496,598,639.0Males
- -904,439,427.2Females
- 53.3Median age for Asian residents
- 45.8Males
- 55.0Females
- 39.8Median age for Native Hawaiian / Pacific Islander residents
- 29.3Males
- 50.6Females
- 19.3Median age for Other race residents
- 18.4Males
- 22.3Females
- 42.8Median age for Two or more races residents
- 43.5Males
- 40.5Females
- 51.2Median age for White alone residents
- 48.1Males
- 54.1Females
- 40.0Median age for Hispanic or Latino residents
- 39.9Males
- 40.3Females
Owner/renter occupied households by race in Makawao
- House owners and renters - White residents
- 77576.3%Owner occupied
- 24023.7%Renter occupied
- House owners and renters - Asian residents
- 37172.1%Owner occupied
- 14327.9%Renter occupied
- House owners and renters - Native Hawaiian / Pacific Islander residents
- 15841.1%Owner occupied
- 22558.9%Renter occupied
- House owners and renters - Other race residents
- 46100.0%Renter occupied
- House owners and renters - Two or more races residents
- 66279.6%Owner occupied
- 17020.4%Renter occupied
- House owners and renters - White alone residents
- 73275.3%Owner occupied
- 24024.7%Renter occupied
- House owners and renters - Hispanic or Latino residents
- 33583.0%Owner occupied
- 6817.0%Renter occupied
Language usage in Makawao
- English speakers - Total
- 93.6% of residents of Makawao speak English at home.
- 1.4% of residents speak Spanish at home
- 3434.3%Speak English very well
- 6565.7%Speak English less than very well
- 6.4% of residents speak other language at home
- 25855.2%Speak English very well
- 20944.8%Speak English less than very well
- English speakers - Born in the United States
- 95.9% of residents of Makawao speak English at home.
- 1.1% of residents speak Spanish at home
- 27100.0%Speak English very well
- 2.6% of residents speak other language at home
- 2743.5%Speak English very well
- 3556.5%Speak English less than very well
- English speakers - Native, born elsewhere
- 88.4% of residents of Makawao speak English at home.
- 11.6% of residents speak other language at home
- 13100.0%Speak English very well
- English speakers - Foreign-born
- 40.5% of residents of Makawao speak English at home.
- 10.9% of residents speak Spanish at home
- 512.8%Speak English very well
- 3487.2%Speak English less than very well
- 49.4% of residents speak other language at home
- 11363.8%Speak English very well
- 6436.2%Speak English less than very well
White (Caucasian) - Speak only English
| Native: | 100.0% (2,359) |
| Foreign-born: | 90.1% (118) |
Asian - Speak only English
| Native: | 90.4% (875) |
| Foreign-born: | 11.8% (23) |
Asian - Speak another language
| Native: | 10.1% (98) |
| Foreign-born: | 87.8% (171) |
Native Hawaiian / Pacific Islander - Speak only English
| Native: | 83.0% (955) |
| Foreign-born: | 84.5% (1) |
Other race - Speak another language
| Native: | 7.2% (16) |
| Foreign-born: | 72.0% (37) |
Two or more races - Speak another language
| Native: | 10.5% (246) |
| Foreign-born: | 74.4% (7) |
White alone - Speak only English
| Native: | 100.0% (2,235) |
| Foreign-born: | 89.1% (117) |
Hispanic or Latino - Speak another language
| Native: | 11.5% (130) |
| Foreign-born: | 75.3% (39) |
Foreign-born residents in Makawao
458 residents are foreign born (3.2% Asia, 0.9% Latin America, 0.7% Oceania).
| This city: | 6.0% |
| Hawaii: | 18.0% |


Marital status for residents in Makawao
Marital status - White (Caucasian) population 15 years and over
- Males
- 22.4%Never married
- 69.4%Now married
- 0.7%Separated
- 2.2%Widowed
- 5.3%Divorced
- Females
- 18.2%Never married
- 54.4%Now married
- 0.6%Separated
- 3.7%Widowed
- 23.1%Divorced
Women who gave birth in the past 12 months
| Now married: | 100.0% (18) |
| Unmarried: | 0.0% (0) |
Women who did not give birth in the past 12 months
| Now married: | 60.4% (280) |
| Unmarried: | 39.6% (183) |
Marital status - Asian population 15 years and over
- Males
- 31.8%Never married
- 50.4%Now married
- 0.0%Separated
- 3.8%Widowed
- 14.0%Divorced
- Females
- 19.2%Never married
- 53.4%Now married
- 6.9%Separated
- 13.6%Widowed
- 7.0%Divorced
Women who gave birth in the past 12 months
| Now married: | 100.0% (22) |
| Unmarried: | 0.0% (0) |
Women who did not give birth in the past 12 months
| Now married: | 49.8% (118) |
| Unmarried: | 50.2% (119) |
Marital status - Native Hawaiian / Pacific Islander population 15 years and over
- Males
- 52.9%Never married
- 25.4%Now married
- 9.7%Separated
- 10.7%Widowed
- 1.4%Divorced
- Females
- 15.5%Never married
- 53.6%Now married
- 0.0%Separated
- 9.1%Widowed
- 21.7%Divorced
Women who did not give birth in the past 12 months
| Now married: | 60.8% (98) |
| Unmarried: | 39.2% (64) |
Marital status - Other race population 15 years and over
- Males
- 0.0%Never married
- 100.0%Now married
- 0.0%Separated
- 0.0%Widowed
- 0.0%Divorced
- Females
- 61.6%Never married
- 38.4%Now married
- 0.0%Separated
- 0.0%Widowed
- 0.0%Divorced
Women who did not give birth in the past 12 months
| Now married: | 35.8% (52) |
| Unmarried: | 64.2% (93) |
Marital status - Two or more races population 15 years and over
- Males
- 20.1%Never married
- 60.3%Now married
- 3.1%Separated
- 5.1%Widowed
- 11.5%Divorced
- Females
- 40.9%Never married
- 41.3%Now married
- 0.0%Separated
- 6.1%Widowed
- 11.7%Divorced
Women who did not give birth in the past 12 months
| Now married: | 30.7% (180) |
| Unmarried: | 69.3% (407) |
Marital status - White alone, not Hispanic / Latino population 15 years and over
- Males
- 23.4%Never married
- 68.1%Now married
- 0.7%Separated
- 2.3%Widowed
- 5.5%Divorced
- Females
- 19.6%Never married
- 50.8%Now married
- 0.7%Separated
- 4.0%Widowed
- 24.9%Divorced
Women who gave birth in the past 12 months
| Now married: | 100.0% (19) |
| Unmarried: | 0.0% (0) |
Women who did not give birth in the past 12 months
| Now married: | 53.7% (224) |
| Unmarried: | 46.3% (193) |
Marital status - Hispanic or Latino population 15 years and over
- Males
- 20.8%Never married
- 60.2%Now married
- 0.0%Separated
- 0.0%Widowed
- 19.0%Divorced
- Females
- 31.7%Never married
- 51.9%Now married
- 0.0%Separated
- 9.3%Widowed
- 7.1%Divorced
Women who did not give birth in the past 12 months
| Now married: | 36.8% (128) |
| Unmarried: | 63.2% (220) |
Ancestries in Makawao

- 32510.6%Portuguese
- 1454.7%English
- 1224.0%German
- 762.5%French
- 381.2%Irish
- 361.2%Australian
- 301.0%European
- 260.8%Scotch-Irish
- 200.7%American
- 200.7%Canadian
- 180.6%Austrian
- 170.6%British
- 170.6%Polish
- 160.5%Northern European
- 130.4%Eastern European
- 80.3%Iranian
- 70.2%Hungarian
- 70.2%Italian
- 60.2%Croatian
- 60.2%Dutch
- 40.1%Scottish

Geographical mobility in Makawao

- Same house 1 year ago
- 2,46497.1%White (Caucasian)
- 1696.5%Black or African American
- 993.1%American Indian / Alaska Native
- 1,12997.1%Asian
- 92786.2%Native Hawaiian / Pacific Islander
- 409100.0%Other race
- 2,37595.9%Two or more races
- 2,33196.9%White alone, not Hispanic / Latino
- 1,23694.0%Hispanic or Latino

-
- Moved within same county
- 100.4%White / Caucasian
- 60.5%Asian
- 20719.3%Native Hawaiian / Pacific Islander
- 883.5%Two or more races
- 110.4%White alone, not Hispanic / Latino
- 120.9%Hispanic or Latino

-
- Moved within same state
- 211.8%Asian
- 10.1%Native Hawaiian / Pacific Islander

-
- Moved from different state
- 943.7%White / Caucasian
- 110.9%Asian
- 200.8%Two or more races
- 903.8%White alone, not Hispanic / Latino

-
- Moved from abroad
- 60.2%White
- 393.4%Asian
- 60.3%White alone, not Hispanic / Latino

Children Nativity (place of birth) in Makawao
Place of birth for residents in Makawao
![Place of birth for the foreign-born population - Regions]()
- 254Asia
- 143South Eastern Asia
- 117Americas
- 73Latin America
- 68Eastern Asia
- 55Oceania
- 43Northern America
- 37Central America
- 36China
- 25Caribbean
- 20Europe
- 15Australia and New Zealand Subregion
- 11Africa
- 11Eastern Africa
- 10South America
- 9Northern Europe
- 8South Central Asia
- 7Eastern Europe
- 4Southern Europe

![Place of birth for the foreign-born population - Countries]()
- 143Philippines
- 43Canada
- 37El Salvador
- 31Japan
- 25Bahamas
- 24China
- 15Australia
- 12Hong Kong
- 11Zimbabwe
- 10Argentina
- 9England
- 8Iran
- 7Hungary
- 4Portugal
- 4Azores Islands
- 1Marshall Islands

Grandparents responsible for own grandchildren in Makawao
Zip codes: 96768.