Races in Little Elm, Texas (TX) Detailed Stats
Data:
Races - White alone (%)
Races - White alone (% change since 2000)
Races - Black alone (%)
Races - Black alone (% change since 2000)
Races - American Indian alone (%)
Races - American Indian alone (% change since 2000)
Races - Asian alone (%)
Races - Asian alone (% change since 2000)
Races - Hispanic (%)
Races - Hispanic (% change since 2000)
Races - Native Hawaiian and Other Pacific Islander alone (%)
Races - Native Hawaiian and Other Pacific Islander alone (% change since 2000)
Races - Two or more races(%)
Races - Two or more races(% change since 2000)
Races - Other race alone (%)
Races - Other race alone (% change since 2000)
Racial diversity
Place of birth - Born in state of residence (%)
Place of birth - Born in state of residence (%) - White
Place of birth - Born in state of residence (%) - Black or African American
Place of birth - Born in state of residence (%) - Asian
Place of birth - Born in state of residence (%) - Hispanic or Latino
Place of birth - Born in state of residence (%) - American Indian and Alaska Native
Place of birth - Born in state of residence (%) - Multirace
Place of birth - Born in state of residence (%) - Other Race
Place of birth - Born in other state (%)
Place of birth - Born in other state (%) - White
Place of birth - Born in other state (%) - Black or African American
Place of birth - Born in other state (%) - Asian
Place of birth - Born in other state (%) - Hispanic or Latino
Place of birth - Born in other state (%) - American Indian and Alaska Native
Place of birth - Born in other state (%) - Multirace
Place of birth - Born in other state (%) - Other Race
Place of birth - Native, outside of US (%)
Place of birth - Native, outside of US (%) - White
Place of birth - Native, outside of US (%) - Black or African American
Place of birth - Native, outside of US (%) - Asian
Place of birth - Native, outside of US (%) - Hispanic or Latino
Place of birth - Native, outside of US (%) - American Indian and Alaska Native
Place of birth - Native, outside of US (%) - Multirace
Place of birth - Native, outside of US (%) - Other Race
Place of birth - Foreign born (%)
Place of birth - Foreign born (%) - White
Place of birth - Foreign born (%) - Black or African American
Place of birth - Foreign born (%) - Asian
Place of birth - Foreign born (%) - Hispanic or Latino
Place of birth - Foreign born (%) - American Indian and Alaska Native
Place of birth - Foreign born (%) - Multirace
Place of birth - Foreign born (%) - Other Race
Residents speaking English at home (%)
Residents speaking English at home - Born in the United States (%)
Residents speaking English at home - Native, born elsewhere (%)
Residents speaking English at home - Foreign born (%)
Residents speaking Spanish at home (%)
Residents speaking Spanish at home - Born in the United States (%)
Residents speaking Spanish at home - Native, born elsewhere (%)
Residents speaking Spanish at home - Foreign born (%)
Residents speaking other language at home (%)
Residents speaking other language at home - Born in the United States (%)
Residents speaking other language at home - Native, born elsewhere (%)
Residents speaking other language at home - Foreign born (%)
Marital status - Never married (%)
Marital status - Now married (%)
Marital status - Separated (%)
Marital status - Widowed (%)
Marital status - Divorced (%)
Ancestries Reported - Arab (%)
Ancestries Reported - Czech (%)
Ancestries Reported - Danish (%)
Ancestries Reported - Dutch (%)
Ancestries Reported - English (%)
Ancestries Reported - French (%)
Ancestries Reported - French Canadian (%)
Ancestries Reported - German (%)
Ancestries Reported - Greek (%)
Ancestries Reported - Hungarian (%)
Ancestries Reported - Irish (%)
Ancestries Reported - Italian (%)
Ancestries Reported - Lithuanian (%)
Ancestries Reported - Norwegian (%)
Ancestries Reported - Polish (%)
Ancestries Reported - Portuguese (%)
Ancestries Reported - Russian (%)
Ancestries Reported - Scotch-Irish (%)
Ancestries Reported - Scottish (%)
Ancestries Reported - Slovak (%)
Ancestries Reported - Subsaharan African (%)
Ancestries Reported - Swedish (%)
Ancestries Reported - Swiss (%)
Ancestries Reported - Ukrainian (%)
Ancestries Reported - United States (%)
Ancestries Reported - Welsh (%)
Ancestries Reported - West Indian (%)
Ancestries Reported - Other (%)
Geographical mobility - Same house 1 year ago (%)
Geographical mobility - Same house 1 year ago (%) - White
Geographical mobility - Same house 1 year ago (%) - Black or African American
Geographical mobility - Same house 1 year ago (%) - Asian
Geographical mobility - Same house 1 year ago (%) - Hispanic or Latino
Geographical mobility - Same house 1 year ago (%) - American Indian and Alaska Native
Geographical mobility - Same house 1 year ago (%) - Multirace
Geographical mobility - Same house 1 year ago (%) - Other Race
Geographical mobility - Moved within same county (%)
Geographical mobility - Moved within same county (%) - White
Geographical mobility - Moved within same county (%) - Black or African American
Geographical mobility - Moved within same county (%) - Asian
Geographical mobility - Moved within same county (%) - Hispanic or Latino
Geographical mobility - Moved within same county (%) - American Indian and Alaska Native
Geographical mobility - Moved within same county (%) - Multirace
Geographical mobility - Moved within same county (%) - Other Race
Geographical mobility - Moved from different county within same state (%)
Geographical mobility - Moved from different county within same state (%) - White
Geographical mobility - Moved from different county within same state (%) - Black or African American
Geographical mobility - Moved from different county within same state (%) - Asian
Geographical mobility - Moved from different county within same state (%) - Hispanic or Latino
Geographical mobility - Moved from different county within same state (%) - American Indian and Alaska Native
Geographical mobility - Moved from different county within same state (%) - Multirace
Geographical mobility - Moved from different county within same state (%) - Other Race
Geographical mobility - Moved from different state (%)
Geographical mobility - Moved from different state (%) - White
Geographical mobility - Moved from different state (%) - Black or African American
Geographical mobility - Moved from different state (%) - Asian
Geographical mobility - Moved from different state (%) - Hispanic or Latino
Geographical mobility - Moved from different state (%) - American Indian and Alaska Native
Geographical mobility - Moved from different state (%) - Multirace
Geographical mobility - Moved from different state (%) - Other Race
Geographical mobility - Moved from abroad (%)
Geographical mobility - Moved from abroad (%) - White
Geographical mobility - Moved from abroad (%) - Black or African American
Geographical mobility - Moved from abroad (%) - Asian
Geographical mobility - Moved from abroad (%) - Hispanic or Latino
Geographical mobility - Moved from abroad (%) - American Indian and Alaska Native
Geographical mobility - Moved from abroad (%) - Multirace
Geographical mobility - Moved from abroad (%) - Other Race
Place of birth for the foreign-born population - Ireland (%)
Place of birth for the foreign-born population - Denmark (%)
Place of birth for the foreign-born population - Norway (%)
Place of birth for the foreign-born population - Sweden (%)
Place of birth for the foreign-born population - United Kingdom (%)
Place of birth for the foreign-born population - England (%)
Place of birth for the foreign-born population - Scotland (%)
Place of birth for the foreign-born population - Other Northern Europe (%)
Place of birth for the foreign-born population - Austria (%)
Place of birth for the foreign-born population - Belgium (%)
Place of birth for the foreign-born population - France (%)
Place of birth for the foreign-born population - Germany (%)
Place of birth for the foreign-born population - Netherlands (%)
Place of birth for the foreign-born population - Switzerland (%)
Place of birth for the foreign-born population - Other Western Europe (%)
Place of birth for the foreign-born population - Greece (%)
Place of birth for the foreign-born population - Italy (%)
Place of birth for the foreign-born population - Portugal (%)
Place of birth for the foreign-born population - Spain (%)
Place of birth for the foreign-born population - Other Southern Europe (%)
Place of birth for the foreign-born population - Albania (%)
Place of birth for the foreign-born population - Belarus (%)
Place of birth for the foreign-born population - Bosnia and Herzegovina (%)
Place of birth for the foreign-born population - Bulgaria (%)
Place of birth for the foreign-born population - Croatia (%)
Place of birth for the foreign-born population - Czechoslovakia (%)
Place of birth for the foreign-born population - Hungary (%)
Place of birth for the foreign-born population - Latvia (%)
Place of birth for the foreign-born population - Lithuania (%)
Place of birth for the foreign-born population - North Macedonia (Macedonia) (%)
Place of birth for the foreign-born population - Moldova (%)
Place of birth for the foreign-born population - Poland (%)
Place of birth for the foreign-born population - Romania (%)
Place of birth for the foreign-born population - Russia (%)
Place of birth for the foreign-born population - Serbia (%)
Place of birth for the foreign-born population - Ukraine (%)
Place of birth for the foreign-born population - Other Eastern Europe (%)
Place of birth for the foreign-born population - China (%)
Place of birth for the foreign-born population - Hong Kong (%)
Place of birth for the foreign-born population - Taiwan (%)
Place of birth for the foreign-born population - Japan (%)
Place of birth for the foreign-born population - Korea (%)
Place of birth for the foreign-born population - Other Eastern Asia (%)
Place of birth for the foreign-born population - Afghanistan (%)
Place of birth for the foreign-born population - Bangladesh (%)
Place of birth for the foreign-born population - India (%)
Place of birth for the foreign-born population - Iran (%)
Place of birth for the foreign-born population - Kazakhstan (%)
Place of birth for the foreign-born population - Nepal (%)
Place of birth for the foreign-born population - Pakistan (%)
Place of birth for the foreign-born population - Sri Lanka (%)
Place of birth for the foreign-born population - Uzbekistan (%)
Place of birth for the foreign-born population - Other South Central Asia (%)
Place of birth for the foreign-born population - Burma (%)
Place of birth for the foreign-born population - Cambodia (%)
Place of birth for the foreign-born population - Indonesia (%)
Place of birth for the foreign-born population - Laos (%)
Place of birth for the foreign-born population - Malaysia (%)
Place of birth for the foreign-born population - Philippines (%)
Place of birth for the foreign-born population - Singapore (%)
Place of birth for the foreign-born population - Thailand (%)
Place of birth for the foreign-born population - Vietnam (%)
Place of birth for the foreign-born population - Other South Eastern Asia (%)
Place of birth for the foreign-born population - Armenia (%)
Place of birth for the foreign-born population - Iraq (%)
Place of birth for the foreign-born population - Israel (%)
Place of birth for the foreign-born population - Jordan (%)
Place of birth for the foreign-born population - Kuwait (%)
Place of birth for the foreign-born population - Lebanon (%)
Place of birth for the foreign-born population - Saudi Arabia (%)
Place of birth for the foreign-born population - Syria (%)
Place of birth for the foreign-born population - Turkey (%)
Place of birth for the foreign-born population - Yemen (%)
Place of birth for the foreign-born population - Other Western Asia (%)
Place of birth for the foreign-born population - Eritrea (%)
Place of birth for the foreign-born population - Ethiopia (%)
Place of birth for the foreign-born population - Kenya (%)
Place of birth for the foreign-born population - Somalia (%)
Place of birth for the foreign-born population - Uganda (%)
Place of birth for the foreign-born population - Zimbabwe (%)
Place of birth for the foreign-born population - Other Eastern Africa (%)
Place of birth for the foreign-born population - Cameroon (%)
Place of birth for the foreign-born population - Congo (%)
Place of birth for the foreign-born population - Democratic Republic of Congo (Zaire) (%)
Place of birth for the foreign-born population - Other Middle Africa (%)
Place of birth for the foreign-born population - Egypt (%)
Place of birth for the foreign-born population - Morocco (%)
Place of birth for the foreign-born population - Sudan (%)
Place of birth for the foreign-born population - Other Northern Africa (%)
Place of birth for the foreign-born population - South Africa (%)
Place of birth for the foreign-born population - Other Southern Africa (%)
Place of birth for the foreign-born population - Cabo Verde (%)
Place of birth for the foreign-born population - Ghana (%)
Place of birth for the foreign-born population - Liberia (%)
Place of birth for the foreign-born population - Nigeria (%)
Place of birth for the foreign-born population - Senegal (%)
Place of birth for the foreign-born population - Sierra Leone (%)
Place of birth for the foreign-born population - Other Western Africa (%)
Place of birth for the foreign-born population - Australia (%)
Place of birth for the foreign-born population - New Zealand (%)
Place of birth for the foreign-born population - Fiji (%)
Place of birth for the foreign-born population - Micronesia (%)
Place of birth for the foreign-born population - Bahamas (%)
Place of birth for the foreign-born population - Barbados (%)
Place of birth for the foreign-born population - Cuba (%)
Place of birth for the foreign-born population - Dominica (%)
Place of birth for the foreign-born population - Dominican Republic (%)
Place of birth for the foreign-born population - Grenada (%)
Place of birth for the foreign-born population - Haiti (%)
Place of birth for the foreign-born population - Jamaica (%)
Place of birth for the foreign-born population - St. Vincent and the Grenadines (%)
Place of birth for the foreign-born population - Trinidad and Tobago (%)
Place of birth for the foreign-born population - West Indies (%)
Place of birth for the foreign-born population - Other Caribbean (%)
Place of birth for the foreign-born population - Belize (%)
Place of birth for the foreign-born population - Costa Rica (%)
Place of birth for the foreign-born population - El Salvador (%)
Place of birth for the foreign-born population - Guatemala (%)
Place of birth for the foreign-born population - Honduras (%)
Place of birth for the foreign-born population - Mexico (%)
Place of birth for the foreign-born population - Nicaragua (%)
Place of birth for the foreign-born population - Panama (%)
Place of birth for the foreign-born population - Other Central America (%)
Place of birth for the foreign-born population - Argentina (%)
Place of birth for the foreign-born population - Bolivia (%)
Place of birth for the foreign-born population - Brazil (%)
Place of birth for the foreign-born population - Chile (%)
Place of birth for the foreign-born population - Colombia (%)
Place of birth for the foreign-born population - Ecuador (%)
Place of birth for the foreign-born population - Guyana (%)
Place of birth for the foreign-born population - Peru (%)
Place of birth for the foreign-born population - Uruguay (%)
Place of birth for the foreign-born population - Venezuela (%)
Place of birth for the foreign-born population - Other South America (%)
Place of birth for the foreign-born population - Canada (%)
Place of birth for the foreign-born population - Other Northern America (%)
Place of birth for the foreign-born population - Other (%)
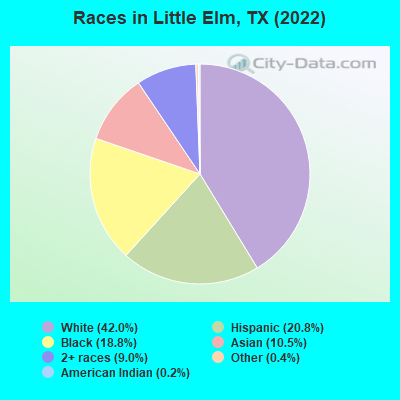
According to 2022 data, the most numerous races in Little Elm, TX are Hispanic (10,713 residents), White alone (21,642 residents), and Black alone (9,683 residents). 70.8% of Little Elm residents speak English at home. 18.1% of Little Elm, TX residents are foreign-born (7.5% born in Asia, 6.4% born in Latin America, 3.1% born in Africa), which is 5.9% greater than the foreign-born rate of 17.0% across the entire state of Texas.
Race distribution in Little Elm
2000 2022
10,933,313 52.4% White alone 6,669,666 32.0% Hispanic 2,364,255 11.3% Black alone 554,445 2.7% Asian alone 230,567 1.1% Two or more races 68,859 0.3% American Indian alone 19,958 0.10% Other race alone 10,757 0.05% Native Hawaiian and Other
12,070,642 40.2% Hispanic 11,683,430 38.9% White alone 3,508,706 11.7% Black alone 1,608,173 5.4% Asian alone 956,560 3.2% Two or more races 125,763 0.4% Other race alone 47,023 0.2% American Indian alone 29,275 0.10% Native Hawaiian and Other
Income and house value in Little Elm Median household income in 2022 $114,081 White non-Hispanic householders$80,852 Black householders$125,795 Asian householders$128,990 Some other race householders$121,951 Two or more races householders$81,024 Hispanic or Latino race householdersMedian 2022 house value $487,182 White Non-Hispanic householders$576,578 Black or African American householders$381,961 American Indian or Alaska Native householders $438,421 Asian householders$445,693 Some other race householders$417,035 Two or more races householders$467,079 Hispanic or Latino householders
Median age by race in Little Elm
38.5 Median age for White residents38.4 38.8 35.9 Median age for Black or African American residents31.4 38.3 21.8 Median age for American Indian / Alaska Native residents22.8 18.1 37.5 Median age for Asian residents37.9 36.9 18.0 Median age for Native Hawaiian / Pacific Islander residents-601,801,801.2 38.6 35.6 Median age for Other race residents33.3 36.6 29.2 Median age for Two or more races residents19.9 37.3 39.1 Median age for White alone residents39.5 38.6 31.3 Median age for Hispanic or Latino residents25.7 34.2
Owner/renter occupied households by race in Little Elm
House owners and renters - White residents 6,530 66.8% Owner occupied3,245 33.2% Renter occupiedHouse owners and renters - Black or African American residents 2,236 57.7% Owner occupied1,641 42.3% Renter occupiedHouse owners and renters - American Indian / Alaska Native residents 164 84.8% Owner occupied29 15.2% Renter occupiedHouse owners and renters - Asian residents 1,318 85.8% Owner occupied217 14.2% Renter occupiedHouse owners and renters - Native Hawaiian / Pacific Islander residents 6 100.0% Owner occupiedHouse owners and renters - Other race residents 556 72.4% Owner occupied212 27.6% Renter occupiedHouse owners and renters - Two or more races residents 1,842 81.6% Owner occupied416 18.4% Renter occupiedHouse owners and renters - White alone residents 5,856 65.3% Owner occupied3,105 34.7% Renter occupiedHouse owners and renters - Hispanic or Latino residents 1,999 74.2% Owner occupied693 25.8% Renter occupied
Language usage in Little Elm
English speakers - Total 70.8% of residents of Little Elm speak English at home.
15.2% of residents speak Spanish at home 5,021 67.7% Speak English very well2,391 32.3% Speak English less than very well14.2% of residents speak other language at home 4,874 70.4% Speak English very well2,046 29.6% Speak English less than very well
English speakers - Born in the United States 90.8% of residents of Little Elm speak English at home.
6.3% of residents speak Spanish at home 935 75.8% Speak English very well298 24.2% Speak English less than very well2.8% of residents speak other language at home 368 68.0% Speak English very well173 32.0% Speak English less than very well
English speakers - Native, born elsewhere 41.5% of residents of Little Elm speak English at home.
40.4% of residents speak Spanish at home 290 57.2% Speak English very well217 42.8% Speak English less than very well14.6% of residents speak other language at home 184 100.0% Speak English very well
English speakers - Foreign-born 13.0% of residents of Little Elm speak English at home.
33.6% of residents speak Spanish at home 1,792 53.8% Speak English very well1,539 46.2% Speak English less than very well53.4% of residents speak other language at home 3,681 69.6% Speak English very well1,609 30.4% Speak English less than very well
White (Caucasian) - Speak only English Native:
95.1% (20,417)Foreign-born:
16.2% (290)
White (Caucasian) - Speak another language Native:
4.5% (958)Foreign-born:
78.1% (1,399)
Black or African American - Speak only English Native:
95.7% (7,165)Foreign-born:
20.5% (416)
Black or African American - Speak another language Native:
3.8% (286)Foreign-born:
82.5% (1,675)
American Indian / Alaska Native - Speak another language Native:
73.6% (370)Foreign-born:
98.9% (481)
Asian - Speak only English Native:
34.8% (568)Foreign-born:
12.2% (425)
Asian - Speak another language Native:
63.3% (1,033)Foreign-born:
87.5% (3,038)
Other race - Speak only English Native:
39.8% (1,069)Foreign-born:
8.5% (59)
Other race - Speak another language Native:
59.7% (1,603)Foreign-born:
90.8% (629)
Two or more races - Speak only English Native:
72.4% (4,740)Foreign-born:
0.9% (12)
Two or more races - Speak another language Native:
27.7% (1,811)Foreign-born:
100.0% (1,288)
White alone - Speak only English Native:
97.1% (19,018)Foreign-born:
21.6% (249)
White alone - Speak another language Native:
2.8% (542)Foreign-born:
77.2% (890)
Hispanic or Latino - Speak only English Native:
49.0% (3,303)Foreign-born:
3.6% (118)
Hispanic or Latino - Speak another language Native:
50.7% (3,417)Foreign-born:
97.3% (3,216)
Foreign-born residents in Little Elm 9,307 residents are foreign born (7.5% Asia , 6.4% Latin America , 3.1% Africa ).
This city:
18.1%Texas:
17.1%
Marital status for residents in Little Elm Marital status - White (Caucasian) population 15 years and over
Males 29.0% Never married58.1% Now married1.3% Separated1.5% Widowed10.1% DivorcedFemales 22.9% Never married57.6% Now married1.6% Separated5.1% Widowed13.0% DivorcedWomen who gave birth in the past 12 months Now married:
77.2% (274)Unmarried:
22.8% (81)
Women who did not give birth in the past 12 months Now married:
58.2% (3,351)Unmarried:
41.8% (2,405)
Marital status - Black or African American population 15 years and over
Males 44.0% Never married37.4% Now married0.0% Separated0.0% Widowed18.6% DivorcedFemales 30.5% Never married23.1% Now married8.3% Separated3.4% Widowed34.7% DivorcedWomen who gave birth in the past 12 months Now married:
82.7% (200)Unmarried:
17.3% (42)
Women who did not give birth in the past 12 months Now married:
23.5% (664)Unmarried:
76.5% (2,158)
Marital status - American Indian / Alaska Native population 15 years and over
Males 37.3% Never married62.7% Now married0.0% Separated0.0% Widowed0.0% DivorcedFemales 45.1% Never married54.9% Now married0.0% Separated0.0% Widowed0.0% DivorcedWomen who did not give birth in the past 12 months Now married:
50.3% (119)Unmarried:
49.7% (118)
Marital status - Asian population 15 years and over
Males 17.6% Never married78.4% Now married0.0% Separated1.5% Widowed2.6% DivorcedFemales 15.2% Never married77.9% Now married1.8% Separated0.9% Widowed4.1% DivorcedWomen who gave birth in the past 12 months Now married:
100.0% (154)Unmarried:
0.0% (0)
Women who did not give birth in the past 12 months Now married:
71.6% (1,029)Unmarried:
28.4% (408)
Marital status - Native Hawaiian / Pacific Islander population 15 years and over
Males 0.0% Never married100.0% Now married0.0% Separated0.0% Widowed0.0% DivorcedFemales 88.9% Never married11.1% Now married0.0% Separated0.0% Widowed0.0% DivorcedWomen who gave birth in the past 12 months Now married:
0.0% (0)Unmarried:
100.0% (12)
Women who did not give birth in the past 12 months Now married:
0.0% (0)Unmarried:
100.0% (27)
Marital status - Other race population 15 years and over
Males 37.7% Never married58.4% Now married0.0% Separated0.0% Widowed3.9% DivorcedFemales 16.6% Never married65.2% Now married0.0% Separated3.3% Widowed14.9% DivorcedWomen who did not give birth in the past 12 months Now married:
59.2% (745)Unmarried:
40.8% (513)
Marital status - Two or more races population 15 years and over
Males 29.5% Never married64.3% Now married0.0% Separated0.0% Widowed6.2% DivorcedFemales 46.4% Never married47.2% Now married1.3% Separated0.6% Widowed4.5% DivorcedWomen who gave birth in the past 12 months Now married:
100.0% (144)Unmarried:
0.0% (0)
Women who did not give birth in the past 12 months Now married:
42.3% (1,165)Unmarried:
57.7% (1,588)
Marital status - White alone, not Hispanic / Latino population 15 years and over
Males 27.1% Never married60.3% Now married1.5% Separated1.5% Widowed9.7% DivorcedFemales 20.1% Never married60.1% Now married1.9% Separated4.4% Widowed13.5% DivorcedWomen who gave birth in the past 12 months Now married:
77.0% (296)Unmarried:
23.0% (88)
Women who did not give birth in the past 12 months Now married:
60.2% (3,008)Unmarried:
39.8% (1,990)
Marital status - Hispanic or Latino population 15 years and over
Males 37.0% Never married52.8% Now married0.0% Separated1.0% Widowed9.2% DivorcedFemales 32.4% Never married53.8% Now married0.0% Separated4.8% Widowed9.0% DivorcedWomen who gave birth in the past 12 months Now married:
69.4% (93)Unmarried:
30.6% (41)
Women who did not give birth in the past 12 months Now married:
52.0% (1,594)Unmarried:
48.0% (1,473)
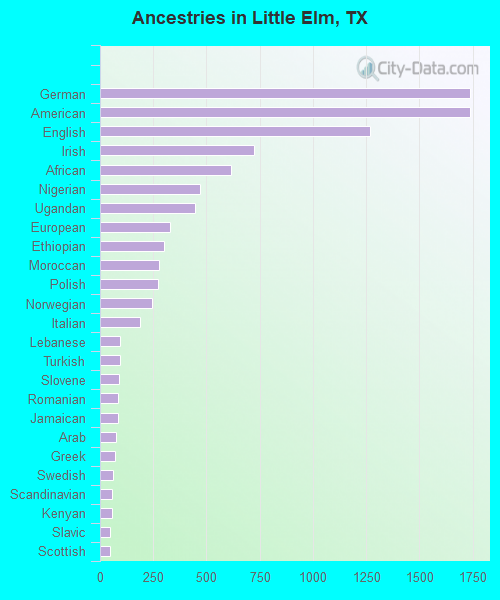
Ancestries in Little Elm
1,740 7.4% German1,737 7.4% American1,268 5.4% English721 3.1% Irish614 2.6% African468 2.0% Nigerian444 1.9% Ugandan331 1.4% European301 1.3% Ethiopian276 1.2% Moroccan272 1.2% Polish244 1.0% Norwegian188 0.8% Italian96 0.4% Lebanese93 0.4% Turkish88 0.4% Slovene83 0.4% Romanian83 0.4% Jamaican77 0.3% Arab70 0.3% Greek61 0.3% Swedish58 0.2% Scandinavian58 0.2% Kenyan47 0.2% Slavic46 0.2% Scottish41 0.2% Portuguese32 0.1% Russian31 0.1% British29 0.1% Iranian18 0.08% French16 0.07% Bulgarian15 0.06% Brazilian14 0.06% Northern European12 0.05% Hungarian12 0.05% Scotch-Irish11 0.05% Swiss10 0.04% Yugoslavian9 0.04% Dutch
Geographical mobility in Little Elm Same house 1 year ago 20,900 85.8% White (Caucasian)8,237 84.2% Black or African American987 100.0% American Indian / Alaska Native4,564 85.0% Asian33 63.8% Native Hawaiian / Pacific Islander3,494 99.8% Other race7,235 85.4% Two or more races18,401 85.8% White alone, not Hispanic / Latino9,537 90.4% Hispanic or LatinoMoved within same county 1,260 5.2% White / Caucasian436 4.5% Black or African American148 2.8% Asian59 1.7% Other race115 1.4% Two or more races1,202 5.6% White alone, not Hispanic / Latino263 2.5% Hispanic or LatinoMoved within same state 1,739 7.1% White / Caucasian651 6.7% Black or African American189 3.5% Asian19 37.7% Native Hawaiian / Pacific Islander85 2.4% Other race809 9.5% Two or more races1,345 6.3% White alone, not Hispanic / Latino806 7.6% Hispanic or LatinoMoved from different state 507 2.1% White / Caucasian390 4.0% Black or African American169 3.2% Asian9 18.3% Native Hawaiian / Pacific Islander326 3.8% Two or more races487 2.3% White alone, not Hispanic / Latino52 0.5% Hispanic or LatinoMoved from abroad 9 0.0% White316 5.9% Asian65 0.8% Two or more races14 0.1% White alone, not Hispanic / Latino19 0.2% Hispanic or Latino
Children Nativity (place of birth) in Little Elm
Children under 6 years - Living with two parents Both parents native 1,321 99.9% Native2 0.1% Foreign-bornBoth parents foreign-born 947 98.9% Native11 1.1% Foreign-bornOne native, one foreign-born parent 283 100.0% NativeChildren under 6 years - Living with one parent Native parent 500 100.0% NativeForeign-born parent 208 100.0% NativeChildren 6 to 17 years - Living with two parents Both parents native 3,983 98.3% Native68 1.7% Foreign-bornBoth parents foreign-born 1,576 84.7% Native284 15.3% Foreign-bornOne native, one foreign-born parent 1,032 98.9% Native11 1.1% Foreign-bornChildren 6 to 17 years - Living with one parent Native parent 2,538 100.0% NativeForeign-born parent 890 56.0% Native701 44.0% Foreign-born
Grandparents responsible for own grandchildren in Little Elm
Grandparents (30 to 59 years) White / Caucasian 113 100.0% Not responsible for grandchildrenBlack or African American 11 100.0% Responsible for grandchildrenNative Hawaiian / Pacific Islander 7 100.0% Not responsible for grandchildrenOther race 28 100.0% Not responsible for grandchildrenTwo or more races 192 79.3% Responsible for grandchildren50 20.7% Not responsible for grandchildrenWhite alone, not Hispanic / Latino 115 100.0% Not responsible for grandchildrenHispanic or Latino 195 75.5% Responsible for grandchildren63 24.5% Not responsible for grandchildrenGrandparents (60 years and over) White / Caucasian 28 10.3% Responsible for grandchildren241 89.7% Not responsible for grandchildrenBlack or African American 29 10.3% Responsible for grandchildren253 89.7% Not responsible for grandchildrenOther race 95 100.0% Not responsible for grandchildrenTwo or more races 57 23.3% Responsible for grandchildren188 76.7% Not responsible for grandchildrenWhite alone, not Hispanic / Latino 29 9.9% Responsible for grandchildren261 90.1% Not responsible for grandchildrenHispanic or Latino 36 19.3% Responsible for grandchildren150 80.7% Not responsible for grandchildren