Races in Lexington-Fayette, Kentucky (KY) Detailed Stats
Data:
Races - White alone (%)
Races - White alone (% change since 2000)
Races - Black alone (%)
Races - Black alone (% change since 2000)
Races - American Indian alone (%)
Races - American Indian alone (% change since 2000)
Races - Asian alone (%)
Races - Asian alone (% change since 2000)
Races - Hispanic (%)
Races - Hispanic (% change since 2000)
Races - Native Hawaiian and Other Pacific Islander alone (%)
Races - Native Hawaiian and Other Pacific Islander alone (% change since 2000)
Races - Two or more races(%)
Races - Two or more races(% change since 2000)
Races - Other race alone (%)
Races - Other race alone (% change since 2000)
Racial diversity
Place of birth - Born in state of residence (%)
Place of birth - Born in state of residence (%) - White
Place of birth - Born in state of residence (%) - Black or African American
Place of birth - Born in state of residence (%) - Asian
Place of birth - Born in state of residence (%) - Hispanic or Latino
Place of birth - Born in state of residence (%) - American Indian and Alaska Native
Place of birth - Born in state of residence (%) - Multirace
Place of birth - Born in state of residence (%) - Other Race
Place of birth - Born in other state (%)
Place of birth - Born in other state (%) - White
Place of birth - Born in other state (%) - Black or African American
Place of birth - Born in other state (%) - Asian
Place of birth - Born in other state (%) - Hispanic or Latino
Place of birth - Born in other state (%) - American Indian and Alaska Native
Place of birth - Born in other state (%) - Multirace
Place of birth - Born in other state (%) - Other Race
Place of birth - Native, outside of US (%)
Place of birth - Native, outside of US (%) - White
Place of birth - Native, outside of US (%) - Black or African American
Place of birth - Native, outside of US (%) - Asian
Place of birth - Native, outside of US (%) - Hispanic or Latino
Place of birth - Native, outside of US (%) - American Indian and Alaska Native
Place of birth - Native, outside of US (%) - Multirace
Place of birth - Native, outside of US (%) - Other Race
Place of birth - Foreign born (%)
Place of birth - Foreign born (%) - White
Place of birth - Foreign born (%) - Black or African American
Place of birth - Foreign born (%) - Asian
Place of birth - Foreign born (%) - Hispanic or Latino
Place of birth - Foreign born (%) - American Indian and Alaska Native
Place of birth - Foreign born (%) - Multirace
Place of birth - Foreign born (%) - Other Race
Residents speaking English at home (%)
Residents speaking English at home - Born in the United States (%)
Residents speaking English at home - Native, born elsewhere (%)
Residents speaking English at home - Foreign born (%)
Residents speaking Spanish at home (%)
Residents speaking Spanish at home - Born in the United States (%)
Residents speaking Spanish at home - Native, born elsewhere (%)
Residents speaking Spanish at home - Foreign born (%)
Residents speaking other language at home (%)
Residents speaking other language at home - Born in the United States (%)
Residents speaking other language at home - Native, born elsewhere (%)
Residents speaking other language at home - Foreign born (%)
Marital status - Never married (%)
Marital status - Now married (%)
Marital status - Separated (%)
Marital status - Widowed (%)
Marital status - Divorced (%)
Ancestries Reported - Arab (%)
Ancestries Reported - Czech (%)
Ancestries Reported - Danish (%)
Ancestries Reported - Dutch (%)
Ancestries Reported - English (%)
Ancestries Reported - French (%)
Ancestries Reported - French Canadian (%)
Ancestries Reported - German (%)
Ancestries Reported - Greek (%)
Ancestries Reported - Hungarian (%)
Ancestries Reported - Irish (%)
Ancestries Reported - Italian (%)
Ancestries Reported - Lithuanian (%)
Ancestries Reported - Norwegian (%)
Ancestries Reported - Polish (%)
Ancestries Reported - Portuguese (%)
Ancestries Reported - Russian (%)
Ancestries Reported - Scotch-Irish (%)
Ancestries Reported - Scottish (%)
Ancestries Reported - Slovak (%)
Ancestries Reported - Subsaharan African (%)
Ancestries Reported - Swedish (%)
Ancestries Reported - Swiss (%)
Ancestries Reported - Ukrainian (%)
Ancestries Reported - United States (%)
Ancestries Reported - Welsh (%)
Ancestries Reported - West Indian (%)
Ancestries Reported - Other (%)
Geographical mobility - Same house 1 year ago (%)
Geographical mobility - Same house 1 year ago (%) - White
Geographical mobility - Same house 1 year ago (%) - Black or African American
Geographical mobility - Same house 1 year ago (%) - Asian
Geographical mobility - Same house 1 year ago (%) - Hispanic or Latino
Geographical mobility - Same house 1 year ago (%) - American Indian and Alaska Native
Geographical mobility - Same house 1 year ago (%) - Multirace
Geographical mobility - Same house 1 year ago (%) - Other Race
Geographical mobility - Moved within same county (%)
Geographical mobility - Moved within same county (%) - White
Geographical mobility - Moved within same county (%) - Black or African American
Geographical mobility - Moved within same county (%) - Asian
Geographical mobility - Moved within same county (%) - Hispanic or Latino
Geographical mobility - Moved within same county (%) - American Indian and Alaska Native
Geographical mobility - Moved within same county (%) - Multirace
Geographical mobility - Moved within same county (%) - Other Race
Geographical mobility - Moved from different county within same state (%)
Geographical mobility - Moved from different county within same state (%) - White
Geographical mobility - Moved from different county within same state (%) - Black or African American
Geographical mobility - Moved from different county within same state (%) - Asian
Geographical mobility - Moved from different county within same state (%) - Hispanic or Latino
Geographical mobility - Moved from different county within same state (%) - American Indian and Alaska Native
Geographical mobility - Moved from different county within same state (%) - Multirace
Geographical mobility - Moved from different county within same state (%) - Other Race
Geographical mobility - Moved from different state (%)
Geographical mobility - Moved from different state (%) - White
Geographical mobility - Moved from different state (%) - Black or African American
Geographical mobility - Moved from different state (%) - Asian
Geographical mobility - Moved from different state (%) - Hispanic or Latino
Geographical mobility - Moved from different state (%) - American Indian and Alaska Native
Geographical mobility - Moved from different state (%) - Multirace
Geographical mobility - Moved from different state (%) - Other Race
Geographical mobility - Moved from abroad (%)
Geographical mobility - Moved from abroad (%) - White
Geographical mobility - Moved from abroad (%) - Black or African American
Geographical mobility - Moved from abroad (%) - Asian
Geographical mobility - Moved from abroad (%) - Hispanic or Latino
Geographical mobility - Moved from abroad (%) - American Indian and Alaska Native
Geographical mobility - Moved from abroad (%) - Multirace
Geographical mobility - Moved from abroad (%) - Other Race
Place of birth for the foreign-born population - Ireland (%)
Place of birth for the foreign-born population - Denmark (%)
Place of birth for the foreign-born population - Norway (%)
Place of birth for the foreign-born population - Sweden (%)
Place of birth for the foreign-born population - United Kingdom (%)
Place of birth for the foreign-born population - England (%)
Place of birth for the foreign-born population - Scotland (%)
Place of birth for the foreign-born population - Other Northern Europe (%)
Place of birth for the foreign-born population - Austria (%)
Place of birth for the foreign-born population - Belgium (%)
Place of birth for the foreign-born population - France (%)
Place of birth for the foreign-born population - Germany (%)
Place of birth for the foreign-born population - Netherlands (%)
Place of birth for the foreign-born population - Switzerland (%)
Place of birth for the foreign-born population - Other Western Europe (%)
Place of birth for the foreign-born population - Greece (%)
Place of birth for the foreign-born population - Italy (%)
Place of birth for the foreign-born population - Portugal (%)
Place of birth for the foreign-born population - Spain (%)
Place of birth for the foreign-born population - Other Southern Europe (%)
Place of birth for the foreign-born population - Albania (%)
Place of birth for the foreign-born population - Belarus (%)
Place of birth for the foreign-born population - Bosnia and Herzegovina (%)
Place of birth for the foreign-born population - Bulgaria (%)
Place of birth for the foreign-born population - Croatia (%)
Place of birth for the foreign-born population - Czechoslovakia (%)
Place of birth for the foreign-born population - Hungary (%)
Place of birth for the foreign-born population - Latvia (%)
Place of birth for the foreign-born population - Lithuania (%)
Place of birth for the foreign-born population - North Macedonia (Macedonia) (%)
Place of birth for the foreign-born population - Moldova (%)
Place of birth for the foreign-born population - Poland (%)
Place of birth for the foreign-born population - Romania (%)
Place of birth for the foreign-born population - Russia (%)
Place of birth for the foreign-born population - Serbia (%)
Place of birth for the foreign-born population - Ukraine (%)
Place of birth for the foreign-born population - Other Eastern Europe (%)
Place of birth for the foreign-born population - China (%)
Place of birth for the foreign-born population - Hong Kong (%)
Place of birth for the foreign-born population - Taiwan (%)
Place of birth for the foreign-born population - Japan (%)
Place of birth for the foreign-born population - Korea (%)
Place of birth for the foreign-born population - Other Eastern Asia (%)
Place of birth for the foreign-born population - Afghanistan (%)
Place of birth for the foreign-born population - Bangladesh (%)
Place of birth for the foreign-born population - India (%)
Place of birth for the foreign-born population - Iran (%)
Place of birth for the foreign-born population - Kazakhstan (%)
Place of birth for the foreign-born population - Nepal (%)
Place of birth for the foreign-born population - Pakistan (%)
Place of birth for the foreign-born population - Sri Lanka (%)
Place of birth for the foreign-born population - Uzbekistan (%)
Place of birth for the foreign-born population - Other South Central Asia (%)
Place of birth for the foreign-born population - Burma (%)
Place of birth for the foreign-born population - Cambodia (%)
Place of birth for the foreign-born population - Indonesia (%)
Place of birth for the foreign-born population - Laos (%)
Place of birth for the foreign-born population - Malaysia (%)
Place of birth for the foreign-born population - Philippines (%)
Place of birth for the foreign-born population - Singapore (%)
Place of birth for the foreign-born population - Thailand (%)
Place of birth for the foreign-born population - Vietnam (%)
Place of birth for the foreign-born population - Other South Eastern Asia (%)
Place of birth for the foreign-born population - Armenia (%)
Place of birth for the foreign-born population - Iraq (%)
Place of birth for the foreign-born population - Israel (%)
Place of birth for the foreign-born population - Jordan (%)
Place of birth for the foreign-born population - Kuwait (%)
Place of birth for the foreign-born population - Lebanon (%)
Place of birth for the foreign-born population - Saudi Arabia (%)
Place of birth for the foreign-born population - Syria (%)
Place of birth for the foreign-born population - Turkey (%)
Place of birth for the foreign-born population - Yemen (%)
Place of birth for the foreign-born population - Other Western Asia (%)
Place of birth for the foreign-born population - Eritrea (%)
Place of birth for the foreign-born population - Ethiopia (%)
Place of birth for the foreign-born population - Kenya (%)
Place of birth for the foreign-born population - Somalia (%)
Place of birth for the foreign-born population - Uganda (%)
Place of birth for the foreign-born population - Zimbabwe (%)
Place of birth for the foreign-born population - Other Eastern Africa (%)
Place of birth for the foreign-born population - Cameroon (%)
Place of birth for the foreign-born population - Congo (%)
Place of birth for the foreign-born population - Democratic Republic of Congo (Zaire) (%)
Place of birth for the foreign-born population - Other Middle Africa (%)
Place of birth for the foreign-born population - Egypt (%)
Place of birth for the foreign-born population - Morocco (%)
Place of birth for the foreign-born population - Sudan (%)
Place of birth for the foreign-born population - Other Northern Africa (%)
Place of birth for the foreign-born population - South Africa (%)
Place of birth for the foreign-born population - Other Southern Africa (%)
Place of birth for the foreign-born population - Cabo Verde (%)
Place of birth for the foreign-born population - Ghana (%)
Place of birth for the foreign-born population - Liberia (%)
Place of birth for the foreign-born population - Nigeria (%)
Place of birth for the foreign-born population - Senegal (%)
Place of birth for the foreign-born population - Sierra Leone (%)
Place of birth for the foreign-born population - Other Western Africa (%)
Place of birth for the foreign-born population - Australia (%)
Place of birth for the foreign-born population - New Zealand (%)
Place of birth for the foreign-born population - Fiji (%)
Place of birth for the foreign-born population - Micronesia (%)
Place of birth for the foreign-born population - Bahamas (%)
Place of birth for the foreign-born population - Barbados (%)
Place of birth for the foreign-born population - Cuba (%)
Place of birth for the foreign-born population - Dominica (%)
Place of birth for the foreign-born population - Dominican Republic (%)
Place of birth for the foreign-born population - Grenada (%)
Place of birth for the foreign-born population - Haiti (%)
Place of birth for the foreign-born population - Jamaica (%)
Place of birth for the foreign-born population - St. Vincent and the Grenadines (%)
Place of birth for the foreign-born population - Trinidad and Tobago (%)
Place of birth for the foreign-born population - West Indies (%)
Place of birth for the foreign-born population - Other Caribbean (%)
Place of birth for the foreign-born population - Belize (%)
Place of birth for the foreign-born population - Costa Rica (%)
Place of birth for the foreign-born population - El Salvador (%)
Place of birth for the foreign-born population - Guatemala (%)
Place of birth for the foreign-born population - Honduras (%)
Place of birth for the foreign-born population - Mexico (%)
Place of birth for the foreign-born population - Nicaragua (%)
Place of birth for the foreign-born population - Panama (%)
Place of birth for the foreign-born population - Other Central America (%)
Place of birth for the foreign-born population - Argentina (%)
Place of birth for the foreign-born population - Bolivia (%)
Place of birth for the foreign-born population - Brazil (%)
Place of birth for the foreign-born population - Chile (%)
Place of birth for the foreign-born population - Colombia (%)
Place of birth for the foreign-born population - Ecuador (%)
Place of birth for the foreign-born population - Guyana (%)
Place of birth for the foreign-born population - Peru (%)
Place of birth for the foreign-born population - Uruguay (%)
Place of birth for the foreign-born population - Venezuela (%)
Place of birth for the foreign-born population - Other South America (%)
Place of birth for the foreign-born population - Canada (%)
Place of birth for the foreign-born population - Other Northern America (%)
Place of birth for the foreign-born population - Other (%)
Latest news about races in Lexington-Fayette, KY collected exclusively by city-data.com from local newspapers, TV, and radio stations
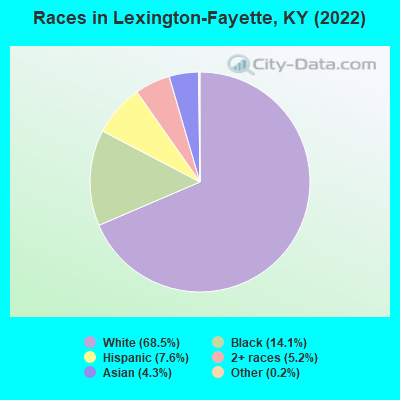
According to 2022 data, the most numerous races in Lexington-Fayette, KY are White alone (219,496 residents), Black alone (45,290 residents), and Hispanic (24,297 residents). 87.0% of Lexington-Fayette residents speak English at home. 10.5% of Lexington-Fayette, KY residents are foreign-born (3.8% born in Asia, 3.2% born in Latin America, 1.8% born in Africa, 1.1% born in Europe), which is 61.7% greater than the foreign-born rate of 4.0% across the entire state of Kentucky.
Race distribution in Lexington-Fayette
2000 2022
206,174 79.1% White alone 34,876 13.4% Black alone 8,561 3.3% Hispanic 6,360 2.4% Asian alone 3,534 1.4% Two or more races 470 0.2% Other race alone 457 0.2% American Indian alone 80 0.03% Native Hawaiian and Other
219,496 68.5% White alone 45,290 14.1% Black alone 24,297 7.6% Hispanic 16,816 5.2% Two or more races 13,853 4.3% Asian alone 481 0.2% Other race alone 86 0.03% Native Hawaiian and Other 28 0.01% American Indian alone
2000 2022
3,608,013 89.3% White alone 293,639 7.3% Black alone 59,939 1.5% Hispanic 37,750 0.9% Two or more races 29,368 0.7% Asian alone 7,939 0.2% American Indian alone 3,846 0.10% Other race alone 1,275 0.03% Native Hawaiian and Other
3,710,998 82.2% White alone 343,194 7.6% Black alone 187,483 4.2% Hispanic 187,394 4.2% Two or more races 62,240 1.4% Asian alone 13,529 0.3% Other race alone 4,302 0.10% American Indian alone 3,170 0.07% Native Hawaiian and Other
Income and house value in Lexington-Fayette Median household income in 2022 $66,400 White non-Hispanic householders$46,661 Black householders$86,031 Asian householders$35,530 Some other race householders$49,603 Two or more races householders$49,382 Hispanic or Latino race householdersMedian 2022 house value $300,185 White Non-Hispanic householders$193,668 Black or African American householders$230,569 American Indian or Alaska Native householders $416,648 Asian householders$225,335 Some other race householders$306,990 Two or more races householders$264,330 Hispanic or Latino householders
Median age by race in Lexington-Fayette
38.5 Median age for White residents38.1 39.1 34.2 Median age for Black or African American residents31.2 37.2 23.6 Median age for American Indian / Alaska Native residents31.5 19.3 34.2 Median age for Asian residents35.0 32.5 -666,666,666.0 Median age for Native Hawaiian / Pacific Islander residents-666,666,666.0 -666,666,666.0 26.4 Median age for Other race residents20.2 32.5 21.6 Median age for Two or more races residents24.1 18.0 38.6 Median age for White alone residents38.2 39.4 24.4 Median age for Hispanic or Latino residents25.8 23.1
Owner/renter occupied households by race in Lexington-Fayette
House owners and renters - White residents 62,562 58.3% Owner occupied44,676 41.7% Renter occupiedHouse owners and renters - Black or African American residents 6,792 38.3% Owner occupied10,924 61.7% Renter occupiedHouse owners and renters - American Indian / Alaska Native residents 70 27.5% Owner occupied186 72.5% Renter occupiedHouse owners and renters - Asian residents 2,537 53.5% Owner occupied2,207 46.5% Renter occupiedHouse owners and renters - Native Hawaiian / Pacific Islander residents 32 100.0% Renter occupiedHouse owners and renters - Other race residents 462 23.8% Owner occupied1,483 76.2% Renter occupiedHouse owners and renters - Two or more races residents 3,681 41.0% Owner occupied5,287 59.0% Renter occupiedHouse owners and renters - White alone residents 61,742 58.4% Owner occupied43,928 41.6% Renter occupiedHouse owners and renters - Hispanic or Latino residents 2,769 39.1% Owner occupied4,315 60.9% Renter occupied
Language usage in Lexington-Fayette
English speakers - Total 87.0% of residents of Lexington-Fayette speak English at home.
5.7% of residents speak Spanish at home 10,718 62.7% Speak English very well6,385 37.3% Speak English less than very well7.3% of residents speak other language at home 11,394 51.5% Speak English very well10,723 48.5% Speak English less than very well
English speakers - Born in the United States 94.8% of residents of Lexington-Fayette speak English at home.
3.6% of residents speak Spanish at home 3,590 98.1% Speak English very well71 1.9% Speak English less than very well1.6% of residents speak other language at home 1,482 89.0% Speak English very well183 11.0% Speak English less than very well
English speakers - Native, born elsewhere 73.2% of residents of Lexington-Fayette speak English at home.
22.5% of residents speak Spanish at home 778 71.5% Speak English very well310 28.5% Speak English less than very well4.3% of residents speak other language at home 209 100.0% Speak English very well
English speakers - Foreign-born 20.4% of residents of Lexington-Fayette speak English at home.
23.6% of residents speak Spanish at home 2,186 28.5% Speak English very well5,483 71.5% Speak English less than very well56.0% of residents speak other language at home 7,754 42.7% Speak English very well10,420 57.3% Speak English less than very well
White (Caucasian) - Speak only English Native:
97.7% (204,163)Foreign-born:
35.4% (1,739)
White (Caucasian) - Speak another language Native:
2.3% (4,714)Foreign-born:
64.6% (3,173)
Black or African American - Speak only English Native:
98.9% (32,933)Foreign-born:
28.9% (2,881)
Black or African American - Speak another language Native:
1.1% (365)Foreign-born:
71.1% (7,083)
American Indian / Alaska Native - Speak only English Native:
65.9% (239)Foreign-born:
0.8% (2)
American Indian / Alaska Native - Speak another language Native:
36.7% (133)Foreign-born:
98.0% (241)
Asian - Speak only English Native:
50.2% (1,898)Foreign-born:
16.8% (1,571)
Asian - Speak another language Native:
49.8% (1,883)Foreign-born:
83.2% (7,792)
Native Hawaiian / Pacific Islander - Speak another language Native:
100.0% (4)Foreign-born:
100.0% (46)
Other race - Speak only English Native:
36.3% (982)Foreign-born:
4.4% (138)
Other race - Speak another language Native:
63.7% (1,723)Foreign-born:
95.6% (2,998)
Two or more races - Speak only English Native:
79.0% (16,832)Foreign-born:
5.7% (279)
Two or more races - Speak another language Native:
21.0% (4,468)Foreign-born:
94.3% (4,629)
White alone - Speak only English Native:
98.4% (202,835)Foreign-born:
42.4% (1,666)
White alone - Speak another language Native:
1.6% (3,297)Foreign-born:
57.6% (2,259)
Hispanic or Latino - Speak only English Native:
44.9% (6,238)Foreign-born:
3.9% (307)
Hispanic or Latino - Speak another language Native:
55.1% (7,665)Foreign-born:
96.1% (7,511)
Foreign-born residents in Lexington-Fayette 33,485 residents are foreign born (3.8% Asia , 3.2% Latin America , 1.8% Africa , 1.1% Europe ).
This city:
10.5%Kentucky:
4.1%
Marital status for residents in Lexington-Fayette Marital status - White (Caucasian) population 15 years and over
Males 38.4% Never married47.5% Now married1.5% Separated1.9% Widowed10.7% DivorcedFemales 33.8% Never married42.7% Now married1.2% Separated6.8% Widowed15.4% DivorcedWomen who gave birth in the past 12 months Now married:
61.0% (1,694)Unmarried:
39.0% (1,084)
Women who did not give birth in the past 12 months Now married:
39.4% (21,215)Unmarried:
60.6% (32,589)
Marital status - Black or African American population 15 years and over
Males 50.6% Never married36.3% Now married2.1% Separated1.1% Widowed9.9% DivorcedFemales 50.9% Never married28.0% Now married1.6% Separated8.6% Widowed11.0% DivorcedWomen who gave birth in the past 12 months Now married:
40.6% (419)Unmarried:
59.4% (614)
Women who did not give birth in the past 12 months Now married:
23.1% (2,669)Unmarried:
76.9% (8,904)
Marital status - American Indian / Alaska Native population 15 years and over
Males 49.7% Never married49.4% Now married0.0% Separated0.9% Widowed0.0% DivorcedFemales 79.8% Never married7.9% Now married3.9% Separated0.0% Widowed8.4% DivorcedWomen who gave birth in the past 12 months Now married:
0.0% (0)Unmarried:
100.0% (6)
Women who did not give birth in the past 12 months Now married:
4.3% (7)Unmarried:
95.7% (158)
Marital status - Asian population 15 years and over
Males 37.2% Never married56.6% Now married0.0% Separated0.6% Widowed5.6% DivorcedFemales 32.2% Never married58.6% Now married0.0% Separated3.4% Widowed5.8% DivorcedWomen who gave birth in the past 12 months Now married:
100.0% (75)Unmarried:
0.0% (0)
Women who did not give birth in the past 12 months Now married:
52.4% (2,368)Unmarried:
47.6% (2,153)
Marital status - Native Hawaiian / Pacific Islander population 15 years and over
Males 100.0% Never married0.0% Now married0.0% Separated0.0% Widowed0.0% DivorcedFemales 0.0% Never married19.0% Now married0.0% Separated0.0% Widowed81.0% DivorcedMarital status - Other race population 15 years and over
Males 55.3% Never married22.6% Now married11.1% Separated0.0% Widowed11.0% DivorcedFemales 29.8% Never married32.2% Now married16.1% Separated3.9% Widowed18.0% DivorcedWomen who gave birth in the past 12 months Now married:
52.7% (38)Unmarried:
47.3% (34)
Women who did not give birth in the past 12 months Now married:
40.1% (973)Unmarried:
59.9% (1,455)
Marital status - Two or more races population 15 years and over
Males 47.5% Never married42.6% Now married0.0% Separated2.2% Widowed7.7% DivorcedFemales 45.8% Never married42.0% Now married1.0% Separated2.5% Widowed8.7% DivorcedWomen who gave birth in the past 12 months Now married:
79.1% (533)Unmarried:
20.9% (141)
Women who did not give birth in the past 12 months Now married:
34.1% (2,082)Unmarried:
65.9% (4,024)
Marital status - White alone, not Hispanic / Latino population 15 years and over
Males 38.4% Never married47.4% Now married1.5% Separated1.9% Widowed10.7% DivorcedFemales 33.8% Never married42.7% Now married1.1% Separated6.9% Widowed15.5% DivorcedWomen who gave birth in the past 12 months Now married:
60.2% (1,639)Unmarried:
39.8% (1,084)
Women who did not give birth in the past 12 months Now married:
39.3% (20,769)Unmarried:
60.7% (32,109)
Marital status - Hispanic or Latino population 15 years and over
Males 41.2% Never married46.6% Now married2.8% Separated0.0% Widowed9.3% DivorcedFemales 41.6% Never married35.0% Now married6.2% Separated3.0% Widowed14.2% DivorcedWomen who gave birth in the past 12 months Now married:
93.6% (485)Unmarried:
6.4% (33)
Women who did not give birth in the past 12 months Now married:
36.0% (2,056)Unmarried:
64.0% (3,663)
Ancestries in Lexington-Fayette
21,308 13.0% American20,663 12.6% English12,509 7.6% German11,356 6.9% Irish3,998 2.4% European2,837 1.7% Italian2,676 1.6% Scottish2,662 1.6% Scotch-Irish1,903 1.2% Nigerian1,562 1.0% African1,462 0.9% Arab1,456 0.9% Polish1,136 0.7% French1,063 0.6% British665 0.4% Dutch649 0.4% Welsh458 0.3% Norwegian457 0.3% Ukrainian426 0.3% Egyptian402 0.2% Swedish400 0.2% Russian383 0.2% Scandinavian351 0.2% French Canadian303 0.2% Portuguese280 0.2% Eastern European276 0.2% Iranian268 0.2% Jamaican266 0.2% Northern European255 0.2% Palestinian216 0.1% Swiss210 0.1% Albanian197 0.1% Haitian185 0.1% Danish183 0.1% Turkish173 0.1% South African163 0.10% Lebanese155 0.09% Bulgarian151 0.09% Afghan148 0.09% Belgian147 0.09% Greek115 0.07% Canadian114 0.07% Hungarian114 0.07% Senegalese112 0.07% Iraqi109 0.07% Austrian97 0.06% Lithuanian82 0.05% Cajun81 0.05% Ethiopian75 0.05% Jordanian69 0.04% Yugoslavian65 0.04% Ghanaian64 0.04% Sudanese64 0.04% Czech58 0.04% Bahamian57 0.03% Armenian57 0.03% Slovak55 0.03% Romanian47 0.03% Kenyan40 0.02% Trinidadian and Tobagonian37 0.02% Czechoslovakian36 0.02% Croatian33 0.02% Icelander25 0.02% Belizean24 0.01% Finnish17 0.01% Moroccan16 0.01% Guyanese16 0.01% Macedonian14 0.01% Sierra Leonean14 0.01% German Russian13 0.01% Slovene12 0.01% Syrian11 0.01% Brazilian10 0.01% Slavic10 0.01% Latvian9 0.01% Serbian
Geographical mobility in Lexington-Fayette Same house 1 year ago 181,215 81.8% White (Caucasian)33,731 74.5% Black or African American465 69.5% American Indian / Alaska Native10,510 75.6% Asian53 100.0% Native Hawaiian / Pacific Islander8,594 78.5% Other race22,603 77.7% Two or more races177,851 81.7% White alone, not Hispanic / Latino17,056 72.0% Hispanic or LatinoMoved within same county 20,077 9.1% White / Caucasian8,576 18.9% Black or African American82 12.3% American Indian / Alaska Native1,616 11.6% Asian1,262 11.5% Other race2,560 8.8% Two or more races19,919 9.1% White alone, not Hispanic / Latino2,760 11.7% Hispanic or LatinoMoved within same state 9,710 4.4% White / Caucasian1,250 2.8% Black or African American21 3.2% American Indian / Alaska Native579 4.2% Asian122 1.1% Other race1,383 4.8% Two or more races9,422 4.3% White alone, not Hispanic / Latino1,248 5.3% Hispanic or LatinoMoved from different state 10,103 4.6% White / Caucasian1,388 3.1% Black or African American575 4.1% Asian218 2.0% Other race1,442 5.0% Two or more races9,980 4.6% White alone, not Hispanic / Latino1,580 6.7% Hispanic or LatinoMoved from abroad 530 0.2% White356 0.8% Black or African American71 10.6% American Indian / Alaska Native618 4.4% Asian620 5.7% Other race1,091 3.8% Two or more races530 0.2% White alone, not Hispanic / Latino1,029 4.3% Hispanic or Latino
Children Nativity (place of birth) in Lexington-Fayette
Children under 6 years - Living with two parents Both parents native 10,305 100.0% NativeBoth parents foreign-born 1,577 90.8% Native159 9.2% Foreign-bornOne native, one foreign-born parent 1,814 100.0% NativeChildren under 6 years - Living with one parent Native parent 5,452 100.0% NativeForeign-born parent 940 100.0% NativeChildren 6 to 17 years - Living with two parents Both parents native 20,771 99.3% Native140 0.7% Foreign-bornBoth parents foreign-born 1,992 40.3% Native2,948 59.7% Foreign-bornOne native, one foreign-born parent 2,483 100.0% NativeChildren 6 to 17 years - Living with one parent Native parent 10,831 100.0% NativeForeign-born parent 2,479 62.3% Native1,502 37.7% Foreign-born
Place of birth for residents in Lexington-Fayette 12,487 Asia11,188 Americas10,622 Latin America8,365 Central America5,963 Africa4,934 South Central Asia4,316 Eastern Asia3,737 Europe2,687 China2,462 Middle Africa1,856 Western Asia1,580 Eastern Europe1,398 South America1,379 Eastern Africa1,338 Western Africa1,194 South Eastern Asia1,166 Northern Europe858 Caribbean763 Western Europe566 Northern America226 Southern Europe224 Northern Africa213 Southern Africa108 Oceania74 Australia and New Zealand Subregion6,395 Mexico2,514 China2,231 India1,411 Democratic Republic of Congo (Zaire)1,336 Nepal1,077 Honduras858 Japan807 Congo777 Iraq740 Nigeria726 Korea566 Canada507 Iran494 Guatemala457 Germany430 England400 Ukraine380 Venezuela361 Vietnam357 Philippines351 Bhutan331 Ghana312 Peru301 Syria297 Kenya281 Colombia263 Ireland260 Bulgaria253 Cambodia225 Jamaica212 Pakistan210 United Kingdom205 France205 Haiti202 Jordan189 Cuba186 Russia183 Panama167 Italy155 South Africa154 Egypt150 Argentina148 Brazil142 Sweden141 Tanzania133 Israel131 El Salvador127 Turkey126 Poland114 Bangladesh107 Taiwan106 Trinidad and Tobago103 Albania89 Thailand85 Senegal82 Ethiopia79 Azerbaijan78 Chile78 Kuwait75 Ivory Coast73 Costa Rica70 Afghanistan69 Belarus66 Sri Lanka66 Hong Kong65 Indonesia64 Lebanon64 Bahamas62 Liberia56 Hungary53 Norway52 Dominican Republic48 New Zealand47 Bosnia and Herzegovina47 Saudi Arabia37 Netherlands37 Scotland34 Croatia31 Austria31 Spain30 Ecuador28 Burma (Myanmar)27 Uganda27 Greece26 Switzerland26 Morocco25 Australia24 Kazakhstan24 Cameroon19 Singapore19 Uzbekistan18 Malaysia18 Moldova16 North Macedonia (Macedonia)15 Guyana12 Romania11 Czechoslovakia11 Zimbabwe10 Latvia9 St. Vincent and the Grenadines9 Sierra Leone7 St. Lucia5 Belgium1 Fiji
Grandparents responsible for own grandchildren in Lexington-Fayette
Grandparents (30 to 59 years) White / Caucasian 267 76.1% Responsible for grandchildren84 23.9% Not responsible for grandchildrenBlack or African American 198 49.7% Responsible for grandchildren200 50.3% Not responsible for grandchildrenAmerican Indian / Alaska Native 5 100.0% Not responsible for grandchildrenAsian 15 9.2% Responsible for grandchildren148 90.8% Not responsible for grandchildrenOther race 26 40.2% Responsible for grandchildren38 59.8% Not responsible for grandchildrenTwo or more races 15 100.0% Not responsible for grandchildrenWhite alone, not Hispanic / Latino 267 76.1% Responsible for grandchildren84 23.9% Not responsible for grandchildrenHispanic or Latino 21 20.6% Responsible for grandchildren82 79.4% Not responsible for grandchildrenGrandparents (60 years and over) White / Caucasian 1,414 60.4% Responsible for grandchildren928 39.6% Not responsible for grandchildrenBlack or African American 239 72.6% Responsible for grandchildren90 27.4% Not responsible for grandchildrenAmerican Indian / Alaska Native 1 97.6% Responsible for grandchildrenAsian 77 26.4% Responsible for grandchildren215 73.6% Not responsible for grandchildrenOther race 43 100.0% Not responsible for grandchildrenTwo or more races 142 57.8% Responsible for grandchildren103 42.2% Not responsible for grandchildrenWhite alone, not Hispanic / Latino 1,414 64.1% Responsible for grandchildren792 35.9% Not responsible for grandchildrenHispanic or Latino 16 14.4% Responsible for grandchildren92 85.6% Not responsible for grandchildren
Zip codes: 40361 , 40502 , 40503 , 40504 , 40505 , 40506 , 40507 , 40508 , 40509 , 40510 , 40511 , 40513 , 40514 , 40515 , 40516 , 40517 .