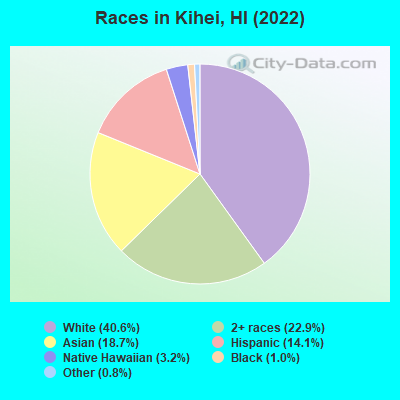
Races in Kihei, Hawaii (HI) Detailed Stats
Data:
Races - White alone (%)
Races - White alone (% change since 2000)
Races - Black alone (%)
Races - Black alone (% change since 2000)
Races - American Indian alone (%)
Races - American Indian alone (% change since 2000)
Races - Asian alone (%)
Races - Asian alone (% change since 2000)
Races - Hispanic (%)
Races - Hispanic (% change since 2000)
Races - Native Hawaiian and Other Pacific Islander alone (%)
Races - Native Hawaiian and Other Pacific Islander alone (% change since 2000)
Races - Two or more races(%)
Races - Two or more races(% change since 2000)
Races - Other race alone (%)
Races - Other race alone (% change since 2000)
Racial diversity
Place of birth - Born in state of residence (%)
Place of birth - Born in state of residence (%) - White
Place of birth - Born in state of residence (%) - Black or African American
Place of birth - Born in state of residence (%) - Asian
Place of birth - Born in state of residence (%) - Hispanic or Latino
Place of birth - Born in state of residence (%) - American Indian and Alaska Native
Place of birth - Born in state of residence (%) - Multirace
Place of birth - Born in state of residence (%) - Other Race
Place of birth - Born in other state (%)
Place of birth - Born in other state (%) - White
Place of birth - Born in other state (%) - Black or African American
Place of birth - Born in other state (%) - Asian
Place of birth - Born in other state (%) - Hispanic or Latino
Place of birth - Born in other state (%) - American Indian and Alaska Native
Place of birth - Born in other state (%) - Multirace
Place of birth - Born in other state (%) - Other Race
Place of birth - Native, outside of US (%)
Place of birth - Native, outside of US (%) - White
Place of birth - Native, outside of US (%) - Black or African American
Place of birth - Native, outside of US (%) - Asian
Place of birth - Native, outside of US (%) - Hispanic or Latino
Place of birth - Native, outside of US (%) - American Indian and Alaska Native
Place of birth - Native, outside of US (%) - Multirace
Place of birth - Native, outside of US (%) - Other Race
Place of birth - Foreign born (%)
Place of birth - Foreign born (%) - White
Place of birth - Foreign born (%) - Black or African American
Place of birth - Foreign born (%) - Asian
Place of birth - Foreign born (%) - Hispanic or Latino
Place of birth - Foreign born (%) - American Indian and Alaska Native
Place of birth - Foreign born (%) - Multirace
Place of birth - Foreign born (%) - Other Race
Residents speaking English at home (%)
Residents speaking English at home - Born in the United States (%)
Residents speaking English at home - Native, born elsewhere (%)
Residents speaking English at home - Foreign born (%)
Residents speaking Spanish at home (%)
Residents speaking Spanish at home - Born in the United States (%)
Residents speaking Spanish at home - Native, born elsewhere (%)
Residents speaking Spanish at home - Foreign born (%)
Residents speaking other language at home (%)
Residents speaking other language at home - Born in the United States (%)
Residents speaking other language at home - Native, born elsewhere (%)
Residents speaking other language at home - Foreign born (%)
Marital status - Never married (%)
Marital status - Now married (%)
Marital status - Separated (%)
Marital status - Widowed (%)
Marital status - Divorced (%)
Ancestries Reported - Arab (%)
Ancestries Reported - Czech (%)
Ancestries Reported - Danish (%)
Ancestries Reported - Dutch (%)
Ancestries Reported - English (%)
Ancestries Reported - French (%)
Ancestries Reported - French Canadian (%)
Ancestries Reported - German (%)
Ancestries Reported - Greek (%)
Ancestries Reported - Hungarian (%)
Ancestries Reported - Irish (%)
Ancestries Reported - Italian (%)
Ancestries Reported - Lithuanian (%)
Ancestries Reported - Norwegian (%)
Ancestries Reported - Polish (%)
Ancestries Reported - Portuguese (%)
Ancestries Reported - Russian (%)
Ancestries Reported - Scotch-Irish (%)
Ancestries Reported - Scottish (%)
Ancestries Reported - Slovak (%)
Ancestries Reported - Subsaharan African (%)
Ancestries Reported - Swedish (%)
Ancestries Reported - Swiss (%)
Ancestries Reported - Ukrainian (%)
Ancestries Reported - United States (%)
Ancestries Reported - Welsh (%)
Ancestries Reported - West Indian (%)
Ancestries Reported - Other (%)
Geographical mobility - Same house 1 year ago (%)
Geographical mobility - Same house 1 year ago (%) - White
Geographical mobility - Same house 1 year ago (%) - Black or African American
Geographical mobility - Same house 1 year ago (%) - Asian
Geographical mobility - Same house 1 year ago (%) - Hispanic or Latino
Geographical mobility - Same house 1 year ago (%) - American Indian and Alaska Native
Geographical mobility - Same house 1 year ago (%) - Multirace
Geographical mobility - Same house 1 year ago (%) - Other Race
Geographical mobility - Moved within same county (%)
Geographical mobility - Moved within same county (%) - White
Geographical mobility - Moved within same county (%) - Black or African American
Geographical mobility - Moved within same county (%) - Asian
Geographical mobility - Moved within same county (%) - Hispanic or Latino
Geographical mobility - Moved within same county (%) - American Indian and Alaska Native
Geographical mobility - Moved within same county (%) - Multirace
Geographical mobility - Moved within same county (%) - Other Race
Geographical mobility - Moved from different county within same state (%)
Geographical mobility - Moved from different county within same state (%) - White
Geographical mobility - Moved from different county within same state (%) - Black or African American
Geographical mobility - Moved from different county within same state (%) - Asian
Geographical mobility - Moved from different county within same state (%) - Hispanic or Latino
Geographical mobility - Moved from different county within same state (%) - American Indian and Alaska Native
Geographical mobility - Moved from different county within same state (%) - Multirace
Geographical mobility - Moved from different county within same state (%) - Other Race
Geographical mobility - Moved from different state (%)
Geographical mobility - Moved from different state (%) - White
Geographical mobility - Moved from different state (%) - Black or African American
Geographical mobility - Moved from different state (%) - Asian
Geographical mobility - Moved from different state (%) - Hispanic or Latino
Geographical mobility - Moved from different state (%) - American Indian and Alaska Native
Geographical mobility - Moved from different state (%) - Multirace
Geographical mobility - Moved from different state (%) - Other Race
Geographical mobility - Moved from abroad (%)
Geographical mobility - Moved from abroad (%) - White
Geographical mobility - Moved from abroad (%) - Black or African American
Geographical mobility - Moved from abroad (%) - Asian
Geographical mobility - Moved from abroad (%) - Hispanic or Latino
Geographical mobility - Moved from abroad (%) - American Indian and Alaska Native
Geographical mobility - Moved from abroad (%) - Multirace
Geographical mobility - Moved from abroad (%) - Other Race
Place of birth for the foreign-born population - Ireland (%)
Place of birth for the foreign-born population - Denmark (%)
Place of birth for the foreign-born population - Norway (%)
Place of birth for the foreign-born population - Sweden (%)
Place of birth for the foreign-born population - United Kingdom (%)
Place of birth for the foreign-born population - England (%)
Place of birth for the foreign-born population - Scotland (%)
Place of birth for the foreign-born population - Other Northern Europe (%)
Place of birth for the foreign-born population - Austria (%)
Place of birth for the foreign-born population - Belgium (%)
Place of birth for the foreign-born population - France (%)
Place of birth for the foreign-born population - Germany (%)
Place of birth for the foreign-born population - Netherlands (%)
Place of birth for the foreign-born population - Switzerland (%)
Place of birth for the foreign-born population - Other Western Europe (%)
Place of birth for the foreign-born population - Greece (%)
Place of birth for the foreign-born population - Italy (%)
Place of birth for the foreign-born population - Portugal (%)
Place of birth for the foreign-born population - Spain (%)
Place of birth for the foreign-born population - Other Southern Europe (%)
Place of birth for the foreign-born population - Albania (%)
Place of birth for the foreign-born population - Belarus (%)
Place of birth for the foreign-born population - Bosnia and Herzegovina (%)
Place of birth for the foreign-born population - Bulgaria (%)
Place of birth for the foreign-born population - Croatia (%)
Place of birth for the foreign-born population - Czechoslovakia (%)
Place of birth for the foreign-born population - Hungary (%)
Place of birth for the foreign-born population - Latvia (%)
Place of birth for the foreign-born population - Lithuania (%)
Place of birth for the foreign-born population - North Macedonia (Macedonia) (%)
Place of birth for the foreign-born population - Moldova (%)
Place of birth for the foreign-born population - Poland (%)
Place of birth for the foreign-born population - Romania (%)
Place of birth for the foreign-born population - Russia (%)
Place of birth for the foreign-born population - Serbia (%)
Place of birth for the foreign-born population - Ukraine (%)
Place of birth for the foreign-born population - Other Eastern Europe (%)
Place of birth for the foreign-born population - China (%)
Place of birth for the foreign-born population - Hong Kong (%)
Place of birth for the foreign-born population - Taiwan (%)
Place of birth for the foreign-born population - Japan (%)
Place of birth for the foreign-born population - Korea (%)
Place of birth for the foreign-born population - Other Eastern Asia (%)
Place of birth for the foreign-born population - Afghanistan (%)
Place of birth for the foreign-born population - Bangladesh (%)
Place of birth for the foreign-born population - India (%)
Place of birth for the foreign-born population - Iran (%)
Place of birth for the foreign-born population - Kazakhstan (%)
Place of birth for the foreign-born population - Nepal (%)
Place of birth for the foreign-born population - Pakistan (%)
Place of birth for the foreign-born population - Sri Lanka (%)
Place of birth for the foreign-born population - Uzbekistan (%)
Place of birth for the foreign-born population - Other South Central Asia (%)
Place of birth for the foreign-born population - Burma (%)
Place of birth for the foreign-born population - Cambodia (%)
Place of birth for the foreign-born population - Indonesia (%)
Place of birth for the foreign-born population - Laos (%)
Place of birth for the foreign-born population - Malaysia (%)
Place of birth for the foreign-born population - Philippines (%)
Place of birth for the foreign-born population - Singapore (%)
Place of birth for the foreign-born population - Thailand (%)
Place of birth for the foreign-born population - Vietnam (%)
Place of birth for the foreign-born population - Other South Eastern Asia (%)
Place of birth for the foreign-born population - Armenia (%)
Place of birth for the foreign-born population - Iraq (%)
Place of birth for the foreign-born population - Israel (%)
Place of birth for the foreign-born population - Jordan (%)
Place of birth for the foreign-born population - Kuwait (%)
Place of birth for the foreign-born population - Lebanon (%)
Place of birth for the foreign-born population - Saudi Arabia (%)
Place of birth for the foreign-born population - Syria (%)
Place of birth for the foreign-born population - Turkey (%)
Place of birth for the foreign-born population - Yemen (%)
Place of birth for the foreign-born population - Other Western Asia (%)
Place of birth for the foreign-born population - Eritrea (%)
Place of birth for the foreign-born population - Ethiopia (%)
Place of birth for the foreign-born population - Kenya (%)
Place of birth for the foreign-born population - Somalia (%)
Place of birth for the foreign-born population - Uganda (%)
Place of birth for the foreign-born population - Zimbabwe (%)
Place of birth for the foreign-born population - Other Eastern Africa (%)
Place of birth for the foreign-born population - Cameroon (%)
Place of birth for the foreign-born population - Congo (%)
Place of birth for the foreign-born population - Democratic Republic of Congo (Zaire) (%)
Place of birth for the foreign-born population - Other Middle Africa (%)
Place of birth for the foreign-born population - Egypt (%)
Place of birth for the foreign-born population - Morocco (%)
Place of birth for the foreign-born population - Sudan (%)
Place of birth for the foreign-born population - Other Northern Africa (%)
Place of birth for the foreign-born population - South Africa (%)
Place of birth for the foreign-born population - Other Southern Africa (%)
Place of birth for the foreign-born population - Cabo Verde (%)
Place of birth for the foreign-born population - Ghana (%)
Place of birth for the foreign-born population - Liberia (%)
Place of birth for the foreign-born population - Nigeria (%)
Place of birth for the foreign-born population - Senegal (%)
Place of birth for the foreign-born population - Sierra Leone (%)
Place of birth for the foreign-born population - Other Western Africa (%)
Place of birth for the foreign-born population - Australia (%)
Place of birth for the foreign-born population - New Zealand (%)
Place of birth for the foreign-born population - Fiji (%)
Place of birth for the foreign-born population - Micronesia (%)
Place of birth for the foreign-born population - Bahamas (%)
Place of birth for the foreign-born population - Barbados (%)
Place of birth for the foreign-born population - Cuba (%)
Place of birth for the foreign-born population - Dominica (%)
Place of birth for the foreign-born population - Dominican Republic (%)
Place of birth for the foreign-born population - Grenada (%)
Place of birth for the foreign-born population - Haiti (%)
Place of birth for the foreign-born population - Jamaica (%)
Place of birth for the foreign-born population - St. Vincent and the Grenadines (%)
Place of birth for the foreign-born population - Trinidad and Tobago (%)
Place of birth for the foreign-born population - West Indies (%)
Place of birth for the foreign-born population - Other Caribbean (%)
Place of birth for the foreign-born population - Belize (%)
Place of birth for the foreign-born population - Costa Rica (%)
Place of birth for the foreign-born population - El Salvador (%)
Place of birth for the foreign-born population - Guatemala (%)
Place of birth for the foreign-born population - Honduras (%)
Place of birth for the foreign-born population - Mexico (%)
Place of birth for the foreign-born population - Nicaragua (%)
Place of birth for the foreign-born population - Panama (%)
Place of birth for the foreign-born population - Other Central America (%)
Place of birth for the foreign-born population - Argentina (%)
Place of birth for the foreign-born population - Bolivia (%)
Place of birth for the foreign-born population - Brazil (%)
Place of birth for the foreign-born population - Chile (%)
Place of birth for the foreign-born population - Colombia (%)
Place of birth for the foreign-born population - Ecuador (%)
Place of birth for the foreign-born population - Guyana (%)
Place of birth for the foreign-born population - Peru (%)
Place of birth for the foreign-born population - Uruguay (%)
Place of birth for the foreign-born population - Venezuela (%)
Place of birth for the foreign-born population - Other South America (%)
Place of birth for the foreign-born population - Canada (%)
Place of birth for the foreign-born population - Other Northern America (%)
Place of birth for the foreign-born population - Other (%)
Latest news about races in Kihei, HI collected exclusively by city-data.com from local newspapers, TV, and radio stations
According to 2022 data, the most numerous races in Kihei, HI are Asian alone (4,152 residents), Two or more races (5,083 residents), and White alone (9,019 residents). 81.1% of Kihei residents speak English at home. 16.5% of Kihei, HI residents are foreign-born (10.6% born in Asia), which is 9.4% less than the foreign-born rate of 18.0% across the entire state of Hawaii.
Race distribution in Kihei
2000 2022
494,149 40.8% Asian alone 277,091 22.9% White alone 218,700 18.1% Two or more races 108,441 9.0% Native Hawaiian and Other 87,699 7.2% Hispanic 20,829 1.7% Black alone 2,089 0.2% Other race alone 2,539 0.2% American Indian alone
498,125 34.6% Asian alone 318,574 22.1% Two or more races 297,937 20.7% White alone 160,103 11.1% Hispanic 134,567 9.3% Native Hawaiian and Other 23,682 1.6% Black alone 5,378 0.4% Other race alone 1,830 0.1% American Indian alone
Income and house value in Kihei Median household income in 2022 $83,664 White non-Hispanic householders$98,811 Black householders$104,646 Asian householders$109,701 Native Hawaiian and other Pacific Islander householders$100,824 Two or more races householders$47,986 Hispanic or Latino race householdersMedian 2022 house value over $1,000,000 White Non-Hispanic householdersover $1,000,000 Black or African American householders$924,792 American Indian or Alaska Native householders $964,661 Asian householders$809,296 Native Hawaiian and other Pacific Islander householders$816,283 Some other race householdersover $1,000,000 Two or more races householders$914,106 Hispanic or Latino householders
Median age by race in Kihei
49.4 Median age for White residents49.8 48.8 52.2 Median age for Black or African American residents63.4 47.2 27.8 Median age for American Indian / Alaska Native residents-496,598,639.0 -904,439,427.2 46.2 Median age for Asian residents49.6 45.0 47.4 Median age for Native Hawaiian / Pacific Islander residents49.9 43.1 35.0 Median age for Other race residents42.8 33.3 28.6 Median age for Two or more races residents32.9 27.4 50.7 Median age for White alone residents50.8 50.5 27.6 Median age for Hispanic or Latino residents38.5 24.2
Owner/renter occupied households by race in Kihei
House owners and renters - White residents 2,794 63.6% Owner occupied1,601 36.4% Renter occupiedHouse owners and renters - Black or African American residents 69 75.7% Owner occupied22 24.3% Renter occupiedHouse owners and renters - American Indian / Alaska Native residents 87 100.0% Renter occupiedHouse owners and renters - Asian residents 936 73.1% Owner occupied345 26.9% Renter occupiedHouse owners and renters - Native Hawaiian / Pacific Islander residents 68 55.2% Owner occupied55 44.8% Renter occupiedHouse owners and renters - Other race residents 14 3.9% Owner occupied336 96.1% Renter occupiedHouse owners and renters - Two or more races residents 1,088 54.8% Owner occupied896 45.2% Renter occupiedHouse owners and renters - White alone residents 2,664 63.3% Owner occupied1,544 36.7% Renter occupiedHouse owners and renters - Hispanic or Latino residents 298 31.0% Owner occupied663 69.0% Renter occupied
Language usage in Kihei
English speakers - Total 81.1% of residents of Kihei speak English at home.
2.8% of residents speak Spanish at home 288 48.7% Speak English very well303 51.3% Speak English less than very well16.4% of residents speak other language at home 2,298 66.3% Speak English very well1,166 33.7% Speak English less than very well
English speakers - Born in the United States 97.2% of residents of Kihei speak English at home.
1.2% of residents speak Spanish at home 97 80.8% Speak English very well23 19.2% Speak English less than very well2.4% of residents speak other language at home 213 89.5% Speak English very well25 10.5% Speak English less than very well
English speakers - Native, born elsewhere 89.6% of residents of Kihei speak English at home.
3.8% of residents speak Spanish at home 12 100.0% Speak English less than very well15.8% of residents speak other language at home 22 44.0% Speak English very well28 56.0% Speak English less than very well
English speakers - Foreign-born 23.5% of residents of Kihei speak English at home.
5.9% of residents speak Spanish at home 83 49.7% Speak English very well84 50.3% Speak English less than very well70.4% of residents speak other language at home 1,118 55.7% Speak English very well890 44.3% Speak English less than very well
White (Caucasian) - Speak only English Native:
95.1% (8,254)Foreign-born:
67.8% (434)
White (Caucasian) - Speak another language Native:
4.7% (404)Foreign-born:
31.5% (201)
Black or African American - Speak only English Native:
95.6% (146)Foreign-born:
100.0% (18)
Asian - Speak only English Native:
89.9% (2,034)Foreign-born:
6.9% (125)
Asian - Speak another language Native:
10.6% (240)Foreign-born:
94.1% (1,698)
Native Hawaiian / Pacific Islander - Speak only English Native:
73.6% (498)Foreign-born:
6.8% (11)
Native Hawaiian / Pacific Islander - Speak another language Native:
25.3% (171)Foreign-born:
94.3% (157)
Other race - Speak only English Native:
59.3% (237)Foreign-born:
13.8% (34)
Other race - Speak another language Native:
41.2% (165)Foreign-born:
61.4% (151)
Two or more races - Speak only English Native:
88.3% (5,255)Foreign-born:
48.1% (81)
Two or more races - Speak another language Native:
11.9% (707)Foreign-born:
53.1% (90)
White alone - Speak only English Native:
96.5% (7,958)Foreign-born:
68.5% (385)
White alone - Speak another language Native:
3.5% (286)Foreign-born:
30.9% (174)
Hispanic or Latino - Speak only English Native:
80.8% (2,085)Foreign-born:
37.9% (133)
Hispanic or Latino - Speak another language Native:
19.7% (508)Foreign-born:
58.4% (204)
Foreign-born residents in Kihei 3,651 residents are foreign born (10.6% Asia ).
This city:
16.5%Hawaii:
18.0%
Marital status for residents in Kihei Marital status - White (Caucasian) population 15 years and over
Males 27.5% Never married56.4% Now married0.2% Separated0.7% Widowed15.2% DivorcedFemales 27.5% Never married46.1% Now married1.6% Separated6.6% Widowed18.2% DivorcedWomen who gave birth in the past 12 months Now married:
88.5% (64)Unmarried:
11.5% (8)
Women who did not give birth in the past 12 months Now married:
46.0% (948)Unmarried:
54.0% (1,115)
Marital status - Black or African American population 15 years and over
Males 40.2% Never married35.6% Now married0.0% Separated0.0% Widowed24.2% DivorcedFemales 21.4% Never married78.6% Now married0.0% Separated0.0% Widowed0.0% DivorcedWomen who did not give birth in the past 12 months Now married:
72.7% (31)Unmarried:
27.3% (12)
Marital status - American Indian / Alaska Native population 15 years and over
Males 75.7% Never married24.3% Now married0.0% Separated0.0% Widowed0.0% DivorcedFemales 0.0% Never married100.0% Now married0.0% Separated0.0% Widowed0.0% DivorcedWomen who did not give birth in the past 12 months Now married:
100.0% (7)Unmarried:
0.0% (0)
Marital status - Asian population 15 years and over
Males 36.8% Never married53.6% Now married1.4% Separated5.4% Widowed2.9% DivorcedFemales 27.6% Never married49.9% Now married2.0% Separated9.0% Widowed11.6% DivorcedWomen who gave birth in the past 12 months Now married:
100.0% (14)Unmarried:
0.0% (0)
Women who did not give birth in the past 12 months Now married:
42.4% (414)Unmarried:
57.6% (562)
Marital status - Native Hawaiian / Pacific Islander population 15 years and over
Males 32.6% Never married60.5% Now married0.0% Separated0.3% Widowed6.6% DivorcedFemales 34.3% Never married40.8% Now married4.6% Separated19.3% Widowed1.1% DivorcedWomen who did not give birth in the past 12 months Now married:
44.5% (131)Unmarried:
55.5% (163)
Marital status - Other race population 15 years and over
Males 47.7% Never married46.2% Now married0.0% Separated0.0% Widowed6.1% DivorcedFemales 60.2% Never married29.6% Now married0.0% Separated0.0% Widowed10.2% DivorcedWomen who did not give birth in the past 12 months Now married:
22.0% (58)Unmarried:
78.0% (205)
Marital status - Two or more races population 15 years and over
Males 55.9% Never married34.6% Now married0.0% Separated1.0% Widowed8.5% DivorcedFemales 51.4% Never married38.1% Now married0.2% Separated4.2% Widowed6.0% DivorcedWomen who gave birth in the past 12 months Now married:
48.8% (108)Unmarried:
51.2% (114)
Women who did not give birth in the past 12 months Now married:
27.4% (472)Unmarried:
72.6% (1,254)
Marital status - White alone, not Hispanic / Latino population 15 years and over
Males 26.8% Never married56.6% Now married0.2% Separated0.8% Widowed15.6% DivorcedFemales 28.2% Never married45.3% Now married1.7% Separated6.9% Widowed17.8% DivorcedWomen who gave birth in the past 12 months Now married:
88.5% (67)Unmarried:
11.5% (9)
Women who did not give birth in the past 12 months Now married:
44.6% (900)Unmarried:
55.4% (1,117)
Marital status - Hispanic or Latino population 15 years and over
Males 46.2% Never married46.1% Now married0.0% Separated1.7% Widowed6.1% DivorcedFemales 65.6% Never married25.5% Now married0.0% Separated1.2% Widowed7.8% DivorcedWomen who gave birth in the past 12 months Now married:
0.0% (0)Unmarried:
100.0% (64)
Women who did not give birth in the past 12 months Now married:
20.1% (171)Unmarried:
79.9% (681)
Ancestries in Kihei
469 5.3% German385 4.3% English282 3.2% American195 2.2% Irish163 1.8% Italian155 1.7% Norwegian150 1.7% Greek130 1.5% European90 1.0% French85 1.0% Scottish77 0.9% Polish69 0.8% Danish68 0.8% Portuguese54 0.6% Finnish54 0.6% Swedish53 0.6% Swiss51 0.6% French Canadian41 0.5% Brazilian40 0.4% Dutch38 0.4% Canadian38 0.4% Russian35 0.4% Scotch-Irish27 0.3% Welsh26 0.3% Northern European25 0.3% British23 0.3% Iranian23 0.3% Latvian15 0.2% Guyanese12 0.1% Eastern European12 0.1% Maltese10 0.1% Czech9 0.1% Moroccan9 0.1% Lithuanian9 0.1% Ukrainian8 0.09% Haitian7 0.08% African6 0.07% Austrian6 0.07% Luxembourger6 0.07% Hungarian4 0.04% Jordanian4 0.04% Czechoslovakian
Geographical mobility in Kihei Same house 1 year ago 7,499 79.1% White (Caucasian)148 86.3% Black or African American22 27.9% American Indian / Alaska Native4,035 94.6% Asian598 80.5% Native Hawaiian / Pacific Islander623 90.6% Other race5,340 82.7% Two or more races7,041 78.7% White alone, not Hispanic / Latino2,153 73.1% Hispanic or LatinoMoved within same county 1,032 10.9% White / Caucasian7 4.1% Black or African American119 100.0% American Indian / Alaska Native180 4.2% Asian72 9.7% Native Hawaiian / Pacific Islander1 0.1% Other race589 9.1% Two or more races1,021 11.4% White alone, not Hispanic / Latino440 14.9% Hispanic or LatinoMoved within same state 103 1.1% White / Caucasian10 5.8% Black or African American63 1.5% Asian18 2.6% Other race7 0.1% Two or more races104 1.2% White alone, not Hispanic / Latino28 1.0% Hispanic or LatinoMoved from different state 724 7.6% White / Caucasian43 1.0% Asian87 11.7% Native Hawaiian / Pacific Islander56 8.1% Other race519 8.0% Two or more races627 7.0% White alone, not Hispanic / Latino527 17.9% Hispanic or LatinoMoved from abroad 64 0.7% White49 1.2% Asian66 0.7% White alone, not Hispanic / Latino1 0.0% Hispanic or Latino
Children Nativity (place of birth) in Kihei
Children under 6 years - Living with two parents Both parents native 533 100.0% NativeBoth parents foreign-born 64 100.0% NativeOne native, one foreign-born parent 110 100.0% NativeChildren under 6 years - Living with one parent Native parent 475 100.0% NativeForeign-born parent 28 100.0% NativeChildren 6 to 17 years - Living with two parents Both parents native 812 100.0% NativeBoth parents foreign-born 80 59.7% Native54 40.3% Foreign-bornOne native, one foreign-born parent 386 100.0% NativeChildren 6 to 17 years - Living with one parent Native parent 1,011 100.0% NativeForeign-born parent 481 47.4% Native534 52.6% Foreign-born
Grandparents responsible for own grandchildren in Kihei
Grandparents (30 to 59 years) White / Caucasian 4 4.5% Responsible for grandchildren81 95.5% Not responsible for grandchildrenAsian 9 38.8% Responsible for grandchildren14 61.2% Not responsible for grandchildrenNative Hawaiian / Pacific Islander 1 67.9% Responsible for grandchildrenOther race 18 100.0% Not responsible for grandchildrenTwo or more races 6 5.2% Responsible for grandchildren107 94.8% Not responsible for grandchildrenWhite alone, not Hispanic / Latino 62 100.0% Not responsible for grandchildrenHispanic or Latino 4 15.6% Responsible for grandchildren21 84.4% Not responsible for grandchildrenGrandparents (60 years and over) White / Caucasian 71 34.5% Responsible for grandchildren134 65.5% Not responsible for grandchildrenAsian 339 100.0% Not responsible for grandchildrenNative Hawaiian / Pacific Islander 2 100.0% Not responsible for grandchildrenTwo or more races 22 28.6% Responsible for grandchildren55 71.4% Not responsible for grandchildrenWhite alone, not Hispanic / Latino 36 21.1% Responsible for grandchildren134 78.9% Not responsible for grandchildrenHispanic or Latino 9 20.9% Responsible for grandchildren35 79.1% Not responsible for grandchildren