Races in Houma, Louisiana (LA) Detailed Stats
Data:
Races - White alone (%)
Races - White alone (% change since 2000)
Races - Black alone (%)
Races - Black alone (% change since 2000)
Races - American Indian alone (%)
Races - American Indian alone (% change since 2000)
Races - Asian alone (%)
Races - Asian alone (% change since 2000)
Races - Hispanic (%)
Races - Hispanic (% change since 2000)
Races - Native Hawaiian and Other Pacific Islander alone (%)
Races - Native Hawaiian and Other Pacific Islander alone (% change since 2000)
Races - Two or more races(%)
Races - Two or more races(% change since 2000)
Races - Other race alone (%)
Races - Other race alone (% change since 2000)
Racial diversity
Place of birth - Born in state of residence (%)
Place of birth - Born in state of residence (%) - White
Place of birth - Born in state of residence (%) - Black or African American
Place of birth - Born in state of residence (%) - Asian
Place of birth - Born in state of residence (%) - Hispanic or Latino
Place of birth - Born in state of residence (%) - American Indian and Alaska Native
Place of birth - Born in state of residence (%) - Multirace
Place of birth - Born in state of residence (%) - Other Race
Place of birth - Born in other state (%)
Place of birth - Born in other state (%) - White
Place of birth - Born in other state (%) - Black or African American
Place of birth - Born in other state (%) - Asian
Place of birth - Born in other state (%) - Hispanic or Latino
Place of birth - Born in other state (%) - American Indian and Alaska Native
Place of birth - Born in other state (%) - Multirace
Place of birth - Born in other state (%) - Other Race
Place of birth - Native, outside of US (%)
Place of birth - Native, outside of US (%) - White
Place of birth - Native, outside of US (%) - Black or African American
Place of birth - Native, outside of US (%) - Asian
Place of birth - Native, outside of US (%) - Hispanic or Latino
Place of birth - Native, outside of US (%) - American Indian and Alaska Native
Place of birth - Native, outside of US (%) - Multirace
Place of birth - Native, outside of US (%) - Other Race
Place of birth - Foreign born (%)
Place of birth - Foreign born (%) - White
Place of birth - Foreign born (%) - Black or African American
Place of birth - Foreign born (%) - Asian
Place of birth - Foreign born (%) - Hispanic or Latino
Place of birth - Foreign born (%) - American Indian and Alaska Native
Place of birth - Foreign born (%) - Multirace
Place of birth - Foreign born (%) - Other Race
Residents speaking English at home (%)
Residents speaking English at home - Born in the United States (%)
Residents speaking English at home - Native, born elsewhere (%)
Residents speaking English at home - Foreign born (%)
Residents speaking Spanish at home (%)
Residents speaking Spanish at home - Born in the United States (%)
Residents speaking Spanish at home - Native, born elsewhere (%)
Residents speaking Spanish at home - Foreign born (%)
Residents speaking other language at home (%)
Residents speaking other language at home - Born in the United States (%)
Residents speaking other language at home - Native, born elsewhere (%)
Residents speaking other language at home - Foreign born (%)
Marital status - Never married (%)
Marital status - Now married (%)
Marital status - Separated (%)
Marital status - Widowed (%)
Marital status - Divorced (%)
Ancestries Reported - Arab (%)
Ancestries Reported - Czech (%)
Ancestries Reported - Danish (%)
Ancestries Reported - Dutch (%)
Ancestries Reported - English (%)
Ancestries Reported - French (%)
Ancestries Reported - French Canadian (%)
Ancestries Reported - German (%)
Ancestries Reported - Greek (%)
Ancestries Reported - Hungarian (%)
Ancestries Reported - Irish (%)
Ancestries Reported - Italian (%)
Ancestries Reported - Lithuanian (%)
Ancestries Reported - Norwegian (%)
Ancestries Reported - Polish (%)
Ancestries Reported - Portuguese (%)
Ancestries Reported - Russian (%)
Ancestries Reported - Scotch-Irish (%)
Ancestries Reported - Scottish (%)
Ancestries Reported - Slovak (%)
Ancestries Reported - Subsaharan African (%)
Ancestries Reported - Swedish (%)
Ancestries Reported - Swiss (%)
Ancestries Reported - Ukrainian (%)
Ancestries Reported - United States (%)
Ancestries Reported - Welsh (%)
Ancestries Reported - West Indian (%)
Ancestries Reported - Other (%)
Geographical mobility - Same house 1 year ago (%)
Geographical mobility - Same house 1 year ago (%) - White
Geographical mobility - Same house 1 year ago (%) - Black or African American
Geographical mobility - Same house 1 year ago (%) - Asian
Geographical mobility - Same house 1 year ago (%) - Hispanic or Latino
Geographical mobility - Same house 1 year ago (%) - American Indian and Alaska Native
Geographical mobility - Same house 1 year ago (%) - Multirace
Geographical mobility - Same house 1 year ago (%) - Other Race
Geographical mobility - Moved within same county (%)
Geographical mobility - Moved within same county (%) - White
Geographical mobility - Moved within same county (%) - Black or African American
Geographical mobility - Moved within same county (%) - Asian
Geographical mobility - Moved within same county (%) - Hispanic or Latino
Geographical mobility - Moved within same county (%) - American Indian and Alaska Native
Geographical mobility - Moved within same county (%) - Multirace
Geographical mobility - Moved within same county (%) - Other Race
Geographical mobility - Moved from different county within same state (%)
Geographical mobility - Moved from different county within same state (%) - White
Geographical mobility - Moved from different county within same state (%) - Black or African American
Geographical mobility - Moved from different county within same state (%) - Asian
Geographical mobility - Moved from different county within same state (%) - Hispanic or Latino
Geographical mobility - Moved from different county within same state (%) - American Indian and Alaska Native
Geographical mobility - Moved from different county within same state (%) - Multirace
Geographical mobility - Moved from different county within same state (%) - Other Race
Geographical mobility - Moved from different state (%)
Geographical mobility - Moved from different state (%) - White
Geographical mobility - Moved from different state (%) - Black or African American
Geographical mobility - Moved from different state (%) - Asian
Geographical mobility - Moved from different state (%) - Hispanic or Latino
Geographical mobility - Moved from different state (%) - American Indian and Alaska Native
Geographical mobility - Moved from different state (%) - Multirace
Geographical mobility - Moved from different state (%) - Other Race
Geographical mobility - Moved from abroad (%)
Geographical mobility - Moved from abroad (%) - White
Geographical mobility - Moved from abroad (%) - Black or African American
Geographical mobility - Moved from abroad (%) - Asian
Geographical mobility - Moved from abroad (%) - Hispanic or Latino
Geographical mobility - Moved from abroad (%) - American Indian and Alaska Native
Geographical mobility - Moved from abroad (%) - Multirace
Geographical mobility - Moved from abroad (%) - Other Race
Place of birth for the foreign-born population - Ireland (%)
Place of birth for the foreign-born population - Denmark (%)
Place of birth for the foreign-born population - Norway (%)
Place of birth for the foreign-born population - Sweden (%)
Place of birth for the foreign-born population - United Kingdom (%)
Place of birth for the foreign-born population - England (%)
Place of birth for the foreign-born population - Scotland (%)
Place of birth for the foreign-born population - Other Northern Europe (%)
Place of birth for the foreign-born population - Austria (%)
Place of birth for the foreign-born population - Belgium (%)
Place of birth for the foreign-born population - France (%)
Place of birth for the foreign-born population - Germany (%)
Place of birth for the foreign-born population - Netherlands (%)
Place of birth for the foreign-born population - Switzerland (%)
Place of birth for the foreign-born population - Other Western Europe (%)
Place of birth for the foreign-born population - Greece (%)
Place of birth for the foreign-born population - Italy (%)
Place of birth for the foreign-born population - Portugal (%)
Place of birth for the foreign-born population - Spain (%)
Place of birth for the foreign-born population - Other Southern Europe (%)
Place of birth for the foreign-born population - Albania (%)
Place of birth for the foreign-born population - Belarus (%)
Place of birth for the foreign-born population - Bosnia and Herzegovina (%)
Place of birth for the foreign-born population - Bulgaria (%)
Place of birth for the foreign-born population - Croatia (%)
Place of birth for the foreign-born population - Czechoslovakia (%)
Place of birth for the foreign-born population - Hungary (%)
Place of birth for the foreign-born population - Latvia (%)
Place of birth for the foreign-born population - Lithuania (%)
Place of birth for the foreign-born population - North Macedonia (Macedonia) (%)
Place of birth for the foreign-born population - Moldova (%)
Place of birth for the foreign-born population - Poland (%)
Place of birth for the foreign-born population - Romania (%)
Place of birth for the foreign-born population - Russia (%)
Place of birth for the foreign-born population - Serbia (%)
Place of birth for the foreign-born population - Ukraine (%)
Place of birth for the foreign-born population - Other Eastern Europe (%)
Place of birth for the foreign-born population - China (%)
Place of birth for the foreign-born population - Hong Kong (%)
Place of birth for the foreign-born population - Taiwan (%)
Place of birth for the foreign-born population - Japan (%)
Place of birth for the foreign-born population - Korea (%)
Place of birth for the foreign-born population - Other Eastern Asia (%)
Place of birth for the foreign-born population - Afghanistan (%)
Place of birth for the foreign-born population - Bangladesh (%)
Place of birth for the foreign-born population - India (%)
Place of birth for the foreign-born population - Iran (%)
Place of birth for the foreign-born population - Kazakhstan (%)
Place of birth for the foreign-born population - Nepal (%)
Place of birth for the foreign-born population - Pakistan (%)
Place of birth for the foreign-born population - Sri Lanka (%)
Place of birth for the foreign-born population - Uzbekistan (%)
Place of birth for the foreign-born population - Other South Central Asia (%)
Place of birth for the foreign-born population - Burma (%)
Place of birth for the foreign-born population - Cambodia (%)
Place of birth for the foreign-born population - Indonesia (%)
Place of birth for the foreign-born population - Laos (%)
Place of birth for the foreign-born population - Malaysia (%)
Place of birth for the foreign-born population - Philippines (%)
Place of birth for the foreign-born population - Singapore (%)
Place of birth for the foreign-born population - Thailand (%)
Place of birth for the foreign-born population - Vietnam (%)
Place of birth for the foreign-born population - Other South Eastern Asia (%)
Place of birth for the foreign-born population - Armenia (%)
Place of birth for the foreign-born population - Iraq (%)
Place of birth for the foreign-born population - Israel (%)
Place of birth for the foreign-born population - Jordan (%)
Place of birth for the foreign-born population - Kuwait (%)
Place of birth for the foreign-born population - Lebanon (%)
Place of birth for the foreign-born population - Saudi Arabia (%)
Place of birth for the foreign-born population - Syria (%)
Place of birth for the foreign-born population - Turkey (%)
Place of birth for the foreign-born population - Yemen (%)
Place of birth for the foreign-born population - Other Western Asia (%)
Place of birth for the foreign-born population - Eritrea (%)
Place of birth for the foreign-born population - Ethiopia (%)
Place of birth for the foreign-born population - Kenya (%)
Place of birth for the foreign-born population - Somalia (%)
Place of birth for the foreign-born population - Uganda (%)
Place of birth for the foreign-born population - Zimbabwe (%)
Place of birth for the foreign-born population - Other Eastern Africa (%)
Place of birth for the foreign-born population - Cameroon (%)
Place of birth for the foreign-born population - Congo (%)
Place of birth for the foreign-born population - Democratic Republic of Congo (Zaire) (%)
Place of birth for the foreign-born population - Other Middle Africa (%)
Place of birth for the foreign-born population - Egypt (%)
Place of birth for the foreign-born population - Morocco (%)
Place of birth for the foreign-born population - Sudan (%)
Place of birth for the foreign-born population - Other Northern Africa (%)
Place of birth for the foreign-born population - South Africa (%)
Place of birth for the foreign-born population - Other Southern Africa (%)
Place of birth for the foreign-born population - Cabo Verde (%)
Place of birth for the foreign-born population - Ghana (%)
Place of birth for the foreign-born population - Liberia (%)
Place of birth for the foreign-born population - Nigeria (%)
Place of birth for the foreign-born population - Senegal (%)
Place of birth for the foreign-born population - Sierra Leone (%)
Place of birth for the foreign-born population - Other Western Africa (%)
Place of birth for the foreign-born population - Australia (%)
Place of birth for the foreign-born population - New Zealand (%)
Place of birth for the foreign-born population - Fiji (%)
Place of birth for the foreign-born population - Micronesia (%)
Place of birth for the foreign-born population - Bahamas (%)
Place of birth for the foreign-born population - Barbados (%)
Place of birth for the foreign-born population - Cuba (%)
Place of birth for the foreign-born population - Dominica (%)
Place of birth for the foreign-born population - Dominican Republic (%)
Place of birth for the foreign-born population - Grenada (%)
Place of birth for the foreign-born population - Haiti (%)
Place of birth for the foreign-born population - Jamaica (%)
Place of birth for the foreign-born population - St. Vincent and the Grenadines (%)
Place of birth for the foreign-born population - Trinidad and Tobago (%)
Place of birth for the foreign-born population - West Indies (%)
Place of birth for the foreign-born population - Other Caribbean (%)
Place of birth for the foreign-born population - Belize (%)
Place of birth for the foreign-born population - Costa Rica (%)
Place of birth for the foreign-born population - El Salvador (%)
Place of birth for the foreign-born population - Guatemala (%)
Place of birth for the foreign-born population - Honduras (%)
Place of birth for the foreign-born population - Mexico (%)
Place of birth for the foreign-born population - Nicaragua (%)
Place of birth for the foreign-born population - Panama (%)
Place of birth for the foreign-born population - Other Central America (%)
Place of birth for the foreign-born population - Argentina (%)
Place of birth for the foreign-born population - Bolivia (%)
Place of birth for the foreign-born population - Brazil (%)
Place of birth for the foreign-born population - Chile (%)
Place of birth for the foreign-born population - Colombia (%)
Place of birth for the foreign-born population - Ecuador (%)
Place of birth for the foreign-born population - Guyana (%)
Place of birth for the foreign-born population - Peru (%)
Place of birth for the foreign-born population - Uruguay (%)
Place of birth for the foreign-born population - Venezuela (%)
Place of birth for the foreign-born population - Other South America (%)
Place of birth for the foreign-born population - Canada (%)
Place of birth for the foreign-born population - Other Northern America (%)
Place of birth for the foreign-born population - Other (%)
Latest news about races in Houma, LA collected exclusively by city-data.com from local newspapers, TV, and radio stations
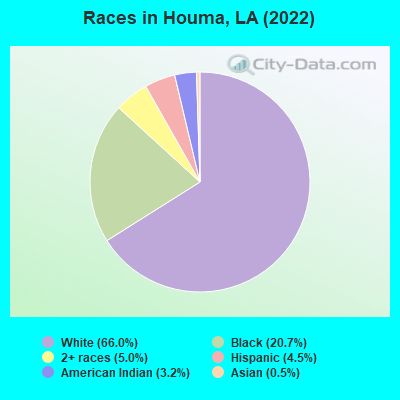
According to 2022 data, the most numerous races in Houma, LA are White alone (21,032 residents), Black alone (6,607 residents), and Hispanic (1,423 residents). 94.8% of Houma residents speak English at home. 2.2% of Houma, LA residents are foreign-born (1.7% born in Latin America), which is 85.5% less than the foreign-born rate of 4.0% across the entire state of Louisiana.
Race distribution in Houma
2000 2022
2,794,391 62.5% White alone 1,443,390 32.3% Black alone 107,738 2.4% Hispanic 54,256 1.2% Asian alone 39,260 0.9% Two or more races 24,129 0.5% American Indian alone 4,736 0.1% Other race alone 1,076 0.02% Native Hawaiian and Other
2,603,221 56.7% White alone 1,420,055 30.9% Black alone 262,213 5.7% Hispanic 183,270 4.0% Two or more races 81,169 1.8% Asian alone 19,991 0.4% American Indian alone 18,043 0.4% Other race alone 2,279 0.05% Native Hawaiian and Other
Income and house value in Houma Median household income in 2022 $70,731 White non-Hispanic householders$35,365 Black householders$18,930 American Indian and Alaska Native householders$56,270 Two or more races householders$45,064 Hispanic or Latino race householdersMedian 2022 house value $230,608 White Non-Hispanic householders$150,269 Black or African American householders$137,724 American Indian or Alaska Native householders $245,021 Asian householders$407,835 Some other race householders$352,585 Two or more races householders$251,960 Hispanic or Latino householders
Median age by race in Houma
39.0 Median age for White residents38.6 40.8 33.1 Median age for Black or African American residents37.3 29.6 39.3 Median age for American Indian / Alaska Native residents36.5 46.0 67.3 Median age for Asian residents58.4 68.4 -666,666,666.0 Median age for Native Hawaiian / Pacific Islander residents-666,666,666.0 -666,666,666.0 36.9 Median age for Other race residents-589,849,107.8 54.4 29.7 Median age for Two or more races residents27.8 44.2 38.8 Median age for White alone residents38.3 41.0 34.5 Median age for Hispanic or Latino residents34.4 58.4
Owner/renter occupied households by race in Houma
House owners and renters - White residents 7,259 82.4% Owner occupied1,549 17.6% Renter occupiedHouse owners and renters - Black or African American residents 1,106 55.2% Owner occupied897 44.8% Renter occupiedHouse owners and renters - American Indian / Alaska Native residents 340 85.3% Owner occupied59 14.7% Renter occupiedHouse owners and renters - Asian residents 71 100.0% Owner occupiedHouse owners and renters - Other race residents 169 100.0% Renter occupiedHouse owners and renters - Two or more races residents 589 80.4% Owner occupied143 19.6% Renter occupiedHouse owners and renters - White alone residents 7,188 81.9% Owner occupied1,590 18.1% Renter occupiedHouse owners and renters - Hispanic or Latino residents 456 43.9% Owner occupied583 56.1% Renter occupied
Language usage in Houma
English speakers - Total 94.8% of residents of Houma speak English at home.
1.9% of residents speak Spanish at home 442 79.1% Speak English very well117 20.9% Speak English less than very well3.4% of residents speak other language at home 930 92.6% Speak English very well74 7.4% Speak English less than very well
English speakers - Born in the United States 96.2% of residents of Houma speak English at home.
1.4% of residents speak Spanish at home 48 100.0% Speak English very well2.4% of residents speak other language at home 82 100.0% Speak English very well
English speakers - Native, born elsewhere 69.3% of residents of Houma speak English at home.
12.2% of residents speak Spanish at home 31 100.0% Speak English very well18.9% of residents speak other language at home 48 100.0% Speak English very well
English speakers - Foreign-born 45.4% of residents of Houma speak English at home.
42.1% of residents speak Spanish at home 157 56.5% Speak English very well121 43.5% Speak English less than very well7.9% of residents speak other language at home 37 71.2% Speak English very well15 28.8% Speak English less than very well
White (Caucasian) - Speak only English Native:
97.0% (19,394)Foreign-born:
87.3% (98)
White (Caucasian) - Speak another language Native:
3.0% (606)Foreign-born:
30.4% (34)
American Indian / Alaska Native - Speak only English Native:
82.7% (1,012)Foreign-born:
24.4% (49)
American Indian / Alaska Native - Speak another language Native:
16.7% (205)Foreign-born:
73.3% (146)
Asian - Speak only English Native:
29.7% (51)Foreign-born:
43.1% (13)
Asian - Speak another language Native:
75.2% (130)Foreign-born:
51.1% (15)
Other race - Speak only English Native:
100.0% (27)Foreign-born:
39.6% (138)
Two or more races - Speak only English Native:
88.3% (1,636)Foreign-born:
52.4% (27)
Two or more races - Speak another language Native:
11.7% (216)Foreign-born:
31.3% (16)
White alone - Speak only English Native:
96.6% (19,245)Foreign-born:
73.9% (94)
White alone - Speak another language Native:
3.4% (671)Foreign-born:
26.4% (34)
Hispanic or Latino - Speak only English Native:
100.0% (742)Foreign-born:
30.9% (215)
Hispanic or Latino - Speak another language Native:
4.8% (36)Foreign-born:
74.3% (518)
Foreign-born residents in Houma 687 residents are foreign born (1.7% Latin America ).
This city:
2.2%Louisiana:
4.2%
Marital status for residents in Houma Marital status - White (Caucasian) population 15 years and over
Males 32.8% Never married53.3% Now married0.9% Separated2.2% Widowed10.9% DivorcedFemales 20.9% Never married48.8% Now married0.3% Separated10.4% Widowed19.7% DivorcedWomen who gave birth in the past 12 months Now married:
61.4% (166)Unmarried:
38.6% (104)
Women who did not give birth in the past 12 months Now married:
45.8% (1,895)Unmarried:
54.2% (2,242)
Marital status - Black or African American population 15 years and over
Males 54.8% Never married25.8% Now married3.4% Separated2.0% Widowed14.0% DivorcedFemales 55.3% Never married25.9% Now married7.7% Separated4.6% Widowed6.5% DivorcedWomen who gave birth in the past 12 months Now married:
11.9% (43)Unmarried:
88.1% (315)
Women who did not give birth in the past 12 months Now married:
30.7% (384)Unmarried:
69.3% (867)
Marital status - American Indian / Alaska Native population 15 years and over
Males 33.6% Never married55.2% Now married0.0% Separated5.5% Widowed5.7% DivorcedFemales 11.0% Never married45.3% Now married0.0% Separated0.0% Widowed43.6% DivorcedWomen who did not give birth in the past 12 months Now married:
25.4% (38)Unmarried:
74.6% (112)
Marital status - Asian population 15 years and over
Males 51.9% Never married48.1% Now married0.0% Separated0.0% Widowed0.0% DivorcedFemales 38.1% Never married50.0% Now married0.0% Separated0.7% Widowed11.2% DivorcedWomen who did not give birth in the past 12 months Now married:
21.5% (15)Unmarried:
78.5% (53)
Marital status - Other race population 15 years and over
Males 100.0% Never married0.0% Now married0.0% Separated0.0% Widowed0.0% DivorcedFemales 84.4% Never married0.0% Now married0.0% Separated15.6% Widowed0.0% DivorcedWomen who did not give birth in the past 12 months Now married:
0.0% (0)Unmarried:
100.0% (150)
Marital status - Two or more races population 15 years and over
Males 30.6% Never married63.9% Now married0.0% Separated0.0% Widowed5.5% DivorcedFemales 16.4% Never married66.1% Now married0.6% Separated0.0% Widowed17.0% DivorcedWomen who gave birth in the past 12 months Now married:
100.0% (4)Unmarried:
0.0% (0)
Women who did not give birth in the past 12 months Now married:
74.8% (311)Unmarried:
25.2% (105)
Marital status - White alone, not Hispanic / Latino population 15 years and over
Males 32.4% Never married53.4% Now married0.9% Separated2.2% Widowed11.1% DivorcedFemales 20.5% Never married48.9% Now married0.3% Separated10.4% Widowed19.8% DivorcedWomen who gave birth in the past 12 months Now married:
61.4% (168)Unmarried:
38.6% (106)
Women who did not give birth in the past 12 months Now married:
46.1% (1,919)Unmarried:
53.9% (2,246)
Marital status - Hispanic or Latino population 15 years and over
Males 56.1% Never married40.0% Now married0.0% Separated0.0% Widowed3.9% DivorcedFemales 43.0% Never married26.9% Now married0.0% Separated5.9% Widowed24.2% DivorcedWomen who gave birth in the past 12 months Now married:
0.0% (0)Unmarried:
100.0% (103)
Women who did not give birth in the past 12 months Now married:
18.0% (38)Unmarried:
82.0% (171)
Ancestries in Houma
4,154 23.4% French2,664 15.0% American886 5.0% English682 3.8% French Canadian604 3.4% Italian261 1.5% Cajun260 1.5% Irish249 1.4% German197 1.1% African88 0.5% European83 0.5% Polish58 0.3% Iranian55 0.3% Swedish36 0.2% Australian33 0.2% Canadian29 0.2% Brazilian29 0.2% Norwegian29 0.2% Scottish26 0.1% Jamaican17 0.10% British16 0.09% Scandinavian13 0.07% Lebanese13 0.07% Belgian10 0.06% Armenian5 0.03% Austrian
Geographical mobility in Houma Same house 1 year ago 17,699 85.3% White (Caucasian)5,862 90.0% Black or African American1,482 93.8% American Indian / Alaska Native187 97.7% Asian338 97.4% Other race1,842 89.0% Two or more races17,647 84.8% White alone, not Hispanic / Latino1,264 90.7% Hispanic or LatinoMoved within same county 2,544 12.3% White / Caucasian561 8.6% Black or African American46 2.9% American Indian / Alaska Native57 2.8% Two or more races2,548 12.2% White alone, not Hispanic / LatinoMoved within same state 536 2.6% White / Caucasian68 1.0% Black or African American56 3.5% American Indian / Alaska Native4 0.2% Two or more races618 3.0% White alone, not Hispanic / LatinoMoved from different state 126 0.6% White / Caucasian6 0.1% Black or African American1 0.1% American Indian / Alaska Native19 99.3% Native Hawaiian / Pacific Islander158 7.6% Two or more races109 0.5% White alone, not Hispanic / Latino99 7.1% Hispanic or LatinoMoved from abroad 38 0.2% White38 0.2% White alone, not Hispanic / Latino
Children Nativity (place of birth) in Houma
Children under 6 years - Living with two parents Both parents native 1,788 100.0% NativeOne native, one foreign-born parent 42 100.0% NativeChildren under 6 years - Living with one parent Native parent 1,613 100.0% Native
Children 6 to 17 years - Living with two parents Both parents native 2,777 100.0% NativeOne native, one foreign-born parent 56 100.0% NativeChildren 6 to 17 years - Living with one parent Native parent 1,758 100.0% Native
Grandparents responsible for own grandchildren in Houma
Grandparents (30 to 59 years) White / Caucasian 21 35.9% Responsible for grandchildren38 64.1% Not responsible for grandchildrenBlack or African American 52 18.3% Responsible for grandchildren230 81.7% Not responsible for grandchildrenTwo or more races 40 100.0% Not responsible for grandchildrenWhite alone, not Hispanic / Latino 22 36.5% Responsible for grandchildren38 63.5% Not responsible for grandchildrenGrandparents (60 years and over) White / Caucasian 43 19.6% Responsible for grandchildren178 80.4% Not responsible for grandchildrenBlack or African American 13 35.9% Responsible for grandchildren23 64.1% Not responsible for grandchildrenTwo or more races 2 100.0% Not responsible for grandchildrenWhite alone, not Hispanic / Latino 43 19.6% Responsible for grandchildren178 80.4% Not responsible for grandchildren