Races in Hattiesburg, Mississippi (MS) Detailed Stats
Data:
Races - White alone (%)
Races - White alone (% change since 2000)
Races - Black alone (%)
Races - Black alone (% change since 2000)
Races - American Indian alone (%)
Races - American Indian alone (% change since 2000)
Races - Asian alone (%)
Races - Asian alone (% change since 2000)
Races - Hispanic (%)
Races - Hispanic (% change since 2000)
Races - Native Hawaiian and Other Pacific Islander alone (%)
Races - Native Hawaiian and Other Pacific Islander alone (% change since 2000)
Races - Two or more races(%)
Races - Two or more races(% change since 2000)
Races - Other race alone (%)
Races - Other race alone (% change since 2000)
Racial diversity
Place of birth - Born in state of residence (%)
Place of birth - Born in state of residence (%) - White
Place of birth - Born in state of residence (%) - Black or African American
Place of birth - Born in state of residence (%) - Asian
Place of birth - Born in state of residence (%) - Hispanic or Latino
Place of birth - Born in state of residence (%) - American Indian and Alaska Native
Place of birth - Born in state of residence (%) - Multirace
Place of birth - Born in state of residence (%) - Other Race
Place of birth - Born in other state (%)
Place of birth - Born in other state (%) - White
Place of birth - Born in other state (%) - Black or African American
Place of birth - Born in other state (%) - Asian
Place of birth - Born in other state (%) - Hispanic or Latino
Place of birth - Born in other state (%) - American Indian and Alaska Native
Place of birth - Born in other state (%) - Multirace
Place of birth - Born in other state (%) - Other Race
Place of birth - Native, outside of US (%)
Place of birth - Native, outside of US (%) - White
Place of birth - Native, outside of US (%) - Black or African American
Place of birth - Native, outside of US (%) - Asian
Place of birth - Native, outside of US (%) - Hispanic or Latino
Place of birth - Native, outside of US (%) - American Indian and Alaska Native
Place of birth - Native, outside of US (%) - Multirace
Place of birth - Native, outside of US (%) - Other Race
Place of birth - Foreign born (%)
Place of birth - Foreign born (%) - White
Place of birth - Foreign born (%) - Black or African American
Place of birth - Foreign born (%) - Asian
Place of birth - Foreign born (%) - Hispanic or Latino
Place of birth - Foreign born (%) - American Indian and Alaska Native
Place of birth - Foreign born (%) - Multirace
Place of birth - Foreign born (%) - Other Race
Residents speaking English at home (%)
Residents speaking English at home - Born in the United States (%)
Residents speaking English at home - Native, born elsewhere (%)
Residents speaking English at home - Foreign born (%)
Residents speaking Spanish at home (%)
Residents speaking Spanish at home - Born in the United States (%)
Residents speaking Spanish at home - Native, born elsewhere (%)
Residents speaking Spanish at home - Foreign born (%)
Residents speaking other language at home (%)
Residents speaking other language at home - Born in the United States (%)
Residents speaking other language at home - Native, born elsewhere (%)
Residents speaking other language at home - Foreign born (%)
Marital status - Never married (%)
Marital status - Now married (%)
Marital status - Separated (%)
Marital status - Widowed (%)
Marital status - Divorced (%)
Ancestries Reported - Arab (%)
Ancestries Reported - Czech (%)
Ancestries Reported - Danish (%)
Ancestries Reported - Dutch (%)
Ancestries Reported - English (%)
Ancestries Reported - French (%)
Ancestries Reported - French Canadian (%)
Ancestries Reported - German (%)
Ancestries Reported - Greek (%)
Ancestries Reported - Hungarian (%)
Ancestries Reported - Irish (%)
Ancestries Reported - Italian (%)
Ancestries Reported - Lithuanian (%)
Ancestries Reported - Norwegian (%)
Ancestries Reported - Polish (%)
Ancestries Reported - Portuguese (%)
Ancestries Reported - Russian (%)
Ancestries Reported - Scotch-Irish (%)
Ancestries Reported - Scottish (%)
Ancestries Reported - Slovak (%)
Ancestries Reported - Subsaharan African (%)
Ancestries Reported - Swedish (%)
Ancestries Reported - Swiss (%)
Ancestries Reported - Ukrainian (%)
Ancestries Reported - United States (%)
Ancestries Reported - Welsh (%)
Ancestries Reported - West Indian (%)
Ancestries Reported - Other (%)
Geographical mobility - Same house 1 year ago (%)
Geographical mobility - Same house 1 year ago (%) - White
Geographical mobility - Same house 1 year ago (%) - Black or African American
Geographical mobility - Same house 1 year ago (%) - Asian
Geographical mobility - Same house 1 year ago (%) - Hispanic or Latino
Geographical mobility - Same house 1 year ago (%) - American Indian and Alaska Native
Geographical mobility - Same house 1 year ago (%) - Multirace
Geographical mobility - Same house 1 year ago (%) - Other Race
Geographical mobility - Moved within same county (%)
Geographical mobility - Moved within same county (%) - White
Geographical mobility - Moved within same county (%) - Black or African American
Geographical mobility - Moved within same county (%) - Asian
Geographical mobility - Moved within same county (%) - Hispanic or Latino
Geographical mobility - Moved within same county (%) - American Indian and Alaska Native
Geographical mobility - Moved within same county (%) - Multirace
Geographical mobility - Moved within same county (%) - Other Race
Geographical mobility - Moved from different county within same state (%)
Geographical mobility - Moved from different county within same state (%) - White
Geographical mobility - Moved from different county within same state (%) - Black or African American
Geographical mobility - Moved from different county within same state (%) - Asian
Geographical mobility - Moved from different county within same state (%) - Hispanic or Latino
Geographical mobility - Moved from different county within same state (%) - American Indian and Alaska Native
Geographical mobility - Moved from different county within same state (%) - Multirace
Geographical mobility - Moved from different county within same state (%) - Other Race
Geographical mobility - Moved from different state (%)
Geographical mobility - Moved from different state (%) - White
Geographical mobility - Moved from different state (%) - Black or African American
Geographical mobility - Moved from different state (%) - Asian
Geographical mobility - Moved from different state (%) - Hispanic or Latino
Geographical mobility - Moved from different state (%) - American Indian and Alaska Native
Geographical mobility - Moved from different state (%) - Multirace
Geographical mobility - Moved from different state (%) - Other Race
Geographical mobility - Moved from abroad (%)
Geographical mobility - Moved from abroad (%) - White
Geographical mobility - Moved from abroad (%) - Black or African American
Geographical mobility - Moved from abroad (%) - Asian
Geographical mobility - Moved from abroad (%) - Hispanic or Latino
Geographical mobility - Moved from abroad (%) - American Indian and Alaska Native
Geographical mobility - Moved from abroad (%) - Multirace
Geographical mobility - Moved from abroad (%) - Other Race
Place of birth for the foreign-born population - Ireland (%)
Place of birth for the foreign-born population - Denmark (%)
Place of birth for the foreign-born population - Norway (%)
Place of birth for the foreign-born population - Sweden (%)
Place of birth for the foreign-born population - United Kingdom (%)
Place of birth for the foreign-born population - England (%)
Place of birth for the foreign-born population - Scotland (%)
Place of birth for the foreign-born population - Other Northern Europe (%)
Place of birth for the foreign-born population - Austria (%)
Place of birth for the foreign-born population - Belgium (%)
Place of birth for the foreign-born population - France (%)
Place of birth for the foreign-born population - Germany (%)
Place of birth for the foreign-born population - Netherlands (%)
Place of birth for the foreign-born population - Switzerland (%)
Place of birth for the foreign-born population - Other Western Europe (%)
Place of birth for the foreign-born population - Greece (%)
Place of birth for the foreign-born population - Italy (%)
Place of birth for the foreign-born population - Portugal (%)
Place of birth for the foreign-born population - Spain (%)
Place of birth for the foreign-born population - Other Southern Europe (%)
Place of birth for the foreign-born population - Albania (%)
Place of birth for the foreign-born population - Belarus (%)
Place of birth for the foreign-born population - Bosnia and Herzegovina (%)
Place of birth for the foreign-born population - Bulgaria (%)
Place of birth for the foreign-born population - Croatia (%)
Place of birth for the foreign-born population - Czechoslovakia (%)
Place of birth for the foreign-born population - Hungary (%)
Place of birth for the foreign-born population - Latvia (%)
Place of birth for the foreign-born population - Lithuania (%)
Place of birth for the foreign-born population - North Macedonia (Macedonia) (%)
Place of birth for the foreign-born population - Moldova (%)
Place of birth for the foreign-born population - Poland (%)
Place of birth for the foreign-born population - Romania (%)
Place of birth for the foreign-born population - Russia (%)
Place of birth for the foreign-born population - Serbia (%)
Place of birth for the foreign-born population - Ukraine (%)
Place of birth for the foreign-born population - Other Eastern Europe (%)
Place of birth for the foreign-born population - China (%)
Place of birth for the foreign-born population - Hong Kong (%)
Place of birth for the foreign-born population - Taiwan (%)
Place of birth for the foreign-born population - Japan (%)
Place of birth for the foreign-born population - Korea (%)
Place of birth for the foreign-born population - Other Eastern Asia (%)
Place of birth for the foreign-born population - Afghanistan (%)
Place of birth for the foreign-born population - Bangladesh (%)
Place of birth for the foreign-born population - India (%)
Place of birth for the foreign-born population - Iran (%)
Place of birth for the foreign-born population - Kazakhstan (%)
Place of birth for the foreign-born population - Nepal (%)
Place of birth for the foreign-born population - Pakistan (%)
Place of birth for the foreign-born population - Sri Lanka (%)
Place of birth for the foreign-born population - Uzbekistan (%)
Place of birth for the foreign-born population - Other South Central Asia (%)
Place of birth for the foreign-born population - Burma (%)
Place of birth for the foreign-born population - Cambodia (%)
Place of birth for the foreign-born population - Indonesia (%)
Place of birth for the foreign-born population - Laos (%)
Place of birth for the foreign-born population - Malaysia (%)
Place of birth for the foreign-born population - Philippines (%)
Place of birth for the foreign-born population - Singapore (%)
Place of birth for the foreign-born population - Thailand (%)
Place of birth for the foreign-born population - Vietnam (%)
Place of birth for the foreign-born population - Other South Eastern Asia (%)
Place of birth for the foreign-born population - Armenia (%)
Place of birth for the foreign-born population - Iraq (%)
Place of birth for the foreign-born population - Israel (%)
Place of birth for the foreign-born population - Jordan (%)
Place of birth for the foreign-born population - Kuwait (%)
Place of birth for the foreign-born population - Lebanon (%)
Place of birth for the foreign-born population - Saudi Arabia (%)
Place of birth for the foreign-born population - Syria (%)
Place of birth for the foreign-born population - Turkey (%)
Place of birth for the foreign-born population - Yemen (%)
Place of birth for the foreign-born population - Other Western Asia (%)
Place of birth for the foreign-born population - Eritrea (%)
Place of birth for the foreign-born population - Ethiopia (%)
Place of birth for the foreign-born population - Kenya (%)
Place of birth for the foreign-born population - Somalia (%)
Place of birth for the foreign-born population - Uganda (%)
Place of birth for the foreign-born population - Zimbabwe (%)
Place of birth for the foreign-born population - Other Eastern Africa (%)
Place of birth for the foreign-born population - Cameroon (%)
Place of birth for the foreign-born population - Congo (%)
Place of birth for the foreign-born population - Democratic Republic of Congo (Zaire) (%)
Place of birth for the foreign-born population - Other Middle Africa (%)
Place of birth for the foreign-born population - Egypt (%)
Place of birth for the foreign-born population - Morocco (%)
Place of birth for the foreign-born population - Sudan (%)
Place of birth for the foreign-born population - Other Northern Africa (%)
Place of birth for the foreign-born population - South Africa (%)
Place of birth for the foreign-born population - Other Southern Africa (%)
Place of birth for the foreign-born population - Cabo Verde (%)
Place of birth for the foreign-born population - Ghana (%)
Place of birth for the foreign-born population - Liberia (%)
Place of birth for the foreign-born population - Nigeria (%)
Place of birth for the foreign-born population - Senegal (%)
Place of birth for the foreign-born population - Sierra Leone (%)
Place of birth for the foreign-born population - Other Western Africa (%)
Place of birth for the foreign-born population - Australia (%)
Place of birth for the foreign-born population - New Zealand (%)
Place of birth for the foreign-born population - Fiji (%)
Place of birth for the foreign-born population - Micronesia (%)
Place of birth for the foreign-born population - Bahamas (%)
Place of birth for the foreign-born population - Barbados (%)
Place of birth for the foreign-born population - Cuba (%)
Place of birth for the foreign-born population - Dominica (%)
Place of birth for the foreign-born population - Dominican Republic (%)
Place of birth for the foreign-born population - Grenada (%)
Place of birth for the foreign-born population - Haiti (%)
Place of birth for the foreign-born population - Jamaica (%)
Place of birth for the foreign-born population - St. Vincent and the Grenadines (%)
Place of birth for the foreign-born population - Trinidad and Tobago (%)
Place of birth for the foreign-born population - West Indies (%)
Place of birth for the foreign-born population - Other Caribbean (%)
Place of birth for the foreign-born population - Belize (%)
Place of birth for the foreign-born population - Costa Rica (%)
Place of birth for the foreign-born population - El Salvador (%)
Place of birth for the foreign-born population - Guatemala (%)
Place of birth for the foreign-born population - Honduras (%)
Place of birth for the foreign-born population - Mexico (%)
Place of birth for the foreign-born population - Nicaragua (%)
Place of birth for the foreign-born population - Panama (%)
Place of birth for the foreign-born population - Other Central America (%)
Place of birth for the foreign-born population - Argentina (%)
Place of birth for the foreign-born population - Bolivia (%)
Place of birth for the foreign-born population - Brazil (%)
Place of birth for the foreign-born population - Chile (%)
Place of birth for the foreign-born population - Colombia (%)
Place of birth for the foreign-born population - Ecuador (%)
Place of birth for the foreign-born population - Guyana (%)
Place of birth for the foreign-born population - Peru (%)
Place of birth for the foreign-born population - Uruguay (%)
Place of birth for the foreign-born population - Venezuela (%)
Place of birth for the foreign-born population - Other South America (%)
Place of birth for the foreign-born population - Canada (%)
Place of birth for the foreign-born population - Other Northern America (%)
Place of birth for the foreign-born population - Other (%)
Latest news about races in Hattiesburg, MS collected exclusively by city-data.com from local newspapers, TV, and radio stations
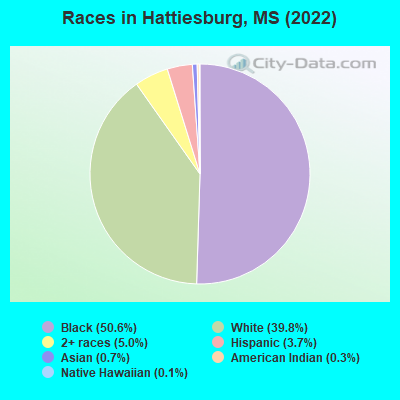
According to 2022 data, the most numerous races in Hattiesburg, MS are White alone (19,157 residents), Black alone (24,360 residents), and Hispanic (1,798 residents). 96.1% of Hattiesburg residents speak English at home. 2.9% of Hattiesburg, MS residents are foreign-born (1.3% born in Latin America, 0.4% born in Asia, 0.4% born in Europe, 0.4% born in Oceania), which is 30.7% greater than the foreign-born rate of 2.0% across the entire state of Mississippi.
Race distribution in Hattiesburg
2000 2022
1,727,908 60.7% White alone 1,028,473 36.2% Black alone 39,569 1.4% Hispanic 17,272 0.6% Two or more races 18,349 0.6% Asian alone 11,224 0.4% American Indian alone 1,294 0.05% Other race alone 569 0.02% Native Hawaiian and Other
1,625,979 55.3% White alone 1,072,962 36.5% Black alone 97,177 3.3% Hispanic 96,367 3.3% Two or more races 25,217 0.9% Asian alone 12,457 0.4% American Indian alone 9,501 0.3% Other race alone 397 0.01% Native Hawaiian and Other
Income and house value in Hattiesburg Median household income in 2022 $62,066 White non-Hispanic householders$29,264 Black householders$39,075 Some other race householders$48,584 Two or more races householders$47,591 Hispanic or Latino race householdersMedian 2022 house value $246,604 White Non-Hispanic householders$112,491 Black or African American householders$328,708 American Indian or Alaska Native householders$248,357 Two or more races householders$257,999 Hispanic or Latino householders
Median age by race in Hattiesburg
31.3 Median age for White residents32.4 29.3 28.8 Median age for Black or African American residents27.7 30.6 73.3 Median age for American Indian / Alaska Native residents79.9 41.6 19.2 Median age for Asian residents32.8 19.4 20.7 Median age for Native Hawaiian / Pacific Islander residents-666,666,666.0 20.8 27.5 Median age for Other race residents25.3 34.8 21.1 Median age for Two or more races residents21.4 18.4 31.5 Median age for White alone residents32.5 29.5 20.7 Median age for Hispanic or Latino residents22.9 21.1
Owner/renter occupied households by race in Hattiesburg
House owners and renters - White residents 4,458 49.0% Owner occupied4,642 51.0% Renter occupiedHouse owners and renters - Black or African American residents 2,690 27.1% Owner occupied7,217 72.9% Renter occupiedHouse owners and renters - American Indian / Alaska Native residents 38 28.5% Owner occupied95 71.5% Renter occupiedHouse owners and renters - Asian residents 240 100.0% Renter occupiedHouse owners and renters - Native Hawaiian / Pacific Islander residents 149 100.0% Renter occupiedHouse owners and renters - Other race residents 22 38.3% Owner occupied36 61.7% Renter occupiedHouse owners and renters - Two or more races residents 244 27.8% Owner occupied633 72.2% Renter occupiedHouse owners and renters - White alone residents 4,437 49.4% Owner occupied4,542 50.6% Renter occupiedHouse owners and renters - Hispanic or Latino residents 173 28.7% Owner occupied432 71.3% Renter occupied
Language usage in Hattiesburg
English speakers - Total 96.1% of residents of Hattiesburg speak English at home.
2.0% of residents speak Spanish at home 579 65.1% Speak English very well310 34.9% Speak English less than very well2.0% of residents speak other language at home 627 70.3% Speak English very well265 29.7% Speak English less than very well
English speakers - Born in the United States 97.3% of residents of Hattiesburg speak English at home.
1.2% of residents speak Spanish at home 161 100.0% Speak English very well1.6% of residents speak other language at home 137 63.4% Speak English very well79 36.6% Speak English less than very well
English speakers - Native, born elsewhere 84.3% of residents of Hattiesburg speak English at home.
14.3% of residents speak Spanish at home 73 100.0% Speak English very well5.7% of residents speak other language at home 29 100.0% Speak English very well
English speakers - Foreign-born 31.2% of residents of Hattiesburg speak English at home.
30.4% of residents speak Spanish at home 171 42.5% Speak English very well231 57.5% Speak English less than very well37.9% of residents speak other language at home 343 68.5% Speak English very well158 31.5% Speak English less than very well
White (Caucasian) - Speak only English Native:
98.4% (18,278)Foreign-born:
54.9% (172)
White (Caucasian) - Speak another language Native:
1.5% (277)Foreign-born:
49.7% (155)
Black or African American - Speak only English Native:
99.4% (22,190)Foreign-born:
79.8% (119)
Black or African American - Speak another language Native:
0.6% (141)Foreign-born:
14.9% (22)
Asian - Speak another language Native:
42.5% (71)Foreign-born:
95.5% (221)
Native Hawaiian / Pacific Islander - Speak only English Native:
99.5% (46)Foreign-born:
78.2% (133)
Other race - Speak another language Native:
57.7% (13)Foreign-born:
100.0% (196)
Two or more races - Speak another language Native:
8.8% (289)Foreign-born:
100.0% (319)
White alone - Speak only English Native:
98.6% (18,031)Foreign-born:
51.2% (180)
White alone - Speak another language Native:
1.4% (262)Foreign-born:
47.9% (168)
Hispanic or Latino - Speak another language Native:
22.9% (280)Foreign-born:
100.0% (423)
Foreign-born residents in Hattiesburg 1,403 residents are foreign born (1.3% Latin America , 0.4% Asia , 0.4% Europe , 0.4% Oceania ).
This city:
2.9%Mississippi:
2.3%
Marital status for residents in Hattiesburg Marital status - White (Caucasian) population 15 years and over
Males 48.8% Never married42.2% Now married0.3% Separated0.9% Widowed7.8% DivorcedFemales 48.1% Never married35.7% Now married0.6% Separated6.9% Widowed8.7% DivorcedWomen who gave birth in the past 12 months Now married:
84.9% (128)Unmarried:
15.1% (23)
Women who did not give birth in the past 12 months Now married:
26.6% (1,702)Unmarried:
73.4% (4,708)
Marital status - Black or African American population 15 years and over
Males 60.6% Never married19.5% Now married3.2% Separated5.5% Widowed11.2% DivorcedFemales 58.0% Never married16.9% Now married5.6% Separated8.4% Widowed11.0% DivorcedWomen who gave birth in the past 12 months Now married:
29.6% (238)Unmarried:
70.4% (566)
Women who did not give birth in the past 12 months Now married:
15.8% (1,066)Unmarried:
84.2% (5,674)
Marital status - American Indian / Alaska Native population 15 years and over
Males 45.3% Never married45.3% Now married9.3% Separated0.0% Widowed0.0% DivorcedFemales 12.2% Never married63.3% Now married0.0% Separated0.0% Widowed24.5% DivorcedWomen who did not give birth in the past 12 months Now married:
83.8% (63)Unmarried:
16.2% (12)
Marital status - Asian population 15 years and over
Males 51.8% Never married17.3% Now married0.0% Separated0.0% Widowed31.0% DivorcedFemales 95.3% Never married0.0% Now married0.0% Separated0.0% Widowed4.7% DivorcedWomen who did not give birth in the past 12 months Now married:
0.0% (0)Unmarried:
100.0% (199)
Marital status - Other race population 15 years and over
Males 12.9% Never married74.1% Now married0.0% Separated0.0% Widowed12.9% DivorcedFemales 84.1% Never married15.9% Now married0.0% Separated0.0% Widowed0.0% DivorcedWomen who did not give birth in the past 12 months Now married:
3.3% (3)Unmarried:
96.7% (83)
Marital status - Two or more races population 15 years and over
Males 74.1% Never married17.8% Now married2.7% Separated0.0% Widowed5.4% DivorcedFemales 59.4% Never married22.1% Now married0.0% Separated1.8% Widowed16.8% DivorcedWomen who gave birth in the past 12 months Now married:
76.2% (54)Unmarried:
23.8% (17)
Women who did not give birth in the past 12 months Now married:
6.7% (36)Unmarried:
93.3% (496)
Marital status - White alone, not Hispanic / Latino population 15 years and over
Males 48.2% Never married42.6% Now married0.3% Separated0.9% Widowed8.0% DivorcedFemales 47.7% Never married36.4% Now married0.3% Separated7.0% Widowed8.6% DivorcedWomen who gave birth in the past 12 months Now married:
84.9% (129)Unmarried:
15.1% (23)
Women who did not give birth in the past 12 months Now married:
26.7% (1,656)Unmarried:
73.3% (4,545)
Marital status - Hispanic or Latino population 15 years and over
Males 46.1% Never married35.7% Now married4.6% Separated0.0% Widowed13.5% DivorcedFemales 62.3% Never married26.3% Now married5.7% Separated0.0% Widowed5.7% DivorcedWomen who gave birth in the past 12 months Now married:
66.7% (15)Unmarried:
33.3% (8)
Women who did not give birth in the past 12 months Now married:
27.7% (146)Unmarried:
72.3% (383)
Ancestries in Hattiesburg
3,157 9.2% American2,261 6.6% English1,699 4.9% Irish798 2.3% German592 1.7% Italian456 1.3% Scottish345 1.0% French240 0.7% Scotch-Irish226 0.7% European149 0.4% Dutch83 0.2% Jamaican69 0.2% Greek64 0.2% African60 0.2% Norwegian51 0.1% British48 0.1% Eastern European38 0.1% Slovak37 0.1% Australian28 0.08% Egyptian26 0.08% Nigerian25 0.07% Brazilian24 0.07% Portuguese20 0.06% Russian19 0.06% Finnish18 0.05% Ghanaian13 0.04% Northern European9 0.03% Polish9 0.03% Swedish8 0.02% Cajun5 0.01% Syrian5 0.01% Bahamian4 0.01% Ukrainian2 0.01% Scandinavian
Geographical mobility in Hattiesburg Same house 1 year ago 13,608 69.6% White (Caucasian)19,761 85.3% Black or African American119 59.4% American Indian / Alaska Native306 75.1% Asian23 10.2% Native Hawaiian / Pacific Islander171 75.0% Other race3,112 75.5% Two or more races13,398 69.7% White alone, not Hispanic / Latino1,304 75.9% Hispanic or LatinoMoved within same county 1,422 7.3% White / Caucasian2,521 10.9% Black or African American12 3.0% Asian43 19.6% Native Hawaiian / Pacific Islander127 3.1% Two or more races1,264 6.6% White alone, not Hispanic / Latino71 4.2% Hispanic or LatinoMoved within same state 2,390 12.2% White / Caucasian1,275 5.5% Black or African American16 3.9% Asian4 1.6% Other race142 3.5% Two or more races2,390 12.4% White alone, not Hispanic / Latino14 0.8% Hispanic or LatinoMoved from different state 2,492 12.7% White / Caucasian607 2.6% Black or African American77 38.2% American Indian / Alaska Native141 64.0% Native Hawaiian / Pacific Islander21 9.1% Other race272 6.6% Two or more races2,407 12.5% White alone, not Hispanic / Latino302 17.6% Hispanic or LatinoMoved from abroad 87 0.4% White57 0.2% Black or African American109 26.8% Asian8 3.4% Native Hawaiian / Pacific Islander37 16.2% Other race4 0.1% Two or more races91 0.5% White alone, not Hispanic / Latino33 1.9% Hispanic or Latino
Children Nativity (place of birth) in Hattiesburg
Children under 6 years - Living with two parents Both parents native 1,009 100.0% NativeBoth parents foreign-born 57 100.0% NativeOne native, one foreign-born parent 262 100.0% NativeChildren under 6 years - Living with one parent Native parent 1,983 100.0% NativeForeign-born parent 59 100.0% NativeChildren 6 to 17 years - Living with two parents Both parents native 1,903 100.0% NativeChildren 6 to 17 years - Living with one parent Native parent 3,002 100.0% NativeForeign-born parent 66 46.3% Native76 53.7% Foreign-born
Grandparents responsible for own grandchildren in Hattiesburg
Grandparents (30 to 59 years) White / Caucasian 20 42.1% Responsible for grandchildren27 57.9% Not responsible for grandchildrenBlack or African American 77 22.0% Responsible for grandchildren272 78.0% Not responsible for grandchildrenWhite alone, not Hispanic / Latino 20 42.3% Responsible for grandchildren27 57.7% Not responsible for grandchildrenGrandparents (60 years and over) White / Caucasian 34 100.0% Not responsible for grandchildrenBlack or African American 201 49.9% Responsible for grandchildren201 50.1% Not responsible for grandchildrenWhite alone, not Hispanic / Latino 35 100.0% Not responsible for grandchildren