Races in Greenfield Town, Massachusetts (MA) Detailed Stats
Data:
Races - White alone (%)
Races - White alone (% change since 2000)
Races - Black alone (%)
Races - Black alone (% change since 2000)
Races - American Indian alone (%)
Races - American Indian alone (% change since 2000)
Races - Asian alone (%)
Races - Asian alone (% change since 2000)
Races - Hispanic (%)
Races - Hispanic (% change since 2000)
Races - Native Hawaiian and Other Pacific Islander alone (%)
Races - Native Hawaiian and Other Pacific Islander alone (% change since 2000)
Races - Two or more races(%)
Races - Two or more races(% change since 2000)
Races - Other race alone (%)
Races - Other race alone (% change since 2000)
Racial diversity
Place of birth - Born in state of residence (%)
Place of birth - Born in state of residence (%) - White
Place of birth - Born in state of residence (%) - Black or African American
Place of birth - Born in state of residence (%) - Asian
Place of birth - Born in state of residence (%) - Hispanic or Latino
Place of birth - Born in state of residence (%) - American Indian and Alaska Native
Place of birth - Born in state of residence (%) - Multirace
Place of birth - Born in state of residence (%) - Other Race
Place of birth - Born in other state (%)
Place of birth - Born in other state (%) - White
Place of birth - Born in other state (%) - Black or African American
Place of birth - Born in other state (%) - Asian
Place of birth - Born in other state (%) - Hispanic or Latino
Place of birth - Born in other state (%) - American Indian and Alaska Native
Place of birth - Born in other state (%) - Multirace
Place of birth - Born in other state (%) - Other Race
Place of birth - Native, outside of US (%)
Place of birth - Native, outside of US (%) - White
Place of birth - Native, outside of US (%) - Black or African American
Place of birth - Native, outside of US (%) - Asian
Place of birth - Native, outside of US (%) - Hispanic or Latino
Place of birth - Native, outside of US (%) - American Indian and Alaska Native
Place of birth - Native, outside of US (%) - Multirace
Place of birth - Native, outside of US (%) - Other Race
Place of birth - Foreign born (%)
Place of birth - Foreign born (%) - White
Place of birth - Foreign born (%) - Black or African American
Place of birth - Foreign born (%) - Asian
Place of birth - Foreign born (%) - Hispanic or Latino
Place of birth - Foreign born (%) - American Indian and Alaska Native
Place of birth - Foreign born (%) - Multirace
Place of birth - Foreign born (%) - Other Race
Residents speaking English at home (%)
Residents speaking English at home - Born in the United States (%)
Residents speaking English at home - Native, born elsewhere (%)
Residents speaking English at home - Foreign born (%)
Residents speaking Spanish at home (%)
Residents speaking Spanish at home - Born in the United States (%)
Residents speaking Spanish at home - Native, born elsewhere (%)
Residents speaking Spanish at home - Foreign born (%)
Residents speaking other language at home (%)
Residents speaking other language at home - Born in the United States (%)
Residents speaking other language at home - Native, born elsewhere (%)
Residents speaking other language at home - Foreign born (%)
Marital status - Never married (%)
Marital status - Now married (%)
Marital status - Separated (%)
Marital status - Widowed (%)
Marital status - Divorced (%)
Ancestries Reported - Arab (%)
Ancestries Reported - Czech (%)
Ancestries Reported - Danish (%)
Ancestries Reported - Dutch (%)
Ancestries Reported - English (%)
Ancestries Reported - French (%)
Ancestries Reported - French Canadian (%)
Ancestries Reported - German (%)
Ancestries Reported - Greek (%)
Ancestries Reported - Hungarian (%)
Ancestries Reported - Irish (%)
Ancestries Reported - Italian (%)
Ancestries Reported - Lithuanian (%)
Ancestries Reported - Norwegian (%)
Ancestries Reported - Polish (%)
Ancestries Reported - Portuguese (%)
Ancestries Reported - Russian (%)
Ancestries Reported - Scotch-Irish (%)
Ancestries Reported - Scottish (%)
Ancestries Reported - Slovak (%)
Ancestries Reported - Subsaharan African (%)
Ancestries Reported - Swedish (%)
Ancestries Reported - Swiss (%)
Ancestries Reported - Ukrainian (%)
Ancestries Reported - United States (%)
Ancestries Reported - Welsh (%)
Ancestries Reported - West Indian (%)
Ancestries Reported - Other (%)
Geographical mobility - Same house 1 year ago (%)
Geographical mobility - Same house 1 year ago (%) - White
Geographical mobility - Same house 1 year ago (%) - Black or African American
Geographical mobility - Same house 1 year ago (%) - Asian
Geographical mobility - Same house 1 year ago (%) - Hispanic or Latino
Geographical mobility - Same house 1 year ago (%) - American Indian and Alaska Native
Geographical mobility - Same house 1 year ago (%) - Multirace
Geographical mobility - Same house 1 year ago (%) - Other Race
Geographical mobility - Moved within same county (%)
Geographical mobility - Moved within same county (%) - White
Geographical mobility - Moved within same county (%) - Black or African American
Geographical mobility - Moved within same county (%) - Asian
Geographical mobility - Moved within same county (%) - Hispanic or Latino
Geographical mobility - Moved within same county (%) - American Indian and Alaska Native
Geographical mobility - Moved within same county (%) - Multirace
Geographical mobility - Moved within same county (%) - Other Race
Geographical mobility - Moved from different county within same state (%)
Geographical mobility - Moved from different county within same state (%) - White
Geographical mobility - Moved from different county within same state (%) - Black or African American
Geographical mobility - Moved from different county within same state (%) - Asian
Geographical mobility - Moved from different county within same state (%) - Hispanic or Latino
Geographical mobility - Moved from different county within same state (%) - American Indian and Alaska Native
Geographical mobility - Moved from different county within same state (%) - Multirace
Geographical mobility - Moved from different county within same state (%) - Other Race
Geographical mobility - Moved from different state (%)
Geographical mobility - Moved from different state (%) - White
Geographical mobility - Moved from different state (%) - Black or African American
Geographical mobility - Moved from different state (%) - Asian
Geographical mobility - Moved from different state (%) - Hispanic or Latino
Geographical mobility - Moved from different state (%) - American Indian and Alaska Native
Geographical mobility - Moved from different state (%) - Multirace
Geographical mobility - Moved from different state (%) - Other Race
Geographical mobility - Moved from abroad (%)
Geographical mobility - Moved from abroad (%) - White
Geographical mobility - Moved from abroad (%) - Black or African American
Geographical mobility - Moved from abroad (%) - Asian
Geographical mobility - Moved from abroad (%) - Hispanic or Latino
Geographical mobility - Moved from abroad (%) - American Indian and Alaska Native
Geographical mobility - Moved from abroad (%) - Multirace
Geographical mobility - Moved from abroad (%) - Other Race
Place of birth for the foreign-born population - Ireland (%)
Place of birth for the foreign-born population - Denmark (%)
Place of birth for the foreign-born population - Norway (%)
Place of birth for the foreign-born population - Sweden (%)
Place of birth for the foreign-born population - United Kingdom (%)
Place of birth for the foreign-born population - England (%)
Place of birth for the foreign-born population - Scotland (%)
Place of birth for the foreign-born population - Other Northern Europe (%)
Place of birth for the foreign-born population - Austria (%)
Place of birth for the foreign-born population - Belgium (%)
Place of birth for the foreign-born population - France (%)
Place of birth for the foreign-born population - Germany (%)
Place of birth for the foreign-born population - Netherlands (%)
Place of birth for the foreign-born population - Switzerland (%)
Place of birth for the foreign-born population - Other Western Europe (%)
Place of birth for the foreign-born population - Greece (%)
Place of birth for the foreign-born population - Italy (%)
Place of birth for the foreign-born population - Portugal (%)
Place of birth for the foreign-born population - Spain (%)
Place of birth for the foreign-born population - Other Southern Europe (%)
Place of birth for the foreign-born population - Albania (%)
Place of birth for the foreign-born population - Belarus (%)
Place of birth for the foreign-born population - Bosnia and Herzegovina (%)
Place of birth for the foreign-born population - Bulgaria (%)
Place of birth for the foreign-born population - Croatia (%)
Place of birth for the foreign-born population - Czechoslovakia (%)
Place of birth for the foreign-born population - Hungary (%)
Place of birth for the foreign-born population - Latvia (%)
Place of birth for the foreign-born population - Lithuania (%)
Place of birth for the foreign-born population - North Macedonia (Macedonia) (%)
Place of birth for the foreign-born population - Moldova (%)
Place of birth for the foreign-born population - Poland (%)
Place of birth for the foreign-born population - Romania (%)
Place of birth for the foreign-born population - Russia (%)
Place of birth for the foreign-born population - Serbia (%)
Place of birth for the foreign-born population - Ukraine (%)
Place of birth for the foreign-born population - Other Eastern Europe (%)
Place of birth for the foreign-born population - China (%)
Place of birth for the foreign-born population - Hong Kong (%)
Place of birth for the foreign-born population - Taiwan (%)
Place of birth for the foreign-born population - Japan (%)
Place of birth for the foreign-born population - Korea (%)
Place of birth for the foreign-born population - Other Eastern Asia (%)
Place of birth for the foreign-born population - Afghanistan (%)
Place of birth for the foreign-born population - Bangladesh (%)
Place of birth for the foreign-born population - India (%)
Place of birth for the foreign-born population - Iran (%)
Place of birth for the foreign-born population - Kazakhstan (%)
Place of birth for the foreign-born population - Nepal (%)
Place of birth for the foreign-born population - Pakistan (%)
Place of birth for the foreign-born population - Sri Lanka (%)
Place of birth for the foreign-born population - Uzbekistan (%)
Place of birth for the foreign-born population - Other South Central Asia (%)
Place of birth for the foreign-born population - Burma (%)
Place of birth for the foreign-born population - Cambodia (%)
Place of birth for the foreign-born population - Indonesia (%)
Place of birth for the foreign-born population - Laos (%)
Place of birth for the foreign-born population - Malaysia (%)
Place of birth for the foreign-born population - Philippines (%)
Place of birth for the foreign-born population - Singapore (%)
Place of birth for the foreign-born population - Thailand (%)
Place of birth for the foreign-born population - Vietnam (%)
Place of birth for the foreign-born population - Other South Eastern Asia (%)
Place of birth for the foreign-born population - Armenia (%)
Place of birth for the foreign-born population - Iraq (%)
Place of birth for the foreign-born population - Israel (%)
Place of birth for the foreign-born population - Jordan (%)
Place of birth for the foreign-born population - Kuwait (%)
Place of birth for the foreign-born population - Lebanon (%)
Place of birth for the foreign-born population - Saudi Arabia (%)
Place of birth for the foreign-born population - Syria (%)
Place of birth for the foreign-born population - Turkey (%)
Place of birth for the foreign-born population - Yemen (%)
Place of birth for the foreign-born population - Other Western Asia (%)
Place of birth for the foreign-born population - Eritrea (%)
Place of birth for the foreign-born population - Ethiopia (%)
Place of birth for the foreign-born population - Kenya (%)
Place of birth for the foreign-born population - Somalia (%)
Place of birth for the foreign-born population - Uganda (%)
Place of birth for the foreign-born population - Zimbabwe (%)
Place of birth for the foreign-born population - Other Eastern Africa (%)
Place of birth for the foreign-born population - Cameroon (%)
Place of birth for the foreign-born population - Congo (%)
Place of birth for the foreign-born population - Democratic Republic of Congo (Zaire) (%)
Place of birth for the foreign-born population - Other Middle Africa (%)
Place of birth for the foreign-born population - Egypt (%)
Place of birth for the foreign-born population - Morocco (%)
Place of birth for the foreign-born population - Sudan (%)
Place of birth for the foreign-born population - Other Northern Africa (%)
Place of birth for the foreign-born population - South Africa (%)
Place of birth for the foreign-born population - Other Southern Africa (%)
Place of birth for the foreign-born population - Cabo Verde (%)
Place of birth for the foreign-born population - Ghana (%)
Place of birth for the foreign-born population - Liberia (%)
Place of birth for the foreign-born population - Nigeria (%)
Place of birth for the foreign-born population - Senegal (%)
Place of birth for the foreign-born population - Sierra Leone (%)
Place of birth for the foreign-born population - Other Western Africa (%)
Place of birth for the foreign-born population - Australia (%)
Place of birth for the foreign-born population - New Zealand (%)
Place of birth for the foreign-born population - Fiji (%)
Place of birth for the foreign-born population - Micronesia (%)
Place of birth for the foreign-born population - Bahamas (%)
Place of birth for the foreign-born population - Barbados (%)
Place of birth for the foreign-born population - Cuba (%)
Place of birth for the foreign-born population - Dominica (%)
Place of birth for the foreign-born population - Dominican Republic (%)
Place of birth for the foreign-born population - Grenada (%)
Place of birth for the foreign-born population - Haiti (%)
Place of birth for the foreign-born population - Jamaica (%)
Place of birth for the foreign-born population - St. Vincent and the Grenadines (%)
Place of birth for the foreign-born population - Trinidad and Tobago (%)
Place of birth for the foreign-born population - West Indies (%)
Place of birth for the foreign-born population - Other Caribbean (%)
Place of birth for the foreign-born population - Belize (%)
Place of birth for the foreign-born population - Costa Rica (%)
Place of birth for the foreign-born population - El Salvador (%)
Place of birth for the foreign-born population - Guatemala (%)
Place of birth for the foreign-born population - Honduras (%)
Place of birth for the foreign-born population - Mexico (%)
Place of birth for the foreign-born population - Nicaragua (%)
Place of birth for the foreign-born population - Panama (%)
Place of birth for the foreign-born population - Other Central America (%)
Place of birth for the foreign-born population - Argentina (%)
Place of birth for the foreign-born population - Bolivia (%)
Place of birth for the foreign-born population - Brazil (%)
Place of birth for the foreign-born population - Chile (%)
Place of birth for the foreign-born population - Colombia (%)
Place of birth for the foreign-born population - Ecuador (%)
Place of birth for the foreign-born population - Guyana (%)
Place of birth for the foreign-born population - Peru (%)
Place of birth for the foreign-born population - Uruguay (%)
Place of birth for the foreign-born population - Venezuela (%)
Place of birth for the foreign-born population - Other South America (%)
Place of birth for the foreign-born population - Canada (%)
Place of birth for the foreign-born population - Other Northern America (%)
Place of birth for the foreign-born population - Other (%)
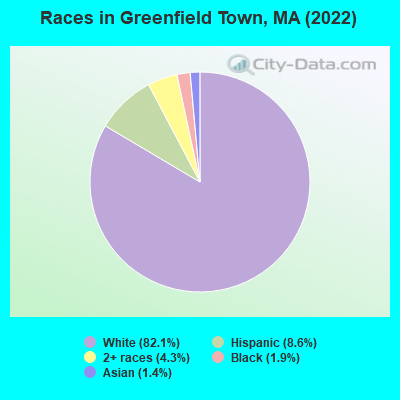
According to 2022 data, the most numerous races in Greenfield Town, MA are White alone (14,631 residents), Hispanic (1,525 residents), and Asian alone (247 residents). 90.0% of Greenfield Town residents speak English at home.
Race distribution in Greenfield Town 14,631 82.1% White alone 1,525 8.6% Hispanic 759 4.3% Two or more races 334 1.9% Black alone 247 1.4% Asian alone 17 0.10% Other race alone 6 0.03% American Indian alone
2000 2022
5,198,359 81.9% White alone 428,729 6.8% Hispanic 318,329 5.0% Black alone 236,786 3.7% Asian alone 110,338 1.7% Two or more races 43,586 0.7% Other race alone 11,264 0.2% American Indian alone 1,706 0.03% Native Hawaiian and Other
4,676,627 67.0% White alone 911,038 13.0% Hispanic 501,463 7.2% Asian alone 459,740 6.6% Black alone 341,889 4.9% Two or more races 84,403 1.2% Other race alone 5,838 0.08% American Indian alone 976 0.01% Native Hawaiian and Other
Income and house value in Greenfield Town Median household income in 2022 $62,192 White non-Hispanic householders$27,899 Black householders$109,918 Asian householders$44,878 Some other race householders$63,577 Two or more races householders$46,227 Hispanic or Latino race householders
Median age by race in Greenfield Town
48.1 Median age for White residents45.4 50.0 49.9 Median age for Black or African American residents44.5 49.9 16.6 Median age for American Indian / Alaska Native residents43.0 Median age for Asian residents41.9 43.5 20.8 Median age for Other race residents19.4 41.9 41.6 Median age for Two or more races residents43.1 37.2 48.1 Median age for White alone residents45.8 50.0 28.3 Median age for Hispanic or Latino residents21.3 47.0
Owner/renter occupied households by race in Greenfield Town
House owners and renters - White residents 4,294 57.0% Owner occupied3,234 43.0% Renter occupiedHouse owners and renters - Black or African American residents 6 6.6% Owner occupied82 93.4% Renter occupiedHouse owners and renters - American Indian / Alaska Native residents 8 100.0% Renter occupiedHouse owners and renters - Asian residents 98 87.8% Owner occupied13 12.2% Renter occupiedHouse owners and renters - Other race residents 8 3.0% Owner occupied263 97.0% Renter occupiedHouse owners and renters - Two or more races residents 249 27.9% Owner occupied643 72.1% Renter occupiedHouse owners and renters - White alone residents 4,271 56.4% Owner occupied3,306 43.6% Renter occupiedHouse owners and renters - Hispanic or Latino residents 125 28.2% Owner occupied319 71.8% Renter occupied
Language usage in Greenfield Town
English speakers - Total 90.0% of residents of Greenfield Town speak English at home.
4.9% of residents speak Spanish at home 434 52.1% Speak English very well399 47.9% Speak English less than very well4.5% of residents speak other language at home 501 66.5% Speak English very well252 33.5% Speak English less than very well
English speakers - Born in the United States 98.7% of residents of Greenfield Town speak English at home.
1.3% of residents speak Spanish at home 32 57.1% Speak English very well24 42.9% Speak English less than very well
English speakers - Native, born elsewhere 14.1% of residents of Greenfield Town speak English at home.
84.2% of residents speak Spanish at home 211 47.0% Speak English very well238 53.0% Speak English less than very well1.3% of residents speak other language at home 7 100.0% Speak English very well
English speakers - Foreign-born 33.0% of residents of Greenfield Town speak English at home.
11.0% of residents speak Spanish at home 46 46.9% Speak English very well52 53.1% Speak English less than very well55.3% of residents speak other language at home 258 52.2% Speak English very well236 47.8% Speak English less than very well
White (Caucasian) - Speak only English Native:
99.3% (13,708)Foreign-born:
42.5% (173)
White (Caucasian) - Speak another language Native:
1.9% (258)Foreign-born:
57.2% (233)
Black or African American - Speak only English Native:
92.7% (307)Foreign-born:
98.7% (24)
Black or African American - Speak another language Native:
8.3% (28)Foreign-born:
11.9% (3)
Asian - Speak only English Native:
60.9% (24)Foreign-born:
20.5% (44)
Asian - Speak another language Native:
40.5% (16)Foreign-born:
79.0% (171)
Other race - Speak another language Native:
76.7% (465)Foreign-born:
100.0% (85)
Two or more races - Speak only English Native:
60.3% (515)Foreign-born:
67.6% (121)
Two or more races - Speak another language Native:
45.8% (392)Foreign-born:
7.7% (14)
White alone - Speak only English Native:
99.1% (13,514)Foreign-born:
47.0% (178)
White alone - Speak another language Native:
1.2% (159)Foreign-born:
48.4% (183)
Hispanic or Latino - Speak only English Native:
43.5% (577)Foreign-born:
8.1% (12)
Hispanic or Latino - Speak another language Native:
56.7% (754)Foreign-born:
92.1% (137)
Foreign-born residents in Greenfield Town
Marital status for residents in Greenfield Town Marital status - White (Caucasian) population 15 years and over
Males 38.0% Never married42.6% Now married1.3% Separated5.5% Widowed12.7% DivorcedFemales 28.3% Never married39.7% Now married1.9% Separated12.5% Widowed17.6% DivorcedWomen who gave birth in the past 12 months Now married:
79.9% (123)Unmarried:
20.1% (31)
Women who did not give birth in the past 12 months Now married:
33.4% (971)Unmarried:
66.6% (1,935)
Marital status - Black or African American population 15 years and over
Males 60.3% Never married34.0% Now married5.7% Separated0.0% Widowed0.0% DivorcedFemales 70.9% Never married12.8% Now married0.0% Separated12.0% Widowed4.3% DivorcedWomen who did not give birth in the past 12 months Now married:
15.5% (15)Unmarried:
84.5% (81)
Marital status - American Indian / Alaska Native population 15 years and over
Males 100.0% Never married0.0% Now married0.0% Separated0.0% Widowed0.0% DivorcedFemales 0.0% Never married0.0% Now married0.0% Separated0.0% Widowed100.0% DivorcedMarital status - Asian population 15 years and over
Males 0.0% Never married92.6% Now married0.0% Separated7.4% Widowed0.0% DivorcedFemales 6.0% Never married77.0% Now married0.0% Separated17.0% Widowed0.0% DivorcedWomen who did not give birth in the past 12 months Now married:
92.8% (84)Unmarried:
7.2% (7)
Marital status - Other race population 15 years and over
Males 81.7% Never married7.5% Now married0.0% Separated0.0% Widowed10.8% DivorcedFemales 67.2% Never married20.1% Now married0.0% Separated4.9% Widowed7.8% DivorcedWomen who gave birth in the past 12 months Now married:
0.0% (0)Unmarried:
100.0% (1)
Women who did not give birth in the past 12 months Now married:
21.2% (51)Unmarried:
78.8% (189)
Marital status - Two or more races population 15 years and over
Males 29.9% Never married23.1% Now married0.0% Separated37.3% Widowed9.7% DivorcedFemales 72.6% Never married27.4% Now married0.0% Separated0.0% Widowed0.0% DivorcedWomen who did not give birth in the past 12 months Now married:
26.5% (55)Unmarried:
73.5% (153)
Marital status - White alone, not Hispanic / Latino population 15 years and over
Males 37.1% Never married43.4% Now married1.3% Separated5.7% Widowed12.4% DivorcedFemales 27.7% Never married40.6% Now married1.9% Separated12.8% Widowed17.0% DivorcedWomen who gave birth in the past 12 months Now married:
79.9% (129)Unmarried:
20.1% (32)
Women who did not give birth in the past 12 months Now married:
35.2% (1,010)Unmarried:
64.8% (1,859)
Marital status - Hispanic or Latino population 15 years and over
Males 66.6% Never married16.4% Now married1.3% Separated1.2% Widowed14.4% DivorcedFemales 55.4% Never married16.2% Now married0.0% Separated4.1% Widowed24.3% DivorcedWomen who gave birth in the past 12 months Now married:
0.0% (0)Unmarried:
100.0% (1)
Women who did not give birth in the past 12 months Now married:
12.5% (53)Unmarried:
87.5% (367)
Ancestries in Greenfield Town
658 10.1% Polish658 10.1% Irish580 8.9% English450 6.9% American332 5.1% French Canadian328 5.0% Italian291 4.5% European267 4.1% French221 3.4% German146 2.2% Romanian89 1.4% Scottish72 1.1% Portuguese54 0.8% Northern European48 0.7% Ukrainian39 0.6% British38 0.6% Norwegian36 0.6% Danish29 0.4% Swedish28 0.4% Greek28 0.4% Russian27 0.4% Dutch24 0.4% Scotch-Irish21 0.3% Lebanese20 0.3% Iraqi15 0.2% Egyptian15 0.2% Jamaican11 0.2% Celtic11 0.2% Eastern European10 0.2% Slovak8 0.1% Armenian8 0.1% Austrian8 0.1% Swiss7 0.1% Brazilian6 0.09% Australian6 0.09% Czech5 0.08% Canadian5 0.08% Cape Verdean
Children Nativity (place of birth) in Greenfield Town
Children under 6 years - Living with two parents Both parents native 562 100.0% NativeBoth parents foreign-born 18 100.0% NativeOne native, one foreign-born parent 28 100.0% NativeChildren under 6 years - Living with one parent Native parent 238 100.0% NativeChildren 6 to 17 years - Living with two parents Both parents native 938 100.0% NativeBoth parents foreign-born 28 66.8% Native14 33.2% Foreign-bornOne native, one foreign-born parent 121 89.7% Native14 10.3% Foreign-bornChildren 6 to 17 years - Living with one parent Native parent 836 100.0% NativeForeign-born parent 30 51.0% Native29 49.0% Foreign-born
Grandparents responsible for own grandchildren in Greenfield Town
Grandparents (30 to 59 years) White / Caucasian 28 47.2% Responsible for grandchildren31 52.8% Not responsible for grandchildrenWhite alone, not Hispanic / Latino 28 44.9% Responsible for grandchildren34 55.1% Not responsible for grandchildrenGrandparents (60 years and over) White / Caucasian 21 24.1% Responsible for grandchildren66 75.9% Not responsible for grandchildrenWhite alone, not Hispanic / Latino 22 23.9% Responsible for grandchildren70 76.1% Not responsible for grandchildren