Races in Ellington, Connecticut (CT) Detailed Stats
Ancestries, Foreign-born residents, place of birth

Recent posts about races in Ellington, Connecticut on our local forum with over 2,400,000 registered users:
 | Crumbling Foundations issue in CT houses (17 replies) |
| 2024 Connecticut Town Tournament VI (Celebrating the 10-Year Anniversary & Dazzleman's Memorial) (1069 replies) |
| Daylight Savings Time in CT? (149 replies) |
| Connecticut TOWN TOURNAMENT V (2022) (831 replies) |
| Crumbling Foundations (98 replies) |
| Connecticut TOWN TOURNAMENT IV (2020) (849 replies) |
Latest news about races in Ellington, CT collected exclusively by city-data.com from local newspapers, TV, and radio stations
3.6% of Ellington, CT residents are foreign-born (1.4% born in Europe, 1.1% born in Asia, 0.6% born in North America), which is 315.0% less than the foreign-born rate of 15.0% across the entire state of Connecticut.
Race distribution in Ellington

- 12,33395.4%White alone
- 1811.4%Hispanic
- 1611.2%Asian alone
- 1200.9%Black alone
- 950.7%Two or more races
- 200.2%American Indian alone
- 100.08%Other race alone
- 10.01%Native Hawaiian and Other
Pacific Islander alone

2000
2022
-
- 2,638,84577.5%White alone
- 320,3239.4%Hispanic
- 295,5718.7%Black alone
- 81,5642.4%Asian alone
- 52,8961.6%Two or more races
- 8,1410.2%Other race alone
- 7,2670.2%American Indian alone
- 9580.03%Native Hawaiian and Other
Pacific Islander alone

-
- 2,246,91362.0%White alone
- 658,97818.2%Hispanic
- 353,9739.8%Black alone
- 172,9294.8%Asian alone
- 159,6314.4%Two or more races
- 29,7610.8%Other race alone
- 3,4280.09%American Indian alone
- 5920.02%Native Hawaiian and Other
Pacific Islander alone

Income and house value in Ellington
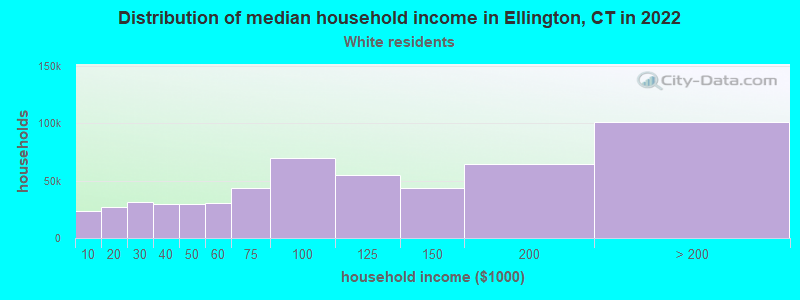
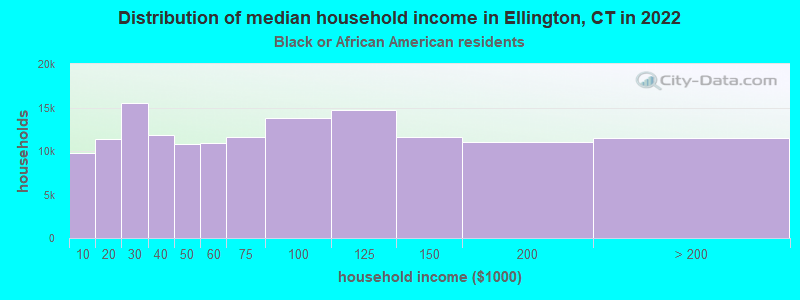
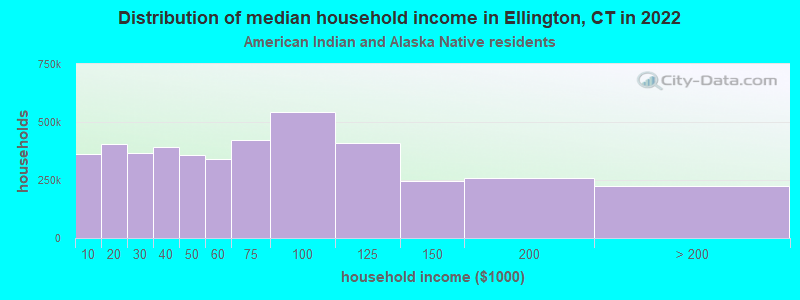
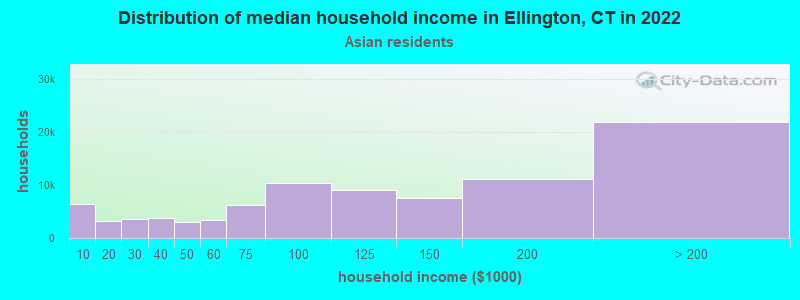
- Median household income in 2022
- $105,759White non-Hispanic householders
- $61,035Black householders
- $143,685American Indian and Alaska Native householders
- $177,097Asian householders
- $4,854Some other race householders
- $98,294Two or more races householders
- $92,418Hispanic or Latino race householders
- Median 2022 house value
- $340,714White Non-Hispanic householders
- $659,377Black or African American householders
- $243,212Asian householders
- $351,307Two or more races householders
- $351,307Hispanic or Latino householders
Household income for White non-Hispanic householders
Household income for Black householders
Household income for American Indian and Alaska Native householders
Household income for Asian householders
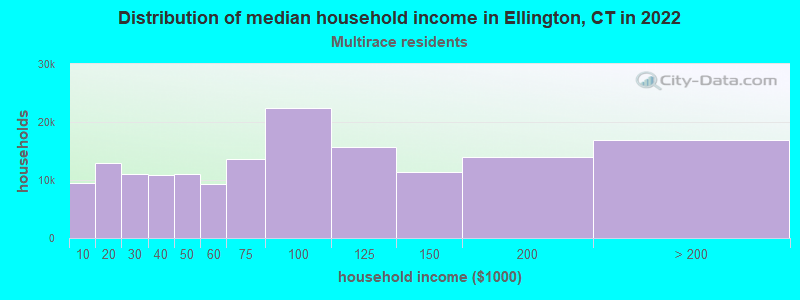
Household income for Two or more races householders
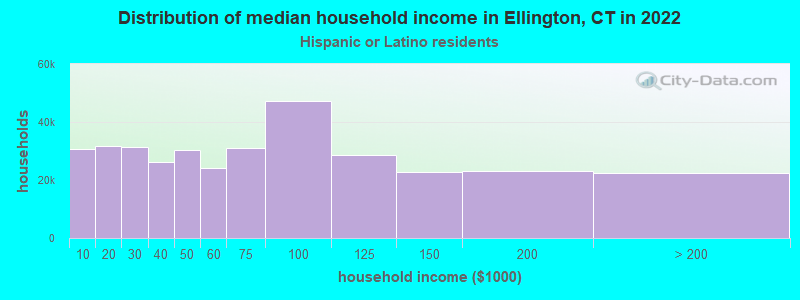
Household income for Hispanic or Latino race householders
Foreign-born residents in Ellington
467 residents are foreign born (1.4% Europe, 1.1% Asia, 0.6% North America).
| This city: | 3.6% |
| Connecticut: | 10.9% |
Ancestries in Ellington

- 2,71916.1%Irish
- 2,05212.2%German
- 1,98011.7%Italian
- 1,81210.7%French
- 1,6119.6%English
- 1,5249.0%Polish
- 1,1897.0%Other
- 5853.5%French Canadian
- 5333.2%United States
- 5173.1%Swiss
- 4062.4%Swedish
- 2891.7%Lithuanian
- 2801.7%Scottish
- 2071.2%Russian
- 1641.0%Scotch-Irish
- 1590.9%Greek
- 1360.8%Hungarian
- 1210.7%Danish
- 980.6%Welsh
- 820.5%Portuguese
- 810.5%Arab
- 810.5%Slovak
- 680.4%Czech
- 500.3%Norwegian
- 480.3%Dutch
- 420.2%Ukrainian
- 240.1%Subsaharan African
- 80.05%West Indian

Zip codes: 06029.