Races in Dumas, Texas (TX) Detailed Stats
Data:
Races - White alone (%)
Races - White alone (% change since 2000)
Races - Black alone (%)
Races - Black alone (% change since 2000)
Races - American Indian alone (%)
Races - American Indian alone (% change since 2000)
Races - Asian alone (%)
Races - Asian alone (% change since 2000)
Races - Hispanic (%)
Races - Hispanic (% change since 2000)
Races - Native Hawaiian and Other Pacific Islander alone (%)
Races - Native Hawaiian and Other Pacific Islander alone (% change since 2000)
Races - Two or more races(%)
Races - Two or more races(% change since 2000)
Races - Other race alone (%)
Races - Other race alone (% change since 2000)
Racial diversity
Place of birth - Born in state of residence (%)
Place of birth - Born in state of residence (%) - White
Place of birth - Born in state of residence (%) - Black or African American
Place of birth - Born in state of residence (%) - Asian
Place of birth - Born in state of residence (%) - Hispanic or Latino
Place of birth - Born in state of residence (%) - American Indian and Alaska Native
Place of birth - Born in state of residence (%) - Multirace
Place of birth - Born in state of residence (%) - Other Race
Place of birth - Born in other state (%)
Place of birth - Born in other state (%) - White
Place of birth - Born in other state (%) - Black or African American
Place of birth - Born in other state (%) - Asian
Place of birth - Born in other state (%) - Hispanic or Latino
Place of birth - Born in other state (%) - American Indian and Alaska Native
Place of birth - Born in other state (%) - Multirace
Place of birth - Born in other state (%) - Other Race
Place of birth - Native, outside of US (%)
Place of birth - Native, outside of US (%) - White
Place of birth - Native, outside of US (%) - Black or African American
Place of birth - Native, outside of US (%) - Asian
Place of birth - Native, outside of US (%) - Hispanic or Latino
Place of birth - Native, outside of US (%) - American Indian and Alaska Native
Place of birth - Native, outside of US (%) - Multirace
Place of birth - Native, outside of US (%) - Other Race
Place of birth - Foreign born (%)
Place of birth - Foreign born (%) - White
Place of birth - Foreign born (%) - Black or African American
Place of birth - Foreign born (%) - Asian
Place of birth - Foreign born (%) - Hispanic or Latino
Place of birth - Foreign born (%) - American Indian and Alaska Native
Place of birth - Foreign born (%) - Multirace
Place of birth - Foreign born (%) - Other Race
Residents speaking English at home (%)
Residents speaking English at home - Born in the United States (%)
Residents speaking English at home - Native, born elsewhere (%)
Residents speaking English at home - Foreign born (%)
Residents speaking Spanish at home (%)
Residents speaking Spanish at home - Born in the United States (%)
Residents speaking Spanish at home - Native, born elsewhere (%)
Residents speaking Spanish at home - Foreign born (%)
Residents speaking other language at home (%)
Residents speaking other language at home - Born in the United States (%)
Residents speaking other language at home - Native, born elsewhere (%)
Residents speaking other language at home - Foreign born (%)
Marital status - Never married (%)
Marital status - Now married (%)
Marital status - Separated (%)
Marital status - Widowed (%)
Marital status - Divorced (%)
Ancestries Reported - Arab (%)
Ancestries Reported - Czech (%)
Ancestries Reported - Danish (%)
Ancestries Reported - Dutch (%)
Ancestries Reported - English (%)
Ancestries Reported - French (%)
Ancestries Reported - French Canadian (%)
Ancestries Reported - German (%)
Ancestries Reported - Greek (%)
Ancestries Reported - Hungarian (%)
Ancestries Reported - Irish (%)
Ancestries Reported - Italian (%)
Ancestries Reported - Lithuanian (%)
Ancestries Reported - Norwegian (%)
Ancestries Reported - Polish (%)
Ancestries Reported - Portuguese (%)
Ancestries Reported - Russian (%)
Ancestries Reported - Scotch-Irish (%)
Ancestries Reported - Scottish (%)
Ancestries Reported - Slovak (%)
Ancestries Reported - Subsaharan African (%)
Ancestries Reported - Swedish (%)
Ancestries Reported - Swiss (%)
Ancestries Reported - Ukrainian (%)
Ancestries Reported - United States (%)
Ancestries Reported - Welsh (%)
Ancestries Reported - West Indian (%)
Ancestries Reported - Other (%)
Geographical mobility - Same house 1 year ago (%)
Geographical mobility - Same house 1 year ago (%) - White
Geographical mobility - Same house 1 year ago (%) - Black or African American
Geographical mobility - Same house 1 year ago (%) - Asian
Geographical mobility - Same house 1 year ago (%) - Hispanic or Latino
Geographical mobility - Same house 1 year ago (%) - American Indian and Alaska Native
Geographical mobility - Same house 1 year ago (%) - Multirace
Geographical mobility - Same house 1 year ago (%) - Other Race
Geographical mobility - Moved within same county (%)
Geographical mobility - Moved within same county (%) - White
Geographical mobility - Moved within same county (%) - Black or African American
Geographical mobility - Moved within same county (%) - Asian
Geographical mobility - Moved within same county (%) - Hispanic or Latino
Geographical mobility - Moved within same county (%) - American Indian and Alaska Native
Geographical mobility - Moved within same county (%) - Multirace
Geographical mobility - Moved within same county (%) - Other Race
Geographical mobility - Moved from different county within same state (%)
Geographical mobility - Moved from different county within same state (%) - White
Geographical mobility - Moved from different county within same state (%) - Black or African American
Geographical mobility - Moved from different county within same state (%) - Asian
Geographical mobility - Moved from different county within same state (%) - Hispanic or Latino
Geographical mobility - Moved from different county within same state (%) - American Indian and Alaska Native
Geographical mobility - Moved from different county within same state (%) - Multirace
Geographical mobility - Moved from different county within same state (%) - Other Race
Geographical mobility - Moved from different state (%)
Geographical mobility - Moved from different state (%) - White
Geographical mobility - Moved from different state (%) - Black or African American
Geographical mobility - Moved from different state (%) - Asian
Geographical mobility - Moved from different state (%) - Hispanic or Latino
Geographical mobility - Moved from different state (%) - American Indian and Alaska Native
Geographical mobility - Moved from different state (%) - Multirace
Geographical mobility - Moved from different state (%) - Other Race
Geographical mobility - Moved from abroad (%)
Geographical mobility - Moved from abroad (%) - White
Geographical mobility - Moved from abroad (%) - Black or African American
Geographical mobility - Moved from abroad (%) - Asian
Geographical mobility - Moved from abroad (%) - Hispanic or Latino
Geographical mobility - Moved from abroad (%) - American Indian and Alaska Native
Geographical mobility - Moved from abroad (%) - Multirace
Geographical mobility - Moved from abroad (%) - Other Race
Place of birth for the foreign-born population - Ireland (%)
Place of birth for the foreign-born population - Denmark (%)
Place of birth for the foreign-born population - Norway (%)
Place of birth for the foreign-born population - Sweden (%)
Place of birth for the foreign-born population - United Kingdom (%)
Place of birth for the foreign-born population - England (%)
Place of birth for the foreign-born population - Scotland (%)
Place of birth for the foreign-born population - Other Northern Europe (%)
Place of birth for the foreign-born population - Austria (%)
Place of birth for the foreign-born population - Belgium (%)
Place of birth for the foreign-born population - France (%)
Place of birth for the foreign-born population - Germany (%)
Place of birth for the foreign-born population - Netherlands (%)
Place of birth for the foreign-born population - Switzerland (%)
Place of birth for the foreign-born population - Other Western Europe (%)
Place of birth for the foreign-born population - Greece (%)
Place of birth for the foreign-born population - Italy (%)
Place of birth for the foreign-born population - Portugal (%)
Place of birth for the foreign-born population - Spain (%)
Place of birth for the foreign-born population - Other Southern Europe (%)
Place of birth for the foreign-born population - Albania (%)
Place of birth for the foreign-born population - Belarus (%)
Place of birth for the foreign-born population - Bosnia and Herzegovina (%)
Place of birth for the foreign-born population - Bulgaria (%)
Place of birth for the foreign-born population - Croatia (%)
Place of birth for the foreign-born population - Czechoslovakia (%)
Place of birth for the foreign-born population - Hungary (%)
Place of birth for the foreign-born population - Latvia (%)
Place of birth for the foreign-born population - Lithuania (%)
Place of birth for the foreign-born population - North Macedonia (Macedonia) (%)
Place of birth for the foreign-born population - Moldova (%)
Place of birth for the foreign-born population - Poland (%)
Place of birth for the foreign-born population - Romania (%)
Place of birth for the foreign-born population - Russia (%)
Place of birth for the foreign-born population - Serbia (%)
Place of birth for the foreign-born population - Ukraine (%)
Place of birth for the foreign-born population - Other Eastern Europe (%)
Place of birth for the foreign-born population - China (%)
Place of birth for the foreign-born population - Hong Kong (%)
Place of birth for the foreign-born population - Taiwan (%)
Place of birth for the foreign-born population - Japan (%)
Place of birth for the foreign-born population - Korea (%)
Place of birth for the foreign-born population - Other Eastern Asia (%)
Place of birth for the foreign-born population - Afghanistan (%)
Place of birth for the foreign-born population - Bangladesh (%)
Place of birth for the foreign-born population - India (%)
Place of birth for the foreign-born population - Iran (%)
Place of birth for the foreign-born population - Kazakhstan (%)
Place of birth for the foreign-born population - Nepal (%)
Place of birth for the foreign-born population - Pakistan (%)
Place of birth for the foreign-born population - Sri Lanka (%)
Place of birth for the foreign-born population - Uzbekistan (%)
Place of birth for the foreign-born population - Other South Central Asia (%)
Place of birth for the foreign-born population - Burma (%)
Place of birth for the foreign-born population - Cambodia (%)
Place of birth for the foreign-born population - Indonesia (%)
Place of birth for the foreign-born population - Laos (%)
Place of birth for the foreign-born population - Malaysia (%)
Place of birth for the foreign-born population - Philippines (%)
Place of birth for the foreign-born population - Singapore (%)
Place of birth for the foreign-born population - Thailand (%)
Place of birth for the foreign-born population - Vietnam (%)
Place of birth for the foreign-born population - Other South Eastern Asia (%)
Place of birth for the foreign-born population - Armenia (%)
Place of birth for the foreign-born population - Iraq (%)
Place of birth for the foreign-born population - Israel (%)
Place of birth for the foreign-born population - Jordan (%)
Place of birth for the foreign-born population - Kuwait (%)
Place of birth for the foreign-born population - Lebanon (%)
Place of birth for the foreign-born population - Saudi Arabia (%)
Place of birth for the foreign-born population - Syria (%)
Place of birth for the foreign-born population - Turkey (%)
Place of birth for the foreign-born population - Yemen (%)
Place of birth for the foreign-born population - Other Western Asia (%)
Place of birth for the foreign-born population - Eritrea (%)
Place of birth for the foreign-born population - Ethiopia (%)
Place of birth for the foreign-born population - Kenya (%)
Place of birth for the foreign-born population - Somalia (%)
Place of birth for the foreign-born population - Uganda (%)
Place of birth for the foreign-born population - Zimbabwe (%)
Place of birth for the foreign-born population - Other Eastern Africa (%)
Place of birth for the foreign-born population - Cameroon (%)
Place of birth for the foreign-born population - Congo (%)
Place of birth for the foreign-born population - Democratic Republic of Congo (Zaire) (%)
Place of birth for the foreign-born population - Other Middle Africa (%)
Place of birth for the foreign-born population - Egypt (%)
Place of birth for the foreign-born population - Morocco (%)
Place of birth for the foreign-born population - Sudan (%)
Place of birth for the foreign-born population - Other Northern Africa (%)
Place of birth for the foreign-born population - South Africa (%)
Place of birth for the foreign-born population - Other Southern Africa (%)
Place of birth for the foreign-born population - Cabo Verde (%)
Place of birth for the foreign-born population - Ghana (%)
Place of birth for the foreign-born population - Liberia (%)
Place of birth for the foreign-born population - Nigeria (%)
Place of birth for the foreign-born population - Senegal (%)
Place of birth for the foreign-born population - Sierra Leone (%)
Place of birth for the foreign-born population - Other Western Africa (%)
Place of birth for the foreign-born population - Australia (%)
Place of birth for the foreign-born population - New Zealand (%)
Place of birth for the foreign-born population - Fiji (%)
Place of birth for the foreign-born population - Micronesia (%)
Place of birth for the foreign-born population - Bahamas (%)
Place of birth for the foreign-born population - Barbados (%)
Place of birth for the foreign-born population - Cuba (%)
Place of birth for the foreign-born population - Dominica (%)
Place of birth for the foreign-born population - Dominican Republic (%)
Place of birth for the foreign-born population - Grenada (%)
Place of birth for the foreign-born population - Haiti (%)
Place of birth for the foreign-born population - Jamaica (%)
Place of birth for the foreign-born population - St. Vincent and the Grenadines (%)
Place of birth for the foreign-born population - Trinidad and Tobago (%)
Place of birth for the foreign-born population - West Indies (%)
Place of birth for the foreign-born population - Other Caribbean (%)
Place of birth for the foreign-born population - Belize (%)
Place of birth for the foreign-born population - Costa Rica (%)
Place of birth for the foreign-born population - El Salvador (%)
Place of birth for the foreign-born population - Guatemala (%)
Place of birth for the foreign-born population - Honduras (%)
Place of birth for the foreign-born population - Mexico (%)
Place of birth for the foreign-born population - Nicaragua (%)
Place of birth for the foreign-born population - Panama (%)
Place of birth for the foreign-born population - Other Central America (%)
Place of birth for the foreign-born population - Argentina (%)
Place of birth for the foreign-born population - Bolivia (%)
Place of birth for the foreign-born population - Brazil (%)
Place of birth for the foreign-born population - Chile (%)
Place of birth for the foreign-born population - Colombia (%)
Place of birth for the foreign-born population - Ecuador (%)
Place of birth for the foreign-born population - Guyana (%)
Place of birth for the foreign-born population - Peru (%)
Place of birth for the foreign-born population - Uruguay (%)
Place of birth for the foreign-born population - Venezuela (%)
Place of birth for the foreign-born population - Other South America (%)
Place of birth for the foreign-born population - Canada (%)
Place of birth for the foreign-born population - Other Northern America (%)
Place of birth for the foreign-born population - Other (%)
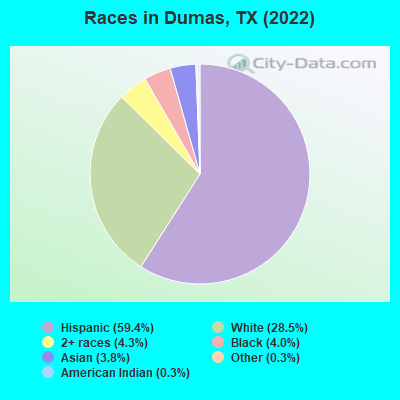
According to 2022 data, the most numerous races in Dumas, TX are Hispanic (8,781 residents), White alone (4,222 residents), and Black alone (599 residents). 52.6% of Dumas residents speak English at home. 21.7% of Dumas, TX residents are foreign-born (16.9% born in Latin America, 2.5% born in Asia), which is 21.6% greater than the foreign-born rate of 17.0% across the entire state of Texas.
Race distribution in Dumas
2000 2022
10,933,313 52.4% White alone 6,669,666 32.0% Hispanic 2,364,255 11.3% Black alone 554,445 2.7% Asian alone 230,567 1.1% Two or more races 68,859 0.3% American Indian alone 19,958 0.10% Other race alone 10,757 0.05% Native Hawaiian and Other
12,070,642 40.2% Hispanic 11,683,430 38.9% White alone 3,508,706 11.7% Black alone 1,608,173 5.4% Asian alone 956,560 3.2% Two or more races 125,763 0.4% Other race alone 47,023 0.2% American Indian alone 29,275 0.10% Native Hawaiian and Other
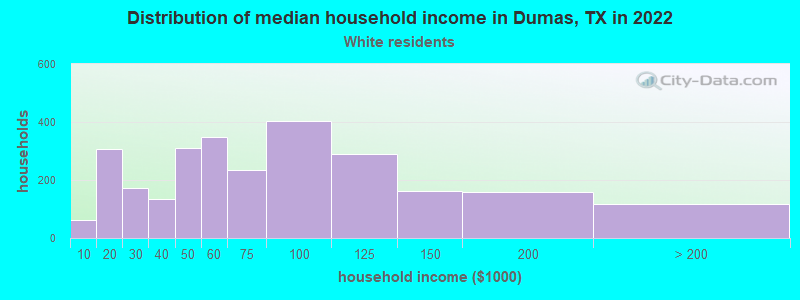
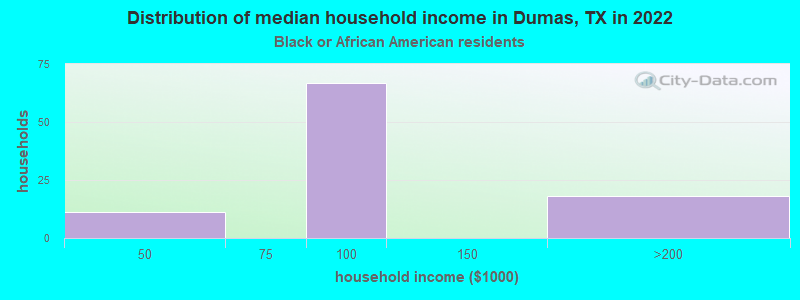
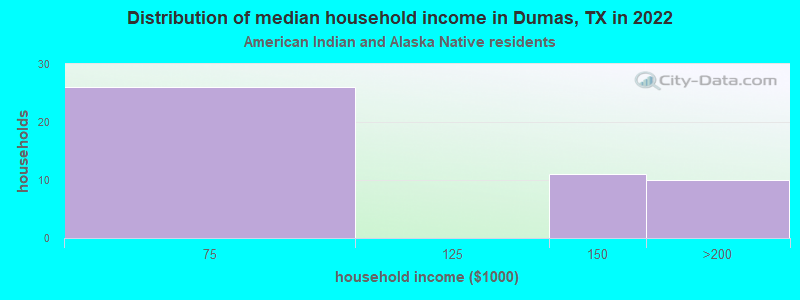
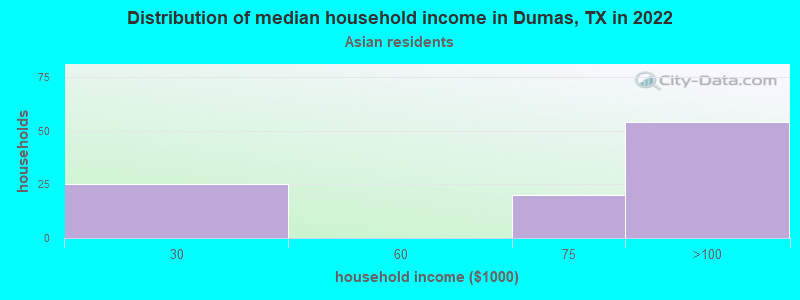
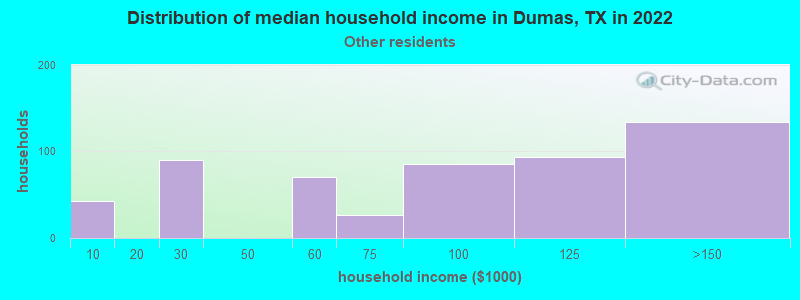
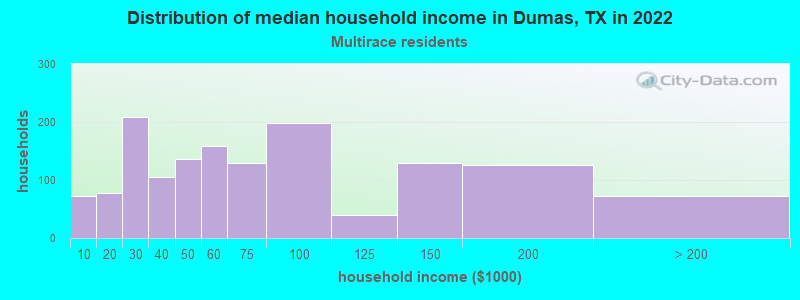
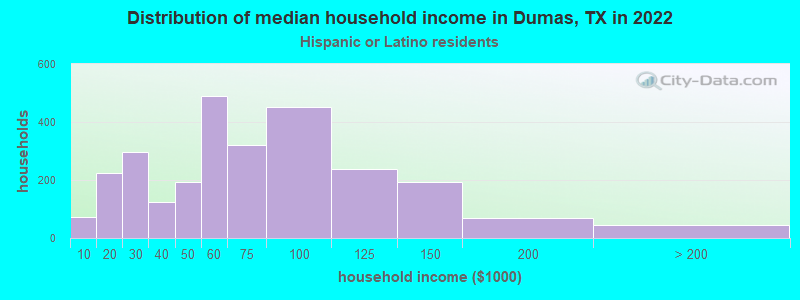
Income and house value in Dumas Median household income in 2022 $73,013 White non-Hispanic householders$92,864 Black householders$100,434 American Indian and Alaska Native householders$92,833 Asian householders$87,220 Some other race householders$57,528 Two or more races householders$59,902 Hispanic or Latino race householdersMedian 2022 house value $193,320 White Non-Hispanic householders$100,932 American Indian or Alaska Native householders $222,692 Asian householders$111,346 Some other race householders$158,341 Two or more races householders$108,142 Hispanic or Latino householders
Median age by race in Dumas
35.9 Median age for White residents36.6 31.6 28.1 Median age for Black or African American residents28.7 27.2 36.4 Median age for American Indian / Alaska Native residents33.9 58.7 12.8 Median age for Asian residents12.3 34.9 -581,560,283.1 Median age for Native Hawaiian / Pacific Islander residents-612,729,233.5 -577,777,777.2 23.6 Median age for Other race residents23.9 22.3 29.5 Median age for Two or more races residents26.2 32.9 45.0 Median age for White alone residents47.1 44.0 27.0 Median age for Hispanic or Latino residents27.5 26.2
Owner/renter occupied households by race in Dumas
House owners and renters - White residents 2,129 76.4% Owner occupied658 23.6% Renter occupiedHouse owners and renters - Black or African American residents 17 17.4% Owner occupied80 82.6% Renter occupiedHouse owners and renters - American Indian / Alaska Native residents 41 83.5% Owner occupied8 16.5% Renter occupiedHouse owners and renters - Asian residents 55 52.4% Owner occupied50 47.6% Renter occupiedHouse owners and renters - Other race residents 392 70.0% Owner occupied168 30.0% Renter occupiedHouse owners and renters - Two or more races residents 625 43.0% Owner occupied830 57.0% Renter occupiedHouse owners and renters - White alone residents 1,426 81.6% Owner occupied322 18.4% Renter occupiedHouse owners and renters - Hispanic or Latino residents 1,664 60.6% Owner occupied1,083 39.4% Renter occupied
Language usage in Dumas
English speakers - Total 52.6% of residents of Dumas speak English at home.
41.3% of residents speak Spanish at home 3,556 63.5% Speak English very well2,043 36.5% Speak English less than very well6.0% of residents speak other language at home 524 64.8% Speak English very well285 35.2% Speak English less than very well
English speakers - Born in the United States 62.1% of residents of Dumas speak English at home.
37.5% of residents speak Spanish at home 703 78.6% Speak English very well191 21.4% Speak English less than very well0.3% of residents speak other language at home 8 100.0% Speak English very well
English speakers - Native, born elsewhere 80.0% of residents of Dumas speak English at home.
22.4% of residents speak other language at home 38 100.0% Speak English very well
English speakers - Foreign-born 6.7% of residents of Dumas speak English at home.
74.2% of residents speak Spanish at home 774 32.5% Speak English very well1,606 67.5% Speak English less than very well18.7% of residents speak other language at home 395 65.9% Speak English very well204 34.1% Speak English less than very well
White (Caucasian) - Speak only English Native:
82.7% (4,965)Foreign-born:
9.4% (66)
White (Caucasian) - Speak another language Native:
14.1% (845)Foreign-born:
83.6% (587)
Black or African American - Speak only English Native:
77.4% (202)Foreign-born:
15.5% (40)
Black or African American - Speak another language Native:
22.5% (59)Foreign-born:
87.1% (226)
American Indian / Alaska Native - Speak another language Native:
28.3% (13)Foreign-born:
98.9% (140)
Asian - Speak another language Native:
98.9% (145)Foreign-born:
93.0% (320)
Other race - Speak another language Native:
78.8% (1,145)Foreign-born:
99.5% (478)
Two or more races - Speak only English Native:
58.5% (1,615)Foreign-born:
10.7% (99)
Two or more races - Speak another language Native:
39.9% (1,102)Foreign-born:
89.0% (823)
White alone - Speak another language Native:
3.3% (130)Foreign-born:
99.8% (66)
Hispanic or Latino - Speak only English Native:
42.9% (2,323)Foreign-born:
4.3% (106)
Hispanic or Latino - Speak another language Native:
57.2% (3,101)Foreign-born:
95.6% (2,370)
Foreign-born residents in Dumas 3,207 residents are foreign born (16.9% Latin America , 2.5% Asia ).
This city:
21.7%Texas:
17.1%
Marital status for residents in Dumas Marital status - White (Caucasian) population 15 years and over
Males 26.2% Never married61.3% Now married0.6% Separated8.4% Widowed3.5% DivorcedFemales 22.4% Never married52.5% Now married0.9% Separated12.1% Widowed12.1% DivorcedWomen who gave birth in the past 12 months Now married:
68.2% (61)Unmarried:
31.8% (28)
Women who did not give birth in the past 12 months Now married:
45.0% (642)Unmarried:
55.0% (784)
Marital status - Black or African American population 15 years and over
Males 16.4% Never married51.2% Now married0.0% Separated0.0% Widowed32.4% DivorcedFemales 0.0% Never married100.0% Now married0.0% Separated0.0% Widowed0.0% DivorcedWomen who did not give birth in the past 12 months Now married:
100.0% (131)Unmarried:
0.0% (0)
Marital status - American Indian / Alaska Native population 15 years and over
Males 37.5% Never married13.9% Now married0.0% Separated0.0% Widowed48.6% DivorcedFemales 0.0% Never married74.2% Now married0.0% Separated0.0% Widowed25.8% DivorcedWomen who did not give birth in the past 12 months Now married:
100.0% (20)Unmarried:
0.0% (0)
Marital status - Asian population 15 years and over
Males 0.0% Never married100.0% Now married0.0% Separated0.0% Widowed0.0% DivorcedFemales 4.4% Never married92.2% Now married0.0% Separated3.3% Widowed0.0% DivorcedWomen who gave birth in the past 12 months Now married:
100.0% (20)Unmarried:
0.0% (0)
Women who did not give birth in the past 12 months Now married:
100.0% (69)Unmarried:
0.0% (0)
Marital status - Other race population 15 years and over
Males 54.4% Never married44.0% Now married1.6% Separated0.0% Widowed0.0% DivorcedFemales 54.4% Never married35.5% Now married0.0% Separated2.3% Widowed7.9% DivorcedWomen who gave birth in the past 12 months Now married:
100.0% (15)Unmarried:
0.0% (0)
Women who did not give birth in the past 12 months Now married:
22.3% (152)Unmarried:
77.7% (530)
Marital status - Two or more races population 15 years and over
Males 67.3% Never married25.1% Now married3.9% Separated3.7% Widowed0.0% DivorcedFemales 41.4% Never married32.2% Now married0.0% Separated5.8% Widowed20.6% DivorcedWomen who gave birth in the past 12 months Now married:
9.3% (7)Unmarried:
90.7% (64)
Women who did not give birth in the past 12 months Now married:
22.7% (197)Unmarried:
77.3% (670)
Marital status - White alone, not Hispanic / Latino population 15 years and over
Males 23.7% Never married55.9% Now married0.2% Separated16.1% Widowed4.1% DivorcedFemales 18.0% Never married49.2% Now married0.1% Separated21.3% Widowed11.4% DivorcedWomen who gave birth in the past 12 months Now married:
35.2% (19)Unmarried:
64.8% (35)
Women who did not give birth in the past 12 months Now married:
52.6% (416)Unmarried:
47.4% (375)
Marital status - Hispanic or Latino population 15 years and over
Males 44.3% Never married50.0% Now married1.9% Separated1.1% Widowed2.7% DivorcedFemales 36.7% Never married46.4% Now married1.1% Separated3.1% Widowed12.7% DivorcedWomen who gave birth in the past 12 months Now married:
63.2% (70)Unmarried:
36.8% (41)
Women who did not give birth in the past 12 months Now married:
32.1% (619)Unmarried:
67.9% (1,309)
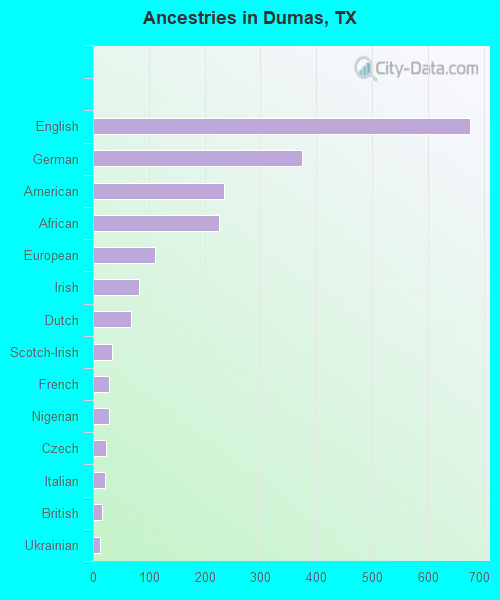
Ancestries in Dumas
676 7.4% English374 4.1% German235 2.6% American225 2.5% African112 1.2% European82 0.9% Irish68 0.7% Dutch34 0.4% Scotch-Irish29 0.3% French29 0.3% Nigerian24 0.3% Czech22 0.2% Italian17 0.2% British12 0.1% Ukrainian3 0.03% Scottish
Children Nativity (place of birth) in Dumas
Children under 6 years - Living with two parents Both parents native 597 100.0% NativeBoth parents foreign-born 192 100.0% NativeOne native, one foreign-born parent 112 100.0% NativeChildren under 6 years - Living with one parent Native parent 246 100.0% NativeForeign-born parent 143 100.0% NativeChildren 6 to 17 years - Living with two parents Both parents native 802 100.0% Native0 0.0% Foreign-bornBoth parents foreign-born 585 62.8% Native347 37.2% Foreign-bornOne native, one foreign-born parent 186 85.4% Native32 14.6% Foreign-bornChildren 6 to 17 years - Living with one parent Native parent 1,088 100.0% NativeForeign-born parent 271 50.5% Native266 49.5% Foreign-born
Grandparents responsible for own grandchildren in Dumas
Grandparents (30 to 59 years) White / Caucasian 59 88.6% Responsible for grandchildren8 11.4% Not responsible for grandchildrenAmerican Indian / Alaska Native 14 100.0% Not responsible for grandchildrenOther race 57 100.0% Not responsible for grandchildrenTwo or more races 18 100.0% Responsible for grandchildrenWhite alone, not Hispanic / Latino 58 83.0% Responsible for grandchildren12 17.0% Not responsible for grandchildrenHispanic or Latino 22 33.5% Responsible for grandchildren44 66.5% Not responsible for grandchildrenGrandparents (60 years and over) White / Caucasian 106 69.0% Responsible for grandchildren47 31.0% Not responsible for grandchildrenAmerican Indian / Alaska Native 9 100.0% Responsible for grandchildrenOther race 73 100.0% Not responsible for grandchildrenTwo or more races 18 100.0% Responsible for grandchildrenWhite alone, not Hispanic / Latino 37 100.0% Responsible for grandchildrenHispanic or Latino 100 43.4% Responsible for grandchildren130 56.6% Not responsible for grandchildren