Races in Cortlandville, New York (NY) Detailed Stats
Ancestries, Foreign-born residents, place of birth
2.0% of Cortlandville, NY residents are foreign-born , which is 1009.7% less than the foreign-born rate of 22.0% across the entire state of New York.
Race distribution in Cortlandville

- 7,61796.2%White alone
- 1031.3%Two or more races
- 841.1%Hispanic
- 550.7%Asian alone
- 320.4%Black alone
- 240.3%American Indian alone
- 40.05%Other race alone

2000
2022
-
- 11,760,98162.0%White alone
- 2,867,58315.1%Hispanic
- 2,812,62314.8%Black alone
- 1,035,9265.5%Asian alone
- 366,1161.9%Two or more races
- 75,4990.4%Other race alone
- 52,4990.3%American Indian alone
- 5,2300.03%Native Hawaiian and Other
Pacific Islander alone

-
- 10,408,93352.9%White alone
- 3,867,29919.7%Hispanic
- 2,633,84013.4%Black alone
- 1,776,2869.0%Asian alone
- 732,6703.7%Two or more races
- 216,1101.1%Other race alone
- 35,0820.2%American Indian alone
- 6,9310.04%Native Hawaiian and Other
Pacific Islander alone

Income and house value in Cortlandville
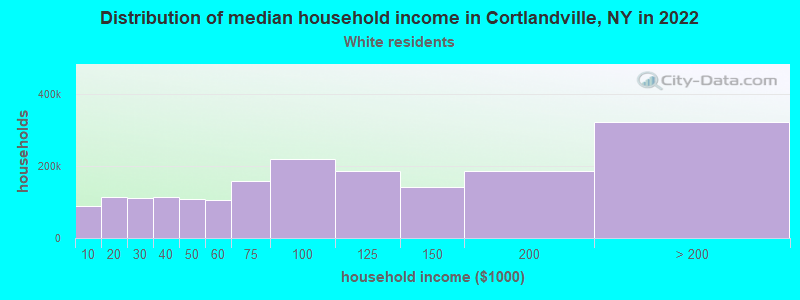
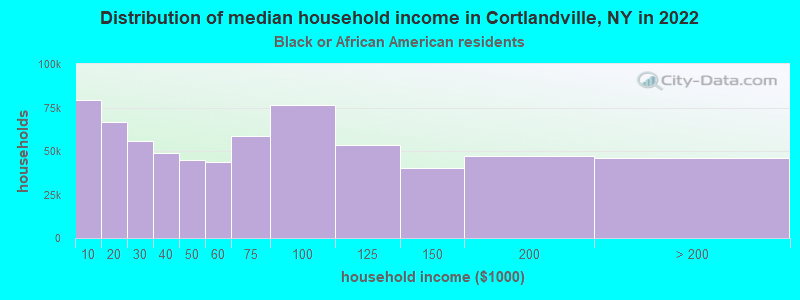
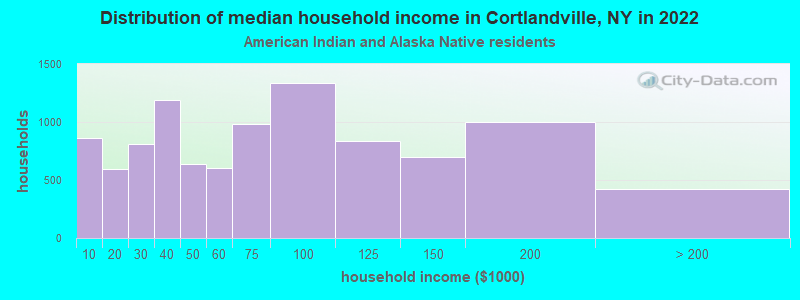
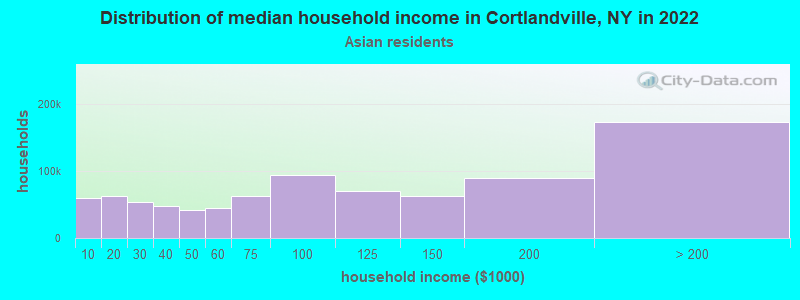
- Median household income in 2022
- $68,949White non-Hispanic householders
- $76,021Black householders
- $28,327American Indian and Alaska Native householders
- over $200,000Asian householders
- $13,014Some other race householders
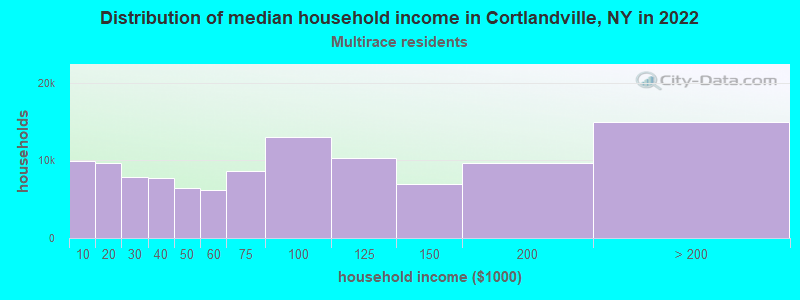
- $24,581Two or more races householders
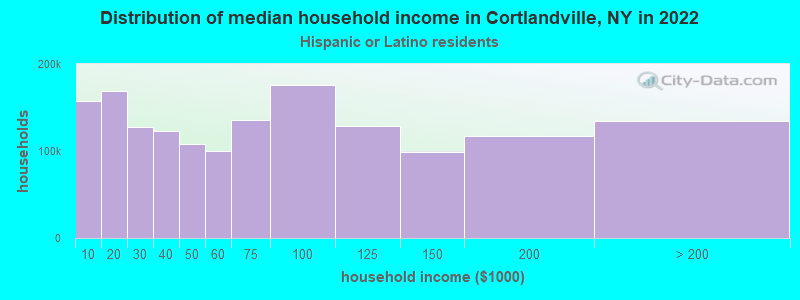
- $148,266Hispanic or Latino race householders
- Median 2022 house value
- $178,418White Non-Hispanic householders
- $173,170American Indian or Alaska Native householders
- $288,617Asian householders
- $157,427Hispanic or Latino householders
Household income for White non-Hispanic householders
Household income for Black householders
Household income for American Indian and Alaska Native householders
Household income for Asian householders
Household income for Two or more races householders
Household income for Hispanic or Latino race householders
Foreign-born residents in Cortlandville
157 residents are foreign born
| This city: | 2.0% |
| New York: | 20.4% |
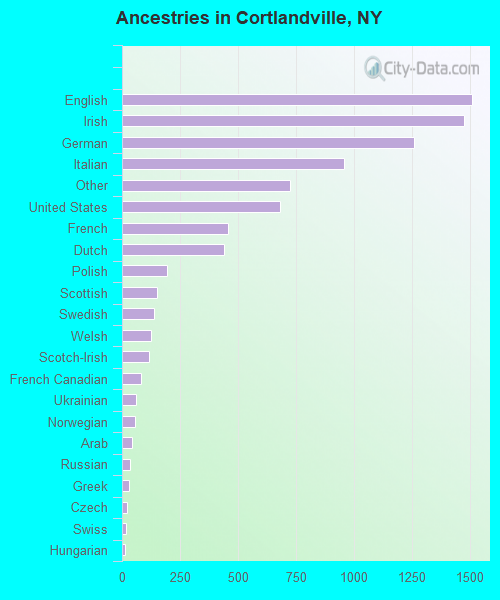
Ancestries in Cortlandville

- 1,50717.5%English
- 1,47417.1%Irish
- 1,25914.6%German
- 95811.1%Italian
- 7268.4%Other
- 6807.9%United States
- 4565.3%French
- 4395.1%Dutch
- 1962.3%Polish
- 1491.7%Scottish
- 1391.6%Swedish
- 1231.4%Welsh
- 1161.3%Scotch-Irish
- 810.9%French Canadian
- 600.7%Ukrainian
- 550.6%Norwegian
- 410.5%Arab
- 360.4%Russian
- 290.3%Greek
- 220.3%Czech
- 180.2%Swiss
- 140.2%Hungarian
- 130.2%Danish
- 90.1%West Indian
- 80.09%Slovak
- 70.08%Portuguese
Zip codes: 13045.