Races in Charleston, Illinois (IL) Detailed Stats
Data:
Races - White alone (%)
Races - White alone (% change since 2000)
Races - Black alone (%)
Races - Black alone (% change since 2000)
Races - American Indian alone (%)
Races - American Indian alone (% change since 2000)
Races - Asian alone (%)
Races - Asian alone (% change since 2000)
Races - Hispanic (%)
Races - Hispanic (% change since 2000)
Races - Native Hawaiian and Other Pacific Islander alone (%)
Races - Native Hawaiian and Other Pacific Islander alone (% change since 2000)
Races - Two or more races(%)
Races - Two or more races(% change since 2000)
Races - Other race alone (%)
Races - Other race alone (% change since 2000)
Racial diversity
Place of birth - Born in state of residence (%)
Place of birth - Born in state of residence (%) - White
Place of birth - Born in state of residence (%) - Black or African American
Place of birth - Born in state of residence (%) - Asian
Place of birth - Born in state of residence (%) - Hispanic or Latino
Place of birth - Born in state of residence (%) - American Indian and Alaska Native
Place of birth - Born in state of residence (%) - Multirace
Place of birth - Born in state of residence (%) - Other Race
Place of birth - Born in other state (%)
Place of birth - Born in other state (%) - White
Place of birth - Born in other state (%) - Black or African American
Place of birth - Born in other state (%) - Asian
Place of birth - Born in other state (%) - Hispanic or Latino
Place of birth - Born in other state (%) - American Indian and Alaska Native
Place of birth - Born in other state (%) - Multirace
Place of birth - Born in other state (%) - Other Race
Place of birth - Native, outside of US (%)
Place of birth - Native, outside of US (%) - White
Place of birth - Native, outside of US (%) - Black or African American
Place of birth - Native, outside of US (%) - Asian
Place of birth - Native, outside of US (%) - Hispanic or Latino
Place of birth - Native, outside of US (%) - American Indian and Alaska Native
Place of birth - Native, outside of US (%) - Multirace
Place of birth - Native, outside of US (%) - Other Race
Place of birth - Foreign born (%)
Place of birth - Foreign born (%) - White
Place of birth - Foreign born (%) - Black or African American
Place of birth - Foreign born (%) - Asian
Place of birth - Foreign born (%) - Hispanic or Latino
Place of birth - Foreign born (%) - American Indian and Alaska Native
Place of birth - Foreign born (%) - Multirace
Place of birth - Foreign born (%) - Other Race
Residents speaking English at home (%)
Residents speaking English at home - Born in the United States (%)
Residents speaking English at home - Native, born elsewhere (%)
Residents speaking English at home - Foreign born (%)
Residents speaking Spanish at home (%)
Residents speaking Spanish at home - Born in the United States (%)
Residents speaking Spanish at home - Native, born elsewhere (%)
Residents speaking Spanish at home - Foreign born (%)
Residents speaking other language at home (%)
Residents speaking other language at home - Born in the United States (%)
Residents speaking other language at home - Native, born elsewhere (%)
Residents speaking other language at home - Foreign born (%)
Marital status - Never married (%)
Marital status - Now married (%)
Marital status - Separated (%)
Marital status - Widowed (%)
Marital status - Divorced (%)
Ancestries Reported - Arab (%)
Ancestries Reported - Czech (%)
Ancestries Reported - Danish (%)
Ancestries Reported - Dutch (%)
Ancestries Reported - English (%)
Ancestries Reported - French (%)
Ancestries Reported - French Canadian (%)
Ancestries Reported - German (%)
Ancestries Reported - Greek (%)
Ancestries Reported - Hungarian (%)
Ancestries Reported - Irish (%)
Ancestries Reported - Italian (%)
Ancestries Reported - Lithuanian (%)
Ancestries Reported - Norwegian (%)
Ancestries Reported - Polish (%)
Ancestries Reported - Portuguese (%)
Ancestries Reported - Russian (%)
Ancestries Reported - Scotch-Irish (%)
Ancestries Reported - Scottish (%)
Ancestries Reported - Slovak (%)
Ancestries Reported - Subsaharan African (%)
Ancestries Reported - Swedish (%)
Ancestries Reported - Swiss (%)
Ancestries Reported - Ukrainian (%)
Ancestries Reported - United States (%)
Ancestries Reported - Welsh (%)
Ancestries Reported - West Indian (%)
Ancestries Reported - Other (%)
Geographical mobility - Same house 1 year ago (%)
Geographical mobility - Same house 1 year ago (%) - White
Geographical mobility - Same house 1 year ago (%) - Black or African American
Geographical mobility - Same house 1 year ago (%) - Asian
Geographical mobility - Same house 1 year ago (%) - Hispanic or Latino
Geographical mobility - Same house 1 year ago (%) - American Indian and Alaska Native
Geographical mobility - Same house 1 year ago (%) - Multirace
Geographical mobility - Same house 1 year ago (%) - Other Race
Geographical mobility - Moved within same county (%)
Geographical mobility - Moved within same county (%) - White
Geographical mobility - Moved within same county (%) - Black or African American
Geographical mobility - Moved within same county (%) - Asian
Geographical mobility - Moved within same county (%) - Hispanic or Latino
Geographical mobility - Moved within same county (%) - American Indian and Alaska Native
Geographical mobility - Moved within same county (%) - Multirace
Geographical mobility - Moved within same county (%) - Other Race
Geographical mobility - Moved from different county within same state (%)
Geographical mobility - Moved from different county within same state (%) - White
Geographical mobility - Moved from different county within same state (%) - Black or African American
Geographical mobility - Moved from different county within same state (%) - Asian
Geographical mobility - Moved from different county within same state (%) - Hispanic or Latino
Geographical mobility - Moved from different county within same state (%) - American Indian and Alaska Native
Geographical mobility - Moved from different county within same state (%) - Multirace
Geographical mobility - Moved from different county within same state (%) - Other Race
Geographical mobility - Moved from different state (%)
Geographical mobility - Moved from different state (%) - White
Geographical mobility - Moved from different state (%) - Black or African American
Geographical mobility - Moved from different state (%) - Asian
Geographical mobility - Moved from different state (%) - Hispanic or Latino
Geographical mobility - Moved from different state (%) - American Indian and Alaska Native
Geographical mobility - Moved from different state (%) - Multirace
Geographical mobility - Moved from different state (%) - Other Race
Geographical mobility - Moved from abroad (%)
Geographical mobility - Moved from abroad (%) - White
Geographical mobility - Moved from abroad (%) - Black or African American
Geographical mobility - Moved from abroad (%) - Asian
Geographical mobility - Moved from abroad (%) - Hispanic or Latino
Geographical mobility - Moved from abroad (%) - American Indian and Alaska Native
Geographical mobility - Moved from abroad (%) - Multirace
Geographical mobility - Moved from abroad (%) - Other Race
Place of birth for the foreign-born population - Ireland (%)
Place of birth for the foreign-born population - Denmark (%)
Place of birth for the foreign-born population - Norway (%)
Place of birth for the foreign-born population - Sweden (%)
Place of birth for the foreign-born population - United Kingdom (%)
Place of birth for the foreign-born population - England (%)
Place of birth for the foreign-born population - Scotland (%)
Place of birth for the foreign-born population - Other Northern Europe (%)
Place of birth for the foreign-born population - Austria (%)
Place of birth for the foreign-born population - Belgium (%)
Place of birth for the foreign-born population - France (%)
Place of birth for the foreign-born population - Germany (%)
Place of birth for the foreign-born population - Netherlands (%)
Place of birth for the foreign-born population - Switzerland (%)
Place of birth for the foreign-born population - Other Western Europe (%)
Place of birth for the foreign-born population - Greece (%)
Place of birth for the foreign-born population - Italy (%)
Place of birth for the foreign-born population - Portugal (%)
Place of birth for the foreign-born population - Spain (%)
Place of birth for the foreign-born population - Other Southern Europe (%)
Place of birth for the foreign-born population - Albania (%)
Place of birth for the foreign-born population - Belarus (%)
Place of birth for the foreign-born population - Bosnia and Herzegovina (%)
Place of birth for the foreign-born population - Bulgaria (%)
Place of birth for the foreign-born population - Croatia (%)
Place of birth for the foreign-born population - Czechoslovakia (%)
Place of birth for the foreign-born population - Hungary (%)
Place of birth for the foreign-born population - Latvia (%)
Place of birth for the foreign-born population - Lithuania (%)
Place of birth for the foreign-born population - North Macedonia (Macedonia) (%)
Place of birth for the foreign-born population - Moldova (%)
Place of birth for the foreign-born population - Poland (%)
Place of birth for the foreign-born population - Romania (%)
Place of birth for the foreign-born population - Russia (%)
Place of birth for the foreign-born population - Serbia (%)
Place of birth for the foreign-born population - Ukraine (%)
Place of birth for the foreign-born population - Other Eastern Europe (%)
Place of birth for the foreign-born population - China (%)
Place of birth for the foreign-born population - Hong Kong (%)
Place of birth for the foreign-born population - Taiwan (%)
Place of birth for the foreign-born population - Japan (%)
Place of birth for the foreign-born population - Korea (%)
Place of birth for the foreign-born population - Other Eastern Asia (%)
Place of birth for the foreign-born population - Afghanistan (%)
Place of birth for the foreign-born population - Bangladesh (%)
Place of birth for the foreign-born population - India (%)
Place of birth for the foreign-born population - Iran (%)
Place of birth for the foreign-born population - Kazakhstan (%)
Place of birth for the foreign-born population - Nepal (%)
Place of birth for the foreign-born population - Pakistan (%)
Place of birth for the foreign-born population - Sri Lanka (%)
Place of birth for the foreign-born population - Uzbekistan (%)
Place of birth for the foreign-born population - Other South Central Asia (%)
Place of birth for the foreign-born population - Burma (%)
Place of birth for the foreign-born population - Cambodia (%)
Place of birth for the foreign-born population - Indonesia (%)
Place of birth for the foreign-born population - Laos (%)
Place of birth for the foreign-born population - Malaysia (%)
Place of birth for the foreign-born population - Philippines (%)
Place of birth for the foreign-born population - Singapore (%)
Place of birth for the foreign-born population - Thailand (%)
Place of birth for the foreign-born population - Vietnam (%)
Place of birth for the foreign-born population - Other South Eastern Asia (%)
Place of birth for the foreign-born population - Armenia (%)
Place of birth for the foreign-born population - Iraq (%)
Place of birth for the foreign-born population - Israel (%)
Place of birth for the foreign-born population - Jordan (%)
Place of birth for the foreign-born population - Kuwait (%)
Place of birth for the foreign-born population - Lebanon (%)
Place of birth for the foreign-born population - Saudi Arabia (%)
Place of birth for the foreign-born population - Syria (%)
Place of birth for the foreign-born population - Turkey (%)
Place of birth for the foreign-born population - Yemen (%)
Place of birth for the foreign-born population - Other Western Asia (%)
Place of birth for the foreign-born population - Eritrea (%)
Place of birth for the foreign-born population - Ethiopia (%)
Place of birth for the foreign-born population - Kenya (%)
Place of birth for the foreign-born population - Somalia (%)
Place of birth for the foreign-born population - Uganda (%)
Place of birth for the foreign-born population - Zimbabwe (%)
Place of birth for the foreign-born population - Other Eastern Africa (%)
Place of birth for the foreign-born population - Cameroon (%)
Place of birth for the foreign-born population - Congo (%)
Place of birth for the foreign-born population - Democratic Republic of Congo (Zaire) (%)
Place of birth for the foreign-born population - Other Middle Africa (%)
Place of birth for the foreign-born population - Egypt (%)
Place of birth for the foreign-born population - Morocco (%)
Place of birth for the foreign-born population - Sudan (%)
Place of birth for the foreign-born population - Other Northern Africa (%)
Place of birth for the foreign-born population - South Africa (%)
Place of birth for the foreign-born population - Other Southern Africa (%)
Place of birth for the foreign-born population - Cabo Verde (%)
Place of birth for the foreign-born population - Ghana (%)
Place of birth for the foreign-born population - Liberia (%)
Place of birth for the foreign-born population - Nigeria (%)
Place of birth for the foreign-born population - Senegal (%)
Place of birth for the foreign-born population - Sierra Leone (%)
Place of birth for the foreign-born population - Other Western Africa (%)
Place of birth for the foreign-born population - Australia (%)
Place of birth for the foreign-born population - New Zealand (%)
Place of birth for the foreign-born population - Fiji (%)
Place of birth for the foreign-born population - Micronesia (%)
Place of birth for the foreign-born population - Bahamas (%)
Place of birth for the foreign-born population - Barbados (%)
Place of birth for the foreign-born population - Cuba (%)
Place of birth for the foreign-born population - Dominica (%)
Place of birth for the foreign-born population - Dominican Republic (%)
Place of birth for the foreign-born population - Grenada (%)
Place of birth for the foreign-born population - Haiti (%)
Place of birth for the foreign-born population - Jamaica (%)
Place of birth for the foreign-born population - St. Vincent and the Grenadines (%)
Place of birth for the foreign-born population - Trinidad and Tobago (%)
Place of birth for the foreign-born population - West Indies (%)
Place of birth for the foreign-born population - Other Caribbean (%)
Place of birth for the foreign-born population - Belize (%)
Place of birth for the foreign-born population - Costa Rica (%)
Place of birth for the foreign-born population - El Salvador (%)
Place of birth for the foreign-born population - Guatemala (%)
Place of birth for the foreign-born population - Honduras (%)
Place of birth for the foreign-born population - Mexico (%)
Place of birth for the foreign-born population - Nicaragua (%)
Place of birth for the foreign-born population - Panama (%)
Place of birth for the foreign-born population - Other Central America (%)
Place of birth for the foreign-born population - Argentina (%)
Place of birth for the foreign-born population - Bolivia (%)
Place of birth for the foreign-born population - Brazil (%)
Place of birth for the foreign-born population - Chile (%)
Place of birth for the foreign-born population - Colombia (%)
Place of birth for the foreign-born population - Ecuador (%)
Place of birth for the foreign-born population - Guyana (%)
Place of birth for the foreign-born population - Peru (%)
Place of birth for the foreign-born population - Uruguay (%)
Place of birth for the foreign-born population - Venezuela (%)
Place of birth for the foreign-born population - Other South America (%)
Place of birth for the foreign-born population - Canada (%)
Place of birth for the foreign-born population - Other Northern America (%)
Place of birth for the foreign-born population - Other (%)
Latest news about races in Charleston, IL collected exclusively by city-data.com from local newspapers, TV, and radio stations
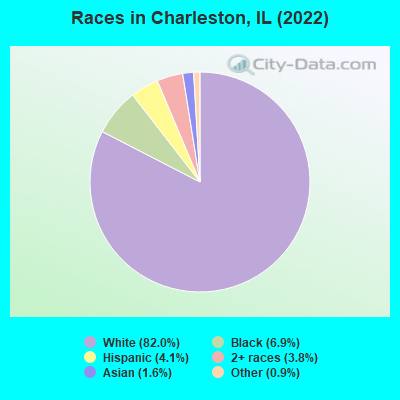
According to 2022 data, the most numerous races in Charleston, IL are White alone (14,391 residents), Hispanic (718 residents), and Black alone (1,206 residents). 94.6% of Charleston residents speak English at home. 3.6% of Charleston, IL residents are foreign-born (1.6% born in Asia, 1.2% born in Latin America, 0.5% born in Europe), which is 288.8% less than the foreign-born rate of 14.0% across the entire state of Illinois.
Race distribution in Charleston
2000 2022
8,424,140 67.8% White alone 1,856,152 14.9% Black alone 1,530,262 12.3% Hispanic 419,916 3.4% Asian alone 153,996 1.2% Two or more races 13,479 0.1% Other race alone 18,232 0.1% American Indian alone 3,116 0.03% Native Hawaiian and Other
7,356,301 58.5% White alone 2,299,726 18.3% Hispanic 1,660,423 13.2% Black alone 747,296 5.9% Asian alone 458,599 3.6% Two or more races 45,386 0.4% Other race alone 10,405 0.08% American Indian alone 3,896 0.03% Native Hawaiian and Other
Income and house value in Charleston Median household income in 2022 $48,561 White non-Hispanic householders$25,510 Black householders$21,767 Some other race householders$27,275 Hispanic or Latino race householdersMedian 2022 house value $135,946 White Non-Hispanic householders$83,685 Black or African American householders$192,134 American Indian or Alaska Native householders $352,332 Asian householders$234,831 Some other race householders$320,224 Two or more races householders$180,350 Hispanic or Latino householders
Median age by race in Charleston
32.3 Median age for White residents31.6 33.5 20.9 Median age for Black or African American residents20.9 21.1 -696,696,696.0 Median age for American Indian / Alaska Native residents-720,238,094.5 -688,956,432.9 22.6 Median age for Asian residents23.5 22.2 -593,236,714.4 Median age for Native Hawaiian / Pacific Islander residents-658,536,584.7 -576,015,108.0 62.1 Median age for Other race residents62.5 23.5 22.1 Median age for Two or more races residents15.1 26.0 32.7 Median age for White alone residents31.1 34.0 20.9 Median age for Hispanic or Latino residents22.7 20.0
Owner/renter occupied households by race in Charleston
House owners and renters - White residents 3,216 49.7% Owner occupied3,257 50.3% Renter occupiedHouse owners and renters - Black or African American residents 34 14.0% Owner occupied212 86.0% Renter occupiedHouse owners and renters - Asian residents 17 20.1% Owner occupied67 79.9% Renter occupiedHouse owners and renters - Other race residents 111 50.6% Owner occupied108 49.4% Renter occupiedHouse owners and renters - Two or more races residents 146 60.3% Owner occupied96 39.7% Renter occupiedHouse owners and renters - White alone residents 3,285 49.7% Owner occupied3,327 50.3% Renter occupiedHouse owners and renters - Hispanic or Latino residents 35 16.6% Owner occupied177 83.4% Renter occupied
Language usage in Charleston
English speakers - Total 94.6% of residents of Charleston speak English at home.
1.5% of residents speak Spanish at home 237 91.5% Speak English very well22 8.5% Speak English less than very well3.4% of residents speak other language at home 380 65.6% Speak English very well199 34.4% Speak English less than very well
English speakers - Born in the United States 94.8% of residents of Charleston speak English at home.
2.2% of residents speak Spanish at home 53 73.6% Speak English very well19 26.4% Speak English less than very well3.0% of residents speak other language at home 63 63.0% Speak English very well37 37.0% Speak English less than very well
English speakers - Native, born elsewhere 38.2% of residents of Charleston speak English at home.
22.3% of residents speak Spanish at home 35 100.0% Speak English very well39.5% of residents speak other language at home 57 91.9% Speak English very well5 8.1% Speak English less than very well
English speakers - Foreign-born 48.5% of residents of Charleston speak English at home.
2.8% of residents speak Spanish at home 18 100.0% Speak English very well45.5% of residents speak other language at home 177 61.5% Speak English very well111 38.5% Speak English less than very well
White (Caucasian) - Speak only English Native:
99.7% (13,633)Foreign-born:
52.2% (117)
White (Caucasian) - Speak another language Native:
1.8% (248)Foreign-born:
52.0% (117)
Black or African American - Speak only English Native:
98.6% (1,116)Foreign-born:
15.2% (6)
Black or African American - Speak another language Native:
1.4% (16)Foreign-born:
82.1% (33)
Asian - Speak only English Native:
16.3% (19)Foreign-born:
47.8% (83)
Asian - Speak another language Native:
84.8% (98)Foreign-born:
46.2% (80)
Other race - Speak only English Native:
92.2% (165)Foreign-born:
96.9% (104)
Other race - Speak another language Native:
14.8% (26)Foreign-born:
4.4% (5)
Two or more races - Speak another language Native:
6.2% (39)Foreign-born:
100.0% (42)
White alone - Speak only English Native:
98.3% (13,593)Foreign-born:
18.8% (32)
White alone - Speak another language Native:
1.6% (228)Foreign-born:
81.2% (140)
Hispanic or Latino - Speak only English Native:
68.0% (381)Foreign-born:
82.4% (103)
Hispanic or Latino - Speak another language Native:
33.5% (187)Foreign-born:
15.5% (19)
Foreign-born residents in Charleston 632 residents are foreign born (1.6% Asia , 1.2% Latin America , 0.5% Europe ).
This city:
3.6%Illinois:
14.1%
Marital status for residents in Charleston Marital status - White (Caucasian) population 15 years and over
Males 48.8% Never married38.1% Now married2.0% Separated3.3% Widowed7.8% DivorcedFemales 46.9% Never married36.7% Now married0.9% Separated6.5% Widowed9.0% DivorcedWomen who gave birth in the past 12 months Now married:
31.2% (49)Unmarried:
68.8% (108)
Women who did not give birth in the past 12 months Now married:
28.7% (1,145)Unmarried:
71.3% (2,842)
Marital status - Black or African American population 15 years and over
Males 85.6% Never married11.1% Now married0.0% Separated0.0% Widowed3.3% DivorcedFemales 92.2% Never married6.0% Now married0.2% Separated0.3% Widowed1.3% DivorcedWomen who did not give birth in the past 12 months Now married:
3.1% (17)Unmarried:
96.9% (531)
Marital status - Asian population 15 years and over
Males 44.3% Never married55.7% Now married0.0% Separated0.0% Widowed0.0% DivorcedFemales 66.4% Never married33.6% Now married0.0% Separated0.0% Widowed0.0% DivorcedWomen who did not give birth in the past 12 months Now married:
30.8% (44)Unmarried:
69.2% (100)
Marital status - Other race population 15 years and over
Males 100.0% Never married0.0% Now married0.0% Separated0.0% Widowed0.0% DivorcedFemales 51.4% Never married0.0% Now married0.0% Separated0.0% Widowed48.6% DivorcedWomen who did not give birth in the past 12 months Now married:
0.0% (0)Unmarried:
100.0% (63)
Marital status - Two or more races population 15 years and over
Males 33.7% Never married43.0% Now married15.7% Separated0.0% Widowed7.6% DivorcedFemales 44.1% Never married25.2% Now married0.0% Separated24.5% Widowed6.3% DivorcedWomen who did not give birth in the past 12 months Now married:
32.6% (41)Unmarried:
67.4% (84)
Marital status - White alone, not Hispanic / Latino population 15 years and over
Males 48.4% Never married38.9% Now married1.4% Separated3.4% Widowed7.8% DivorcedFemales 45.5% Never married37.6% Now married1.0% Separated6.6% Widowed9.3% DivorcedWomen who gave birth in the past 12 months Now married:
31.2% (52)Unmarried:
68.8% (115)
Women who did not give birth in the past 12 months Now married:
29.9% (1,221)Unmarried:
70.1% (2,855)
Marital status - Hispanic or Latino population 15 years and over
Males 67.4% Never married11.7% Now married13.4% Separated0.0% Widowed7.6% DivorcedFemales 97.5% Never married1.4% Now married0.0% Separated0.0% Widowed1.1% DivorcedWomen who did not give birth in the past 12 months Now married:
0.0% (0)Unmarried:
100.0% (283)
Ancestries in Charleston
1,156 16.7% German935 13.5% American737 10.6% English539 7.8% Irish234 3.4% European171 2.5% Italian138 2.0% Polish98 1.4% Assyrian97 1.4% Brazilian77 1.1% Scotch-Irish72 1.0% African51 0.7% Eastern European40 0.6% French38 0.5% British36 0.5% Dutch30 0.4% Ghanaian28 0.4% Welsh22 0.3% Swiss20 0.3% Scottish17 0.2% Canadian17 0.2% French Canadian17 0.2% Russian13 0.2% Czech13 0.2% Belizean7 0.1% Macedonian3 0.04% Northern European3 0.04% Sudanese
Geographical mobility in Charleston Same house 1 year ago 10,389 74.2% White (Caucasian)724 58.5% Black or African American8 99.7% American Indian / Alaska Native190 66.1% Asian201 70.3% Other race537 72.5% Two or more races10,718 75.0% White alone, not Hispanic / Latino343 47.7% Hispanic or LatinoMoved within same county 1,856 13.3% White / Caucasian121 9.8% Black or African American15 5.3% Asian47 6.4% Two or more races1,899 13.3% White alone, not Hispanic / Latino86 11.9% Hispanic or LatinoMoved within same state 1,364 9.7% White / Caucasian429 34.7% Black or African American80 27.9% Asian95 33.3% Other race105 14.1% Two or more races1,290 9.0% White alone, not Hispanic / Latino241 33.5% Hispanic or LatinoMoved from different state 286 2.0% White / Caucasian5 0.4% Black or African American5 1.8% Asian43 5.8% Two or more races246 1.7% White alone, not Hispanic / Latino54 7.5% Hispanic or LatinoMoved from abroad 29 0.2% White9 3.3% Asian6 2.0% Other race32 0.2% White alone, not Hispanic / Latino
Children Nativity (place of birth) in Charleston
Children under 6 years - Living with two parents Both parents native 405 100.0% NativeChildren under 6 years - Living with one parent Native parent 240 100.0% NativeChildren 6 to 17 years - Living with two parents Both parents native 846 93.8% Native56 6.2% Foreign-bornBoth parents foreign-born 76 100.0% NativeChildren 6 to 17 years - Living with one parent Native parent 275 100.0% Native
Grandparents responsible for own grandchildren in Charleston
Grandparents (30 to 59 years) White / Caucasian 41 77.3% Responsible for grandchildren12 22.7% Not responsible for grandchildrenWhite alone, not Hispanic / Latino 45 75.3% Responsible for grandchildren15 24.7% Not responsible for grandchildrenGrandparents (60 years and over) White / Caucasian 50 88.6% Responsible for grandchildren6 11.4% Not responsible for grandchildrenWhite alone, not Hispanic / Latino 54 88.2% Responsible for grandchildren7 11.8% Not responsible for grandchildren