Races in Bridge City-Orangefield, Texas (TX) Detailed Stats
Ancestries, Foreign-born residents, place of birth
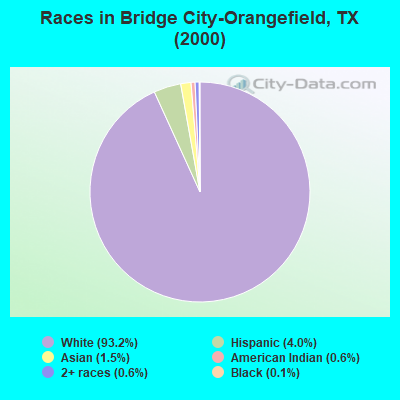
Race distribution in Bridge City-Orangefield

- 14,39593.2%White alone
- 6134.0%Hispanic
- 2261.5%Asian alone
- 960.6%Two or more races
- 960.6%American Indian alone
- 220.1%Black alone
- 20.01%Other race alone
- 20.01%Native Hawaiian and Other
Pacific Islander alone
2000
2022
-
- 10,933,31352.4%White alone
- 6,669,66632.0%Hispanic
- 2,364,25511.3%Black alone
- 554,4452.7%Asian alone
- 230,5671.1%Two or more races
- 68,8590.3%American Indian alone
- 19,9580.10%Other race alone
- 10,7570.05%Native Hawaiian and Other
Pacific Islander alone

-
- 12,070,64240.2%Hispanic
- 11,683,43038.9%White alone
- 3,508,70611.7%Black alone
- 1,608,1735.4%Asian alone
- 956,5603.2%Two or more races
- 125,7630.4%Other race alone
- 47,0230.2%American Indian alone
- 29,2750.10%Native Hawaiian and Other
Pacific Islander alone

Income and house value in Bridge City-Orangefield
- Median household income in 2022
- $81,562White non-Hispanic householders
- $87,498Some other race householders
- $48,740Two or more races householders
- $57,143Hispanic or Latino race householders
- Median 2022 house value
- $253,155White Non-Hispanic householders
- $237,833American Indian or Alaska Native householders
- $307,118Asian householders
- $130,575Some other race householders
- $211,518Two or more races householders
- $119,249Hispanic or Latino householders
Household income for White non-Hispanic householders

Household income for American Indian and Alaska Native householders

Household income for Asian householders

Household income for Two or more races householders

Household income for Hispanic or Latino race householders

Zip code: 77630