Races in Bergenfield, New Jersey (NJ) Detailed Stats
Data:
Races - White alone (%)
Races - White alone (% change since 2000)
Races - Black alone (%)
Races - Black alone (% change since 2000)
Races - American Indian alone (%)
Races - American Indian alone (% change since 2000)
Races - Asian alone (%)
Races - Asian alone (% change since 2000)
Races - Hispanic (%)
Races - Hispanic (% change since 2000)
Races - Native Hawaiian and Other Pacific Islander alone (%)
Races - Native Hawaiian and Other Pacific Islander alone (% change since 2000)
Races - Two or more races(%)
Races - Two or more races(% change since 2000)
Races - Other race alone (%)
Races - Other race alone (% change since 2000)
Racial diversity
Place of birth - Born in state of residence (%)
Place of birth - Born in state of residence (%) - White
Place of birth - Born in state of residence (%) - Black or African American
Place of birth - Born in state of residence (%) - Asian
Place of birth - Born in state of residence (%) - Hispanic or Latino
Place of birth - Born in state of residence (%) - American Indian and Alaska Native
Place of birth - Born in state of residence (%) - Multirace
Place of birth - Born in state of residence (%) - Other Race
Place of birth - Born in other state (%)
Place of birth - Born in other state (%) - White
Place of birth - Born in other state (%) - Black or African American
Place of birth - Born in other state (%) - Asian
Place of birth - Born in other state (%) - Hispanic or Latino
Place of birth - Born in other state (%) - American Indian and Alaska Native
Place of birth - Born in other state (%) - Multirace
Place of birth - Born in other state (%) - Other Race
Place of birth - Native, outside of US (%)
Place of birth - Native, outside of US (%) - White
Place of birth - Native, outside of US (%) - Black or African American
Place of birth - Native, outside of US (%) - Asian
Place of birth - Native, outside of US (%) - Hispanic or Latino
Place of birth - Native, outside of US (%) - American Indian and Alaska Native
Place of birth - Native, outside of US (%) - Multirace
Place of birth - Native, outside of US (%) - Other Race
Place of birth - Foreign born (%)
Place of birth - Foreign born (%) - White
Place of birth - Foreign born (%) - Black or African American
Place of birth - Foreign born (%) - Asian
Place of birth - Foreign born (%) - Hispanic or Latino
Place of birth - Foreign born (%) - American Indian and Alaska Native
Place of birth - Foreign born (%) - Multirace
Place of birth - Foreign born (%) - Other Race
Residents speaking English at home (%)
Residents speaking English at home - Born in the United States (%)
Residents speaking English at home - Native, born elsewhere (%)
Residents speaking English at home - Foreign born (%)
Residents speaking Spanish at home (%)
Residents speaking Spanish at home - Born in the United States (%)
Residents speaking Spanish at home - Native, born elsewhere (%)
Residents speaking Spanish at home - Foreign born (%)
Residents speaking other language at home (%)
Residents speaking other language at home - Born in the United States (%)
Residents speaking other language at home - Native, born elsewhere (%)
Residents speaking other language at home - Foreign born (%)
Marital status - Never married (%)
Marital status - Now married (%)
Marital status - Separated (%)
Marital status - Widowed (%)
Marital status - Divorced (%)
Ancestries Reported - Arab (%)
Ancestries Reported - Czech (%)
Ancestries Reported - Danish (%)
Ancestries Reported - Dutch (%)
Ancestries Reported - English (%)
Ancestries Reported - French (%)
Ancestries Reported - French Canadian (%)
Ancestries Reported - German (%)
Ancestries Reported - Greek (%)
Ancestries Reported - Hungarian (%)
Ancestries Reported - Irish (%)
Ancestries Reported - Italian (%)
Ancestries Reported - Lithuanian (%)
Ancestries Reported - Norwegian (%)
Ancestries Reported - Polish (%)
Ancestries Reported - Portuguese (%)
Ancestries Reported - Russian (%)
Ancestries Reported - Scotch-Irish (%)
Ancestries Reported - Scottish (%)
Ancestries Reported - Slovak (%)
Ancestries Reported - Subsaharan African (%)
Ancestries Reported - Swedish (%)
Ancestries Reported - Swiss (%)
Ancestries Reported - Ukrainian (%)
Ancestries Reported - United States (%)
Ancestries Reported - Welsh (%)
Ancestries Reported - West Indian (%)
Ancestries Reported - Other (%)
Geographical mobility - Same house 1 year ago (%)
Geographical mobility - Same house 1 year ago (%) - White
Geographical mobility - Same house 1 year ago (%) - Black or African American
Geographical mobility - Same house 1 year ago (%) - Asian
Geographical mobility - Same house 1 year ago (%) - Hispanic or Latino
Geographical mobility - Same house 1 year ago (%) - American Indian and Alaska Native
Geographical mobility - Same house 1 year ago (%) - Multirace
Geographical mobility - Same house 1 year ago (%) - Other Race
Geographical mobility - Moved within same county (%)
Geographical mobility - Moved within same county (%) - White
Geographical mobility - Moved within same county (%) - Black or African American
Geographical mobility - Moved within same county (%) - Asian
Geographical mobility - Moved within same county (%) - Hispanic or Latino
Geographical mobility - Moved within same county (%) - American Indian and Alaska Native
Geographical mobility - Moved within same county (%) - Multirace
Geographical mobility - Moved within same county (%) - Other Race
Geographical mobility - Moved from different county within same state (%)
Geographical mobility - Moved from different county within same state (%) - White
Geographical mobility - Moved from different county within same state (%) - Black or African American
Geographical mobility - Moved from different county within same state (%) - Asian
Geographical mobility - Moved from different county within same state (%) - Hispanic or Latino
Geographical mobility - Moved from different county within same state (%) - American Indian and Alaska Native
Geographical mobility - Moved from different county within same state (%) - Multirace
Geographical mobility - Moved from different county within same state (%) - Other Race
Geographical mobility - Moved from different state (%)
Geographical mobility - Moved from different state (%) - White
Geographical mobility - Moved from different state (%) - Black or African American
Geographical mobility - Moved from different state (%) - Asian
Geographical mobility - Moved from different state (%) - Hispanic or Latino
Geographical mobility - Moved from different state (%) - American Indian and Alaska Native
Geographical mobility - Moved from different state (%) - Multirace
Geographical mobility - Moved from different state (%) - Other Race
Geographical mobility - Moved from abroad (%)
Geographical mobility - Moved from abroad (%) - White
Geographical mobility - Moved from abroad (%) - Black or African American
Geographical mobility - Moved from abroad (%) - Asian
Geographical mobility - Moved from abroad (%) - Hispanic or Latino
Geographical mobility - Moved from abroad (%) - American Indian and Alaska Native
Geographical mobility - Moved from abroad (%) - Multirace
Geographical mobility - Moved from abroad (%) - Other Race
Place of birth for the foreign-born population - Ireland (%)
Place of birth for the foreign-born population - Denmark (%)
Place of birth for the foreign-born population - Norway (%)
Place of birth for the foreign-born population - Sweden (%)
Place of birth for the foreign-born population - United Kingdom (%)
Place of birth for the foreign-born population - England (%)
Place of birth for the foreign-born population - Scotland (%)
Place of birth for the foreign-born population - Other Northern Europe (%)
Place of birth for the foreign-born population - Austria (%)
Place of birth for the foreign-born population - Belgium (%)
Place of birth for the foreign-born population - France (%)
Place of birth for the foreign-born population - Germany (%)
Place of birth for the foreign-born population - Netherlands (%)
Place of birth for the foreign-born population - Switzerland (%)
Place of birth for the foreign-born population - Other Western Europe (%)
Place of birth for the foreign-born population - Greece (%)
Place of birth for the foreign-born population - Italy (%)
Place of birth for the foreign-born population - Portugal (%)
Place of birth for the foreign-born population - Spain (%)
Place of birth for the foreign-born population - Other Southern Europe (%)
Place of birth for the foreign-born population - Albania (%)
Place of birth for the foreign-born population - Belarus (%)
Place of birth for the foreign-born population - Bosnia and Herzegovina (%)
Place of birth for the foreign-born population - Bulgaria (%)
Place of birth for the foreign-born population - Croatia (%)
Place of birth for the foreign-born population - Czechoslovakia (%)
Place of birth for the foreign-born population - Hungary (%)
Place of birth for the foreign-born population - Latvia (%)
Place of birth for the foreign-born population - Lithuania (%)
Place of birth for the foreign-born population - North Macedonia (Macedonia) (%)
Place of birth for the foreign-born population - Moldova (%)
Place of birth for the foreign-born population - Poland (%)
Place of birth for the foreign-born population - Romania (%)
Place of birth for the foreign-born population - Russia (%)
Place of birth for the foreign-born population - Serbia (%)
Place of birth for the foreign-born population - Ukraine (%)
Place of birth for the foreign-born population - Other Eastern Europe (%)
Place of birth for the foreign-born population - China (%)
Place of birth for the foreign-born population - Hong Kong (%)
Place of birth for the foreign-born population - Taiwan (%)
Place of birth for the foreign-born population - Japan (%)
Place of birth for the foreign-born population - Korea (%)
Place of birth for the foreign-born population - Other Eastern Asia (%)
Place of birth for the foreign-born population - Afghanistan (%)
Place of birth for the foreign-born population - Bangladesh (%)
Place of birth for the foreign-born population - India (%)
Place of birth for the foreign-born population - Iran (%)
Place of birth for the foreign-born population - Kazakhstan (%)
Place of birth for the foreign-born population - Nepal (%)
Place of birth for the foreign-born population - Pakistan (%)
Place of birth for the foreign-born population - Sri Lanka (%)
Place of birth for the foreign-born population - Uzbekistan (%)
Place of birth for the foreign-born population - Other South Central Asia (%)
Place of birth for the foreign-born population - Burma (%)
Place of birth for the foreign-born population - Cambodia (%)
Place of birth for the foreign-born population - Indonesia (%)
Place of birth for the foreign-born population - Laos (%)
Place of birth for the foreign-born population - Malaysia (%)
Place of birth for the foreign-born population - Philippines (%)
Place of birth for the foreign-born population - Singapore (%)
Place of birth for the foreign-born population - Thailand (%)
Place of birth for the foreign-born population - Vietnam (%)
Place of birth for the foreign-born population - Other South Eastern Asia (%)
Place of birth for the foreign-born population - Armenia (%)
Place of birth for the foreign-born population - Iraq (%)
Place of birth for the foreign-born population - Israel (%)
Place of birth for the foreign-born population - Jordan (%)
Place of birth for the foreign-born population - Kuwait (%)
Place of birth for the foreign-born population - Lebanon (%)
Place of birth for the foreign-born population - Saudi Arabia (%)
Place of birth for the foreign-born population - Syria (%)
Place of birth for the foreign-born population - Turkey (%)
Place of birth for the foreign-born population - Yemen (%)
Place of birth for the foreign-born population - Other Western Asia (%)
Place of birth for the foreign-born population - Eritrea (%)
Place of birth for the foreign-born population - Ethiopia (%)
Place of birth for the foreign-born population - Kenya (%)
Place of birth for the foreign-born population - Somalia (%)
Place of birth for the foreign-born population - Uganda (%)
Place of birth for the foreign-born population - Zimbabwe (%)
Place of birth for the foreign-born population - Other Eastern Africa (%)
Place of birth for the foreign-born population - Cameroon (%)
Place of birth for the foreign-born population - Congo (%)
Place of birth for the foreign-born population - Democratic Republic of Congo (Zaire) (%)
Place of birth for the foreign-born population - Other Middle Africa (%)
Place of birth for the foreign-born population - Egypt (%)
Place of birth for the foreign-born population - Morocco (%)
Place of birth for the foreign-born population - Sudan (%)
Place of birth for the foreign-born population - Other Northern Africa (%)
Place of birth for the foreign-born population - South Africa (%)
Place of birth for the foreign-born population - Other Southern Africa (%)
Place of birth for the foreign-born population - Cabo Verde (%)
Place of birth for the foreign-born population - Ghana (%)
Place of birth for the foreign-born population - Liberia (%)
Place of birth for the foreign-born population - Nigeria (%)
Place of birth for the foreign-born population - Senegal (%)
Place of birth for the foreign-born population - Sierra Leone (%)
Place of birth for the foreign-born population - Other Western Africa (%)
Place of birth for the foreign-born population - Australia (%)
Place of birth for the foreign-born population - New Zealand (%)
Place of birth for the foreign-born population - Fiji (%)
Place of birth for the foreign-born population - Micronesia (%)
Place of birth for the foreign-born population - Bahamas (%)
Place of birth for the foreign-born population - Barbados (%)
Place of birth for the foreign-born population - Cuba (%)
Place of birth for the foreign-born population - Dominica (%)
Place of birth for the foreign-born population - Dominican Republic (%)
Place of birth for the foreign-born population - Grenada (%)
Place of birth for the foreign-born population - Haiti (%)
Place of birth for the foreign-born population - Jamaica (%)
Place of birth for the foreign-born population - St. Vincent and the Grenadines (%)
Place of birth for the foreign-born population - Trinidad and Tobago (%)
Place of birth for the foreign-born population - West Indies (%)
Place of birth for the foreign-born population - Other Caribbean (%)
Place of birth for the foreign-born population - Belize (%)
Place of birth for the foreign-born population - Costa Rica (%)
Place of birth for the foreign-born population - El Salvador (%)
Place of birth for the foreign-born population - Guatemala (%)
Place of birth for the foreign-born population - Honduras (%)
Place of birth for the foreign-born population - Mexico (%)
Place of birth for the foreign-born population - Nicaragua (%)
Place of birth for the foreign-born population - Panama (%)
Place of birth for the foreign-born population - Other Central America (%)
Place of birth for the foreign-born population - Argentina (%)
Place of birth for the foreign-born population - Bolivia (%)
Place of birth for the foreign-born population - Brazil (%)
Place of birth for the foreign-born population - Chile (%)
Place of birth for the foreign-born population - Colombia (%)
Place of birth for the foreign-born population - Ecuador (%)
Place of birth for the foreign-born population - Guyana (%)
Place of birth for the foreign-born population - Peru (%)
Place of birth for the foreign-born population - Uruguay (%)
Place of birth for the foreign-born population - Venezuela (%)
Place of birth for the foreign-born population - Other South America (%)
Place of birth for the foreign-born population - Canada (%)
Place of birth for the foreign-born population - Other Northern America (%)
Place of birth for the foreign-born population - Other (%)
Latest news about races in Bergenfield, NJ collected exclusively by city-data.com from local newspapers, TV, and radio stations
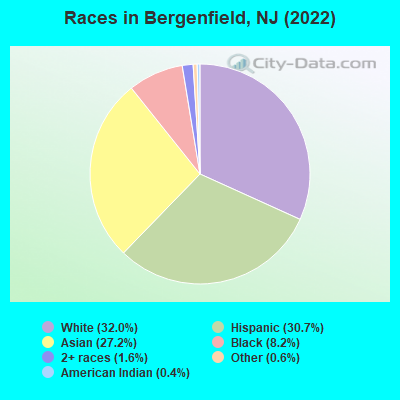
According to 2022 data, the most numerous races in Bergenfield, NJ are White alone (9,016 residents), Hispanic (8,661 residents), and Black alone (2,300 residents). 48.4% of Bergenfield residents speak English at home. 39.7% of Bergenfield, NJ residents are foreign-born (19.4% born in Asia, 15.9% born in Latin America), which is 42.1% greater than the foreign-born rate of 23.0% across the entire state of New Jersey.
Race distribution in Bergenfield
2000 2022
5,557,209 66.0% White alone 1,117,191 13.3% Hispanic 1,096,171 13.0% Black alone 477,012 5.7% Asian alone 133,689 1.6% Two or more races 19,565 0.2% Other race alone 11,338 0.1% American Indian alone 2,175 0.03% Native Hawaiian and Other
4,766,476 51.5% White alone 2,028,470 21.9% Hispanic 1,111,632 12.0% Black alone 923,546 10.0% Asian alone 332,237 3.6% Two or more races 89,847 1.0% Other race alone 8,557 0.09% American Indian alone 934 0.01% Native Hawaiian and Other
Income and house value in Bergenfield Median household income in 2022 $117,726 White non-Hispanic householders$119,188 Black householders$140,427 American Indian and Alaska Native householders$131,706 Asian householders$70,229 Some other race householders$111,068 Two or more races householders$92,789 Hispanic or Latino race householdersMedian 2022 house value $440,779 White Non-Hispanic householders$458,839 Black or African American householders $477,632 Asian householders$468,114 Some other race householders$424,914 Two or more races householders$461,280 Hispanic or Latino householders
Median age by race in Bergenfield
40.7 Median age for White residents40.1 41.3 38.4 Median age for Black or African American residents39.1 39.3 49.8 Median age for American Indian / Alaska Native residents17.8 49.4 46.6 Median age for Asian residents41.0 54.7 -510,460,250.5 Median age for Native Hawaiian / Pacific Islander residents-514,767,932.0 -713,070,378.3 39.0 Median age for Other race residents39.1 38.7 37.7 Median age for Two or more races residents34.7 39.8 40.9 Median age for White alone residents42.2 39.8 39.1 Median age for Hispanic or Latino residents34.6 40.5
Owner/renter occupied households by race in Bergenfield
House owners and renters - White residents 3,141 76.3% Owner occupied975 23.7% Renter occupiedHouse owners and renters - Black or African American residents 509 64.4% Owner occupied281 35.6% Renter occupiedHouse owners and renters - American Indian / Alaska Native residents 48 76.6% Owner occupied15 23.4% Renter occupiedHouse owners and renters - Asian residents 1,814 71.5% Owner occupied724 28.5% Renter occupiedHouse owners and renters - Other race residents 499 46.5% Owner occupied574 53.5% Renter occupiedHouse owners and renters - Two or more races residents 813 66.5% Owner occupied409 33.5% Renter occupiedHouse owners and renters - White alone residents 2,491 78.9% Owner occupied667 21.1% Renter occupiedHouse owners and renters - Hispanic or Latino residents 1,793 62.0% Owner occupied1,099 38.0% Renter occupied
Language usage in Bergenfield
English speakers - Total 48.4% of residents of Bergenfield speak English at home.
25.0% of residents speak Spanish at home 4,148 62.7% Speak English very well2,472 37.3% Speak English less than very well27.2% of residents speak other language at home 4,703 65.3% Speak English very well2,500 34.7% Speak English less than very well
English speakers - Born in the United States 72.7% of residents of Bergenfield speak English at home.
21.3% of residents speak Spanish at home 1,290 89.1% Speak English very well158 10.9% Speak English less than very well7.6% of residents speak other language at home 493 95.2% Speak English very well25 4.8% Speak English less than very well
English speakers - Native, born elsewhere 27.8% of residents of Bergenfield speak English at home.
63.2% of residents speak Spanish at home 366 72.5% Speak English very well139 27.5% Speak English less than very well10.3% of residents speak other language at home 63 76.8% Speak English very well19 23.2% Speak English less than very well
English speakers - Foreign-born 14.7% of residents of Bergenfield speak English at home.
33.4% of residents speak Spanish at home 1,577 42.7% Speak English very well2,116 57.3% Speak English less than very well52.0% of residents speak other language at home 3,324 57.8% Speak English very well2,431 42.2% Speak English less than very well
White (Caucasian) - Speak only English Native:
84.6% (7,313)Foreign-born:
21.0% (415)
White (Caucasian) - Speak another language Native:
14.1% (1,220)Foreign-born:
78.8% (1,556)
Black or African American - Speak only English Native:
89.4% (1,531)Foreign-born:
46.7% (334)
Black or African American - Speak another language Native:
10.6% (182)Foreign-born:
49.4% (354)
American Indian / Alaska Native - Speak only English Native:
38.2% (50)Foreign-born:
9.0% (4)
American Indian / Alaska Native - Speak another language Native:
31.4% (41)Foreign-born:
89.6% (42)
Asian - Speak only English Native:
62.6% (1,306)Foreign-born:
10.9% (587)
Asian - Speak another language Native:
38.1% (794)Foreign-born:
89.2% (4,810)
Other race - Speak only English Native:
20.7% (273)Foreign-born:
9.2% (143)
Other race - Speak another language Native:
80.5% (1,065)Foreign-born:
88.2% (1,377)
Two or more races - Speak only English Native:
39.1% (753)Foreign-born:
7.9% (125)
Two or more races - Speak another language Native:
63.3% (1,218)Foreign-born:
92.7% (1,475)
White alone - Speak only English Native:
90.8% (6,753)Foreign-born:
36.3% (295)
White alone - Speak another language Native:
9.1% (677)Foreign-born:
63.2% (513)
Hispanic or Latino - Speak only English Native:
33.1% (1,335)Foreign-born:
9.5% (393)
Hispanic or Latino - Speak another language Native:
68.0% (2,740)Foreign-born:
90.6% (3,728)
Foreign-born residents in Bergenfield 11,209 residents are foreign born (19.4% Asia , 15.9% Latin America ).
This city:
39.7%New Jersey:
23.2%
Marital status for residents in Bergenfield Marital status - White (Caucasian) population 15 years and over
Males 31.0% Never married57.9% Now married2.4% Separated1.4% Widowed7.2% DivorcedFemales 30.2% Never married48.1% Now married1.7% Separated9.3% Widowed10.7% DivorcedWomen who gave birth in the past 12 months Now married:
100.0% (186)Unmarried:
0.0% (0)
Women who did not give birth in the past 12 months Now married:
39.0% (899)Unmarried:
61.0% (1,409)
Marital status - Black or African American population 15 years and over
Males 40.2% Never married49.0% Now married0.6% Separated7.7% Widowed2.6% DivorcedFemales 35.9% Never married39.7% Now married4.1% Separated14.1% Widowed6.2% DivorcedWomen who did not give birth in the past 12 months Now married:
47.6% (347)Unmarried:
52.4% (382)
Marital status - American Indian / Alaska Native population 15 years and over
Males 82.8% Never married17.2% Now married0.0% Separated0.0% Widowed0.0% DivorcedFemales 39.2% Never married34.0% Now married10.3% Separated0.0% Widowed16.5% DivorcedWomen who did not give birth in the past 12 months Now married:
26.3% (15)Unmarried:
73.7% (43)
Marital status - Asian population 15 years and over
Males 35.1% Never married55.4% Now married0.7% Separated0.0% Widowed8.9% DivorcedFemales 26.7% Never married58.6% Now married1.5% Separated9.1% Widowed4.2% DivorcedWomen who did not give birth in the past 12 months Now married:
50.7% (672)Unmarried:
49.3% (653)
Marital status - Other race population 15 years and over
Males 40.1% Never married59.3% Now married0.0% Separated0.0% Widowed0.7% DivorcedFemales 36.4% Never married41.1% Now married8.3% Separated3.9% Widowed10.4% DivorcedWomen who gave birth in the past 12 months Now married:
0.0% (0)Unmarried:
100.0% (28)
Women who did not give birth in the past 12 months Now married:
49.8% (526)Unmarried:
50.2% (530)
Marital status - Two or more races population 15 years and over
Males 37.0% Never married57.3% Now married0.0% Separated1.0% Widowed4.7% DivorcedFemales 39.6% Never married47.2% Now married4.2% Separated3.2% Widowed5.7% DivorcedWomen who did not give birth in the past 12 months Now married:
44.1% (511)Unmarried:
55.9% (646)
Marital status - White alone, not Hispanic / Latino population 15 years and over
Males 31.0% Never married58.8% Now married3.3% Separated1.3% Widowed5.6% DivorcedFemales 30.9% Never married50.5% Now married0.9% Separated8.9% Widowed8.9% DivorcedWomen who gave birth in the past 12 months Now married:
100.0% (177)Unmarried:
0.0% (0)
Women who did not give birth in the past 12 months Now married:
36.5% (606)Unmarried:
63.5% (1,056)
Marital status - Hispanic or Latino population 15 years and over
Males 35.5% Never married57.2% Now married0.0% Separated1.1% Widowed6.2% DivorcedFemales 33.7% Never married42.5% Now married5.4% Separated7.4% Widowed11.0% DivorcedWomen who gave birth in the past 12 months Now married:
70.9% (41)Unmarried:
29.1% (17)
Women who did not give birth in the past 12 months Now married:
44.4% (1,130)Unmarried:
55.6% (1,418)
Ancestries in Bergenfield
951 5.7% Italian712 4.3% American512 3.1% Irish250 1.5% Eastern European197 1.2% Polish189 1.1% Jamaican170 1.0% German134 0.8% African121 0.7% Ghanaian100 0.6% Greek90 0.5% Haitian88 0.5% Nigerian76 0.5% English64 0.4% West Indian63 0.4% Trinidadian and Tobagonian62 0.4% European61 0.4% Russian58 0.3% Hungarian55 0.3% Ukrainian50 0.3% Cypriot47 0.3% Armenian27 0.2% Latvian27 0.2% Israeli27 0.2% Dutch25 0.2% Croatian25 0.2% Barbadian24 0.1% Swiss23 0.1% Slavic22 0.1% Portuguese22 0.1% Scottish22 0.1% Turkish21 0.1% Guyanese15 0.09% Jordanian15 0.09% Arab14 0.08% Czech13 0.08% Northern European12 0.07% Pennsylvania German12 0.07% Belizean12 0.07% French9 0.05% Austrian9 0.05% Canadian9 0.05% Norwegian8 0.05% Brazilian6 0.04% French Canadian
Geographical mobility in Bergenfield Same house 1 year ago 10,939 96.6% White (Caucasian)2,597 98.1% Black or African American232 96.6% American Indian / Alaska Native7,057 91.9% Asian3,071 100.0% Other race3,363 89.3% Two or more races8,626 97.8% White alone, not Hispanic / Latino8,048 93.4% Hispanic or LatinoMoved within same county 218 1.9% White / Caucasian228 3.0% Asian63 1.7% Two or more races56 0.6% White alone, not Hispanic / Latino216 2.5% Hispanic or LatinoMoved within same state 10 0.1% White / Caucasian28 1.1% Black or African American13 0.2% Asian15 0.4% Two or more races12 0.1% White alone, not Hispanic / Latino12 0.1% Hispanic or LatinoMoved from different state 100 0.9% White / Caucasian98 3.7% Black or African American222 2.9% Asian59 1.6% Two or more races111 1.3% White alone, not Hispanic / Latino31 0.4% Hispanic or LatinoMoved from abroad 71 0.6% White93 1.2% Asian338 9.0% Two or more races264 3.1% Hispanic or Latino
Children Nativity (place of birth) in Bergenfield
Children under 6 years - Living with two parents Both parents native 831 100.0% NativeBoth parents foreign-born 335 78.4% Native92 21.6% Foreign-bornOne native, one foreign-born parent 212 100.0% NativeChildren under 6 years - Living with one parent Native parent 311 100.0% NativeForeign-born parent 155 71.3% Native62 28.7% Foreign-bornChildren 6 to 17 years - Living with two parents Both parents native 1,282 99.0% Native13 1.0% Foreign-bornBoth parents foreign-born 953 85.1% Native166 14.9% Foreign-bornOne native, one foreign-born parent 475 100.0% NativeChildren 6 to 17 years - Living with one parent Native parent 175 100.0% NativeForeign-born parent 441 59.4% Native301 40.6% Foreign-born
Grandparents responsible for own grandchildren in Bergenfield
Grandparents (30 to 59 years) White / Caucasian 20 100.0% Not responsible for grandchildrenAsian 51 100.0% Not responsible for grandchildrenTwo or more races 28 100.0% Not responsible for grandchildrenHispanic or Latino 26 100.0% Not responsible for grandchildrenGrandparents (60 years and over) White / Caucasian 153 100.0% Not responsible for grandchildrenAsian 80 33.1% Responsible for grandchildren162 66.9% Not responsible for grandchildrenTwo or more races 145 100.0% Not responsible for grandchildrenHispanic or Latino 45 9.5% Responsible for grandchildren426 90.5% Not responsible for grandchildren