Races in Bardstown, Kentucky (KY) Detailed Stats
Data:
Races - White alone (%)
Races - White alone (% change since 2000)
Races - Black alone (%)
Races - Black alone (% change since 2000)
Races - American Indian alone (%)
Races - American Indian alone (% change since 2000)
Races - Asian alone (%)
Races - Asian alone (% change since 2000)
Races - Hispanic (%)
Races - Hispanic (% change since 2000)
Races - Native Hawaiian and Other Pacific Islander alone (%)
Races - Native Hawaiian and Other Pacific Islander alone (% change since 2000)
Races - Two or more races(%)
Races - Two or more races(% change since 2000)
Races - Other race alone (%)
Races - Other race alone (% change since 2000)
Racial diversity
Place of birth - Born in state of residence (%)
Place of birth - Born in state of residence (%) - White
Place of birth - Born in state of residence (%) - Black or African American
Place of birth - Born in state of residence (%) - Asian
Place of birth - Born in state of residence (%) - Hispanic or Latino
Place of birth - Born in state of residence (%) - American Indian and Alaska Native
Place of birth - Born in state of residence (%) - Multirace
Place of birth - Born in state of residence (%) - Other Race
Place of birth - Born in other state (%)
Place of birth - Born in other state (%) - White
Place of birth - Born in other state (%) - Black or African American
Place of birth - Born in other state (%) - Asian
Place of birth - Born in other state (%) - Hispanic or Latino
Place of birth - Born in other state (%) - American Indian and Alaska Native
Place of birth - Born in other state (%) - Multirace
Place of birth - Born in other state (%) - Other Race
Place of birth - Native, outside of US (%)
Place of birth - Native, outside of US (%) - White
Place of birth - Native, outside of US (%) - Black or African American
Place of birth - Native, outside of US (%) - Asian
Place of birth - Native, outside of US (%) - Hispanic or Latino
Place of birth - Native, outside of US (%) - American Indian and Alaska Native
Place of birth - Native, outside of US (%) - Multirace
Place of birth - Native, outside of US (%) - Other Race
Place of birth - Foreign born (%)
Place of birth - Foreign born (%) - White
Place of birth - Foreign born (%) - Black or African American
Place of birth - Foreign born (%) - Asian
Place of birth - Foreign born (%) - Hispanic or Latino
Place of birth - Foreign born (%) - American Indian and Alaska Native
Place of birth - Foreign born (%) - Multirace
Place of birth - Foreign born (%) - Other Race
Residents speaking English at home (%)
Residents speaking English at home - Born in the United States (%)
Residents speaking English at home - Native, born elsewhere (%)
Residents speaking English at home - Foreign born (%)
Residents speaking Spanish at home (%)
Residents speaking Spanish at home - Born in the United States (%)
Residents speaking Spanish at home - Native, born elsewhere (%)
Residents speaking Spanish at home - Foreign born (%)
Residents speaking other language at home (%)
Residents speaking other language at home - Born in the United States (%)
Residents speaking other language at home - Native, born elsewhere (%)
Residents speaking other language at home - Foreign born (%)
Marital status - Never married (%)
Marital status - Now married (%)
Marital status - Separated (%)
Marital status - Widowed (%)
Marital status - Divorced (%)
Ancestries Reported - Arab (%)
Ancestries Reported - Czech (%)
Ancestries Reported - Danish (%)
Ancestries Reported - Dutch (%)
Ancestries Reported - English (%)
Ancestries Reported - French (%)
Ancestries Reported - French Canadian (%)
Ancestries Reported - German (%)
Ancestries Reported - Greek (%)
Ancestries Reported - Hungarian (%)
Ancestries Reported - Irish (%)
Ancestries Reported - Italian (%)
Ancestries Reported - Lithuanian (%)
Ancestries Reported - Norwegian (%)
Ancestries Reported - Polish (%)
Ancestries Reported - Portuguese (%)
Ancestries Reported - Russian (%)
Ancestries Reported - Scotch-Irish (%)
Ancestries Reported - Scottish (%)
Ancestries Reported - Slovak (%)
Ancestries Reported - Subsaharan African (%)
Ancestries Reported - Swedish (%)
Ancestries Reported - Swiss (%)
Ancestries Reported - Ukrainian (%)
Ancestries Reported - United States (%)
Ancestries Reported - Welsh (%)
Ancestries Reported - West Indian (%)
Ancestries Reported - Other (%)
Geographical mobility - Same house 1 year ago (%)
Geographical mobility - Same house 1 year ago (%) - White
Geographical mobility - Same house 1 year ago (%) - Black or African American
Geographical mobility - Same house 1 year ago (%) - Asian
Geographical mobility - Same house 1 year ago (%) - Hispanic or Latino
Geographical mobility - Same house 1 year ago (%) - American Indian and Alaska Native
Geographical mobility - Same house 1 year ago (%) - Multirace
Geographical mobility - Same house 1 year ago (%) - Other Race
Geographical mobility - Moved within same county (%)
Geographical mobility - Moved within same county (%) - White
Geographical mobility - Moved within same county (%) - Black or African American
Geographical mobility - Moved within same county (%) - Asian
Geographical mobility - Moved within same county (%) - Hispanic or Latino
Geographical mobility - Moved within same county (%) - American Indian and Alaska Native
Geographical mobility - Moved within same county (%) - Multirace
Geographical mobility - Moved within same county (%) - Other Race
Geographical mobility - Moved from different county within same state (%)
Geographical mobility - Moved from different county within same state (%) - White
Geographical mobility - Moved from different county within same state (%) - Black or African American
Geographical mobility - Moved from different county within same state (%) - Asian
Geographical mobility - Moved from different county within same state (%) - Hispanic or Latino
Geographical mobility - Moved from different county within same state (%) - American Indian and Alaska Native
Geographical mobility - Moved from different county within same state (%) - Multirace
Geographical mobility - Moved from different county within same state (%) - Other Race
Geographical mobility - Moved from different state (%)
Geographical mobility - Moved from different state (%) - White
Geographical mobility - Moved from different state (%) - Black or African American
Geographical mobility - Moved from different state (%) - Asian
Geographical mobility - Moved from different state (%) - Hispanic or Latino
Geographical mobility - Moved from different state (%) - American Indian and Alaska Native
Geographical mobility - Moved from different state (%) - Multirace
Geographical mobility - Moved from different state (%) - Other Race
Geographical mobility - Moved from abroad (%)
Geographical mobility - Moved from abroad (%) - White
Geographical mobility - Moved from abroad (%) - Black or African American
Geographical mobility - Moved from abroad (%) - Asian
Geographical mobility - Moved from abroad (%) - Hispanic or Latino
Geographical mobility - Moved from abroad (%) - American Indian and Alaska Native
Geographical mobility - Moved from abroad (%) - Multirace
Geographical mobility - Moved from abroad (%) - Other Race
Place of birth for the foreign-born population - Ireland (%)
Place of birth for the foreign-born population - Denmark (%)
Place of birth for the foreign-born population - Norway (%)
Place of birth for the foreign-born population - Sweden (%)
Place of birth for the foreign-born population - United Kingdom (%)
Place of birth for the foreign-born population - England (%)
Place of birth for the foreign-born population - Scotland (%)
Place of birth for the foreign-born population - Other Northern Europe (%)
Place of birth for the foreign-born population - Austria (%)
Place of birth for the foreign-born population - Belgium (%)
Place of birth for the foreign-born population - France (%)
Place of birth for the foreign-born population - Germany (%)
Place of birth for the foreign-born population - Netherlands (%)
Place of birth for the foreign-born population - Switzerland (%)
Place of birth for the foreign-born population - Other Western Europe (%)
Place of birth for the foreign-born population - Greece (%)
Place of birth for the foreign-born population - Italy (%)
Place of birth for the foreign-born population - Portugal (%)
Place of birth for the foreign-born population - Spain (%)
Place of birth for the foreign-born population - Other Southern Europe (%)
Place of birth for the foreign-born population - Albania (%)
Place of birth for the foreign-born population - Belarus (%)
Place of birth for the foreign-born population - Bosnia and Herzegovina (%)
Place of birth for the foreign-born population - Bulgaria (%)
Place of birth for the foreign-born population - Croatia (%)
Place of birth for the foreign-born population - Czechoslovakia (%)
Place of birth for the foreign-born population - Hungary (%)
Place of birth for the foreign-born population - Latvia (%)
Place of birth for the foreign-born population - Lithuania (%)
Place of birth for the foreign-born population - North Macedonia (Macedonia) (%)
Place of birth for the foreign-born population - Moldova (%)
Place of birth for the foreign-born population - Poland (%)
Place of birth for the foreign-born population - Romania (%)
Place of birth for the foreign-born population - Russia (%)
Place of birth for the foreign-born population - Serbia (%)
Place of birth for the foreign-born population - Ukraine (%)
Place of birth for the foreign-born population - Other Eastern Europe (%)
Place of birth for the foreign-born population - China (%)
Place of birth for the foreign-born population - Hong Kong (%)
Place of birth for the foreign-born population - Taiwan (%)
Place of birth for the foreign-born population - Japan (%)
Place of birth for the foreign-born population - Korea (%)
Place of birth for the foreign-born population - Other Eastern Asia (%)
Place of birth for the foreign-born population - Afghanistan (%)
Place of birth for the foreign-born population - Bangladesh (%)
Place of birth for the foreign-born population - India (%)
Place of birth for the foreign-born population - Iran (%)
Place of birth for the foreign-born population - Kazakhstan (%)
Place of birth for the foreign-born population - Nepal (%)
Place of birth for the foreign-born population - Pakistan (%)
Place of birth for the foreign-born population - Sri Lanka (%)
Place of birth for the foreign-born population - Uzbekistan (%)
Place of birth for the foreign-born population - Other South Central Asia (%)
Place of birth for the foreign-born population - Burma (%)
Place of birth for the foreign-born population - Cambodia (%)
Place of birth for the foreign-born population - Indonesia (%)
Place of birth for the foreign-born population - Laos (%)
Place of birth for the foreign-born population - Malaysia (%)
Place of birth for the foreign-born population - Philippines (%)
Place of birth for the foreign-born population - Singapore (%)
Place of birth for the foreign-born population - Thailand (%)
Place of birth for the foreign-born population - Vietnam (%)
Place of birth for the foreign-born population - Other South Eastern Asia (%)
Place of birth for the foreign-born population - Armenia (%)
Place of birth for the foreign-born population - Iraq (%)
Place of birth for the foreign-born population - Israel (%)
Place of birth for the foreign-born population - Jordan (%)
Place of birth for the foreign-born population - Kuwait (%)
Place of birth for the foreign-born population - Lebanon (%)
Place of birth for the foreign-born population - Saudi Arabia (%)
Place of birth for the foreign-born population - Syria (%)
Place of birth for the foreign-born population - Turkey (%)
Place of birth for the foreign-born population - Yemen (%)
Place of birth for the foreign-born population - Other Western Asia (%)
Place of birth for the foreign-born population - Eritrea (%)
Place of birth for the foreign-born population - Ethiopia (%)
Place of birth for the foreign-born population - Kenya (%)
Place of birth for the foreign-born population - Somalia (%)
Place of birth for the foreign-born population - Uganda (%)
Place of birth for the foreign-born population - Zimbabwe (%)
Place of birth for the foreign-born population - Other Eastern Africa (%)
Place of birth for the foreign-born population - Cameroon (%)
Place of birth for the foreign-born population - Congo (%)
Place of birth for the foreign-born population - Democratic Republic of Congo (Zaire) (%)
Place of birth for the foreign-born population - Other Middle Africa (%)
Place of birth for the foreign-born population - Egypt (%)
Place of birth for the foreign-born population - Morocco (%)
Place of birth for the foreign-born population - Sudan (%)
Place of birth for the foreign-born population - Other Northern Africa (%)
Place of birth for the foreign-born population - South Africa (%)
Place of birth for the foreign-born population - Other Southern Africa (%)
Place of birth for the foreign-born population - Cabo Verde (%)
Place of birth for the foreign-born population - Ghana (%)
Place of birth for the foreign-born population - Liberia (%)
Place of birth for the foreign-born population - Nigeria (%)
Place of birth for the foreign-born population - Senegal (%)
Place of birth for the foreign-born population - Sierra Leone (%)
Place of birth for the foreign-born population - Other Western Africa (%)
Place of birth for the foreign-born population - Australia (%)
Place of birth for the foreign-born population - New Zealand (%)
Place of birth for the foreign-born population - Fiji (%)
Place of birth for the foreign-born population - Micronesia (%)
Place of birth for the foreign-born population - Bahamas (%)
Place of birth for the foreign-born population - Barbados (%)
Place of birth for the foreign-born population - Cuba (%)
Place of birth for the foreign-born population - Dominica (%)
Place of birth for the foreign-born population - Dominican Republic (%)
Place of birth for the foreign-born population - Grenada (%)
Place of birth for the foreign-born population - Haiti (%)
Place of birth for the foreign-born population - Jamaica (%)
Place of birth for the foreign-born population - St. Vincent and the Grenadines (%)
Place of birth for the foreign-born population - Trinidad and Tobago (%)
Place of birth for the foreign-born population - West Indies (%)
Place of birth for the foreign-born population - Other Caribbean (%)
Place of birth for the foreign-born population - Belize (%)
Place of birth for the foreign-born population - Costa Rica (%)
Place of birth for the foreign-born population - El Salvador (%)
Place of birth for the foreign-born population - Guatemala (%)
Place of birth for the foreign-born population - Honduras (%)
Place of birth for the foreign-born population - Mexico (%)
Place of birth for the foreign-born population - Nicaragua (%)
Place of birth for the foreign-born population - Panama (%)
Place of birth for the foreign-born population - Other Central America (%)
Place of birth for the foreign-born population - Argentina (%)
Place of birth for the foreign-born population - Bolivia (%)
Place of birth for the foreign-born population - Brazil (%)
Place of birth for the foreign-born population - Chile (%)
Place of birth for the foreign-born population - Colombia (%)
Place of birth for the foreign-born population - Ecuador (%)
Place of birth for the foreign-born population - Guyana (%)
Place of birth for the foreign-born population - Peru (%)
Place of birth for the foreign-born population - Uruguay (%)
Place of birth for the foreign-born population - Venezuela (%)
Place of birth for the foreign-born population - Other South America (%)
Place of birth for the foreign-born population - Canada (%)
Place of birth for the foreign-born population - Other Northern America (%)
Place of birth for the foreign-born population - Other (%)
Latest news about races in Bardstown, KY collected exclusively by city-data.com from local newspapers, TV, and radio stations
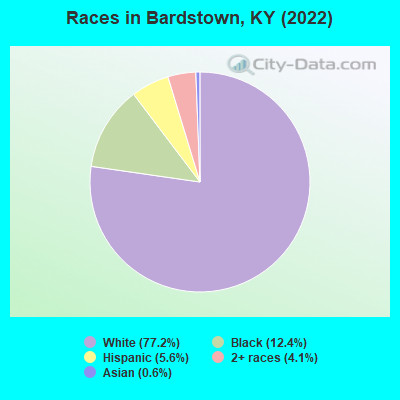
According to 2022 data, the most numerous races in Bardstown, KY are White alone (10,491 residents), Black alone (1,685 residents), and Hispanic (762 residents). 94.9% of Bardstown residents speak English at home. 4.8% of Bardstown, KY residents are foreign-born (1.7% born in Latin America, 1.1% born in Europe, 0.9% born in Africa, 0.9% born in Asia), which is 16.4% greater than the foreign-born rate of 4.0% across the entire state of Kentucky.
Race distribution in Bardstown
2000 2022
3,608,013 89.3% White alone 293,639 7.3% Black alone 59,939 1.5% Hispanic 37,750 0.9% Two or more races 29,368 0.7% Asian alone 7,939 0.2% American Indian alone 3,846 0.10% Other race alone 1,275 0.03% Native Hawaiian and Other
3,710,998 82.2% White alone 343,194 7.6% Black alone 187,483 4.2% Hispanic 187,394 4.2% Two or more races 62,240 1.4% Asian alone 13,529 0.3% Other race alone 4,302 0.10% American Indian alone 3,170 0.07% Native Hawaiian and Other
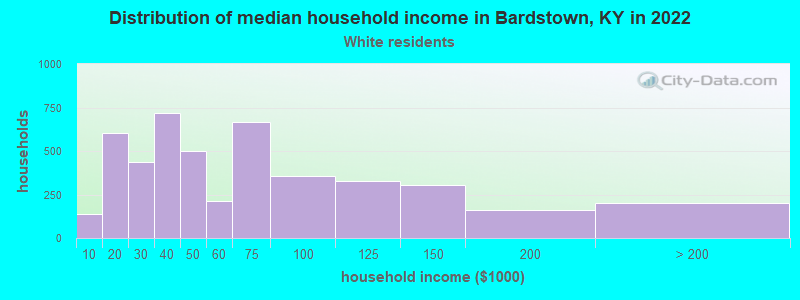
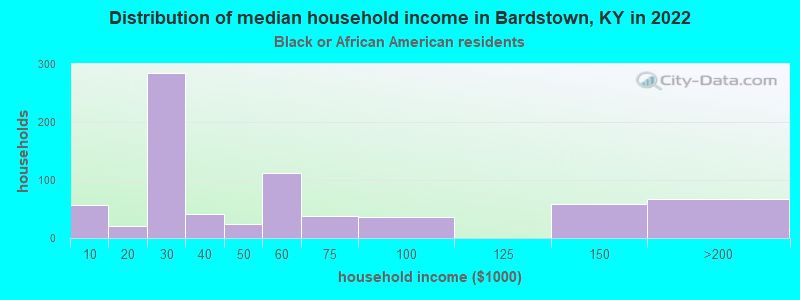
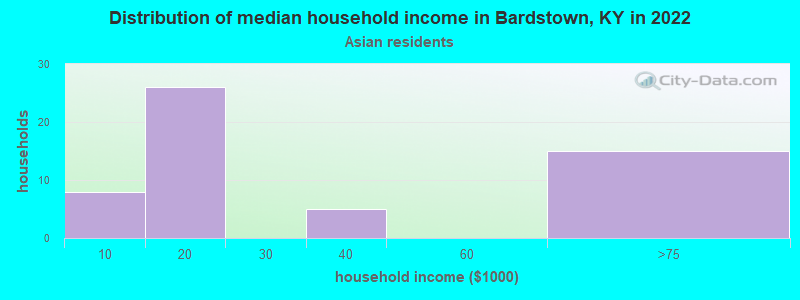
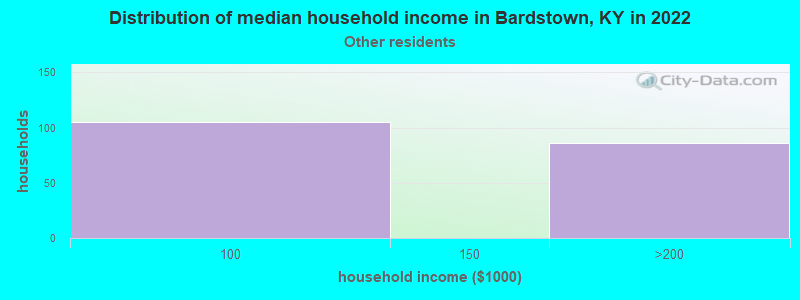
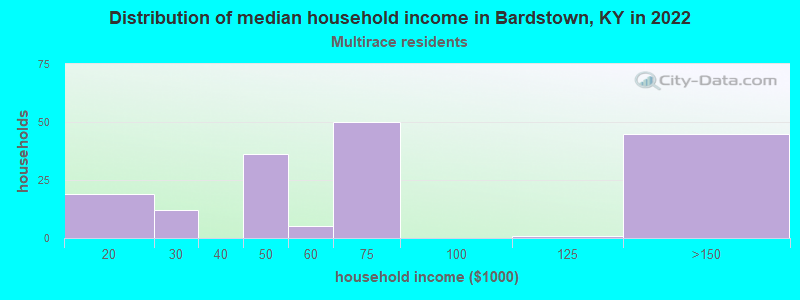
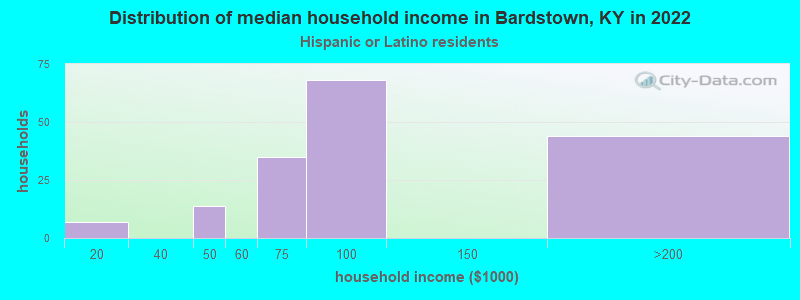
Income and house value in Bardstown Median household income in 2022 $47,243 White non-Hispanic householders$31,538 Black householders$59,520 Two or more races householders$86,916 Hispanic or Latino race householdersMedian 2022 house value $203,702 White Non-Hispanic householders$168,662 Black or African American householders$294,178 American Indian or Alaska Native householders $248,417 Asian householders$169,969 Two or more races householders
Median age by race in Bardstown
39.5 Median age for White residents37.0 40.9 39.5 Median age for Black or African American residents26.3 47.2 -521,556,256.1 Median age for American Indian / Alaska Native residents-607,449,856.1 -630,065,358.8 36.2 Median age for Asian residents34.6 -727,630,284.4 -755,186,721.2 Median age for Native Hawaiian / Pacific Islander residents-724,043,715.1 -853,801,168.7 44.7 Median age for Other race residents49.7 -736,990,154.0 15.1 Median age for Two or more races residents18.5 14.4 39.7 Median age for White alone residents38.7 41.1 19.2 Median age for Hispanic or Latino residents23.9 18.6
Owner/renter occupied households by race in Bardstown
House owners and renters - White residents 2,784 60.3% Owner occupied1,835 39.7% Renter occupiedHouse owners and renters - Black or African American residents 259 35.6% Owner occupied469 64.4% Renter occupiedHouse owners and renters - Asian residents 8 14.5% Owner occupied45 85.5% Renter occupiedHouse owners and renters - Other race residents 64 43.1% Owner occupied84 56.9% Renter occupiedHouse owners and renters - Two or more races residents 101 63.2% Owner occupied59 36.8% Renter occupiedHouse owners and renters - White alone residents 2,770 59.8% Owner occupied1,859 40.2% Renter occupiedHouse owners and renters - Hispanic or Latino residents 74 45.4% Owner occupied89 54.6% Renter occupied
Language usage in Bardstown
English speakers - Total 94.9% of residents of Bardstown speak English at home.
3.1% of residents speak Spanish at home 126 32.6% Speak English very well260 67.4% Speak English less than very well2.0% of residents speak other language at home 80 32.7% Speak English very well165 67.3% Speak English less than very well
English speakers - Born in the United States 97.2% of residents of Bardstown speak English at home.
2.6% of residents speak Spanish at home 67 100.0% Speak English less than very well
English speakers - Native, born elsewhere 44.2% of residents of Bardstown speak English at home.
37.2% of residents speak Spanish at home 16 100.0% Speak English very well25.6% of residents speak other language at home 11 100.0% Speak English less than very well
English speakers - Foreign-born 31.2% of residents of Bardstown speak English at home.
36.1% of residents speak Spanish at home 39 17.3% Speak English very well187 82.7% Speak English less than very well34.0% of residents speak other language at home 63 29.6% Speak English very well150 70.4% Speak English less than very well
White (Caucasian) - Speak only English Native:
98.9% (9,684)Foreign-born:
78.2% (112)
White (Caucasian) - Speak another language Native:
1.1% (110)Foreign-born:
34.5% (50)
Black or African American - Speak only English Native:
100.0% (1,271)Foreign-born:
22.0% (39)
American Indian / Alaska Native - Speak only English Native:
90.3% (8)Foreign-born:
100.0% (11)
Other race - Speak another language Native:
51.7% (71)Foreign-born:
98.6% (103)
White alone - Speak only English Native:
99.5% (9,559)Foreign-born:
85.1% (119)
White alone - Speak another language Native:
0.4% (37)Foreign-born:
20.3% (28)
Hispanic or Latino - Speak only English Native:
69.3% (343)Foreign-born:
4.9% (11)
Hispanic or Latino - Speak another language Native:
31.3% (155)Foreign-born:
95.2% (222)
Foreign-born residents in Bardstown 650 residents are foreign born (1.7% Latin America , 1.1% Europe , 0.9% Africa , 0.9% Asia ).
This city:
4.8%Kentucky:
4.1%
Marital status for residents in Bardstown Marital status - White (Caucasian) population 15 years and over
Males 32.5% Never married46.9% Now married2.0% Separated3.4% Widowed15.2% DivorcedFemales 23.4% Never married46.8% Now married0.9% Separated8.7% Widowed20.3% DivorcedWomen who gave birth in the past 12 months Now married:
49.5% (49)Unmarried:
50.5% (50)
Women who did not give birth in the past 12 months Now married:
51.5% (1,028)Unmarried:
48.5% (967)
Marital status - Black or African American population 15 years and over
Males 48.7% Never married41.7% Now married1.4% Separated0.0% Widowed8.2% DivorcedFemales 37.0% Never married44.7% Now married0.0% Separated4.9% Widowed13.4% DivorcedWomen who gave birth in the past 12 months Now married:
0.0% (0)Unmarried:
100.0% (6)
Women who did not give birth in the past 12 months Now married:
45.7% (228)Unmarried:
54.3% (271)
Marital status - Asian population 15 years and over
Males 1.4% Never married98.6% Now married0.0% Separated0.0% Widowed0.0% DivorcedFemales 56.2% Never married0.0% Now married0.0% Separated43.8% Widowed0.0% DivorcedWomen who did not give birth in the past 12 months Now married:
0.0% (0)Unmarried:
100.0% (8)
Marital status - Other race population 15 years and over
Males 0.0% Never married96.9% Now married0.0% Separated0.0% Widowed3.1% DivorcedFemales 0.0% Never married100.0% Now married0.0% Separated0.0% Widowed0.0% DivorcedWomen who did not give birth in the past 12 months Now married:
100.0% (87)Unmarried:
0.0% (0)
Marital status - Two or more races population 15 years and over
Males 91.1% Never married0.0% Now married0.0% Separated0.0% Widowed8.9% DivorcedFemales 64.2% Never married13.9% Now married0.6% Separated0.0% Widowed21.2% DivorcedWomen who gave birth in the past 12 months Now married:
0.0% (0)Unmarried:
100.0% (24)
Women who did not give birth in the past 12 months Now married:
17.2% (29)Unmarried:
82.8% (138)
Marital status - White alone, not Hispanic / Latino population 15 years and over
Males 32.9% Never married46.0% Now married2.0% Separated3.5% Widowed15.5% DivorcedFemales 23.4% Never married46.9% Now married0.9% Separated8.5% Widowed20.3% DivorcedWomen who gave birth in the past 12 months Now married:
49.5% (49)Unmarried:
50.5% (50)
Women who did not give birth in the past 12 months Now married:
51.5% (1,038)Unmarried:
48.5% (976)
Marital status - Hispanic or Latino population 15 years and over
Males 23.2% Never married75.3% Now married0.0% Separated0.0% Widowed1.5% DivorcedFemales 53.1% Never married40.7% Now married0.0% Separated6.2% Widowed0.0% DivorcedWomen who gave birth in the past 12 months Now married:
0.0% (0)Unmarried:
100.0% (18)
Women who did not give birth in the past 12 months Now married:
48.9% (72)Unmarried:
51.1% (75)
Ancestries in Bardstown
969 16.4% American780 13.2% English732 12.4% German463 7.8% Irish196 3.3% European175 3.0% Scottish128 2.2% African79 1.3% Italian39 0.7% Scandinavian36 0.6% Scotch-Irish24 0.4% Lithuanian17 0.3% Dutch16 0.3% French16 0.3% Polish10 0.2% British5 0.08% French Canadian
Geographical mobility in Bardstown Same house 1 year ago 8,828 83.4% White (Caucasian)1,517 90.2% Black or African American20 91.6% American Indian / Alaska Native50 63.0% Asian246 100.0% Other race675 77.9% Two or more races8,600 83.0% White alone, not Hispanic / Latino679 90.4% Hispanic or LatinoMoved within same county 1,145 10.8% White / Caucasian152 9.0% Black or African American20 24.8% Asian66 7.6% Two or more races1,161 11.2% White alone, not Hispanic / Latino24 3.2% Hispanic or LatinoMoved within same state 418 4.0% White / Caucasian30 1.8% Black or African American10 12.9% Asian59 6.8% Two or more races409 3.9% White alone, not Hispanic / Latino14 1.9% Hispanic or LatinoMoved from different state 45 0.4% White / Caucasian1 0.0% Black or African American5 2.1% Other race12 1.4% Two or more races46 0.4% White alone, not Hispanic / Latino5 0.6% Hispanic or LatinoMoved from abroad 58 0.5% White65 7.5% Two or more races61 0.6% White alone, not Hispanic / Latino36 4.8% Hispanic or Latino
Children Nativity (place of birth) in Bardstown
Children under 6 years - Living with two parents Both parents native 783 100.0% NativeOne native, one foreign-born parent 70 100.0% NativeChildren under 6 years - Living with one parent Native parent 663 100.0% Native
Children 6 to 17 years - Living with two parents Both parents native 1,007 100.0% NativeOne native, one foreign-born parent 153 100.0% NativeChildren 6 to 17 years - Living with one parent Native parent 446 97.3% Native12 2.7% Foreign-born
Grandparents responsible for own grandchildren in Bardstown
Grandparents (30 to 59 years) White / Caucasian 26 30.3% Responsible for grandchildren61 69.7% Not responsible for grandchildrenWhite alone, not Hispanic / Latino 26 30.0% Responsible for grandchildren62 70.0% Not responsible for grandchildrenGrandparents (60 years and over) White / Caucasian 25 68.0% Responsible for grandchildren12 32.0% Not responsible for grandchildrenWhite alone, not Hispanic / Latino 25 67.8% Responsible for grandchildren12 32.2% Not responsible for grandchildren