Races in Austin, Texas (TX) Detailed Stats
Data:
Races - White alone (%)
Races - White alone (% change since 2000)
Races - Black alone (%)
Races - Black alone (% change since 2000)
Races - American Indian alone (%)
Races - American Indian alone (% change since 2000)
Races - Asian alone (%)
Races - Asian alone (% change since 2000)
Races - Hispanic (%)
Races - Hispanic (% change since 2000)
Races - Native Hawaiian and Other Pacific Islander alone (%)
Races - Native Hawaiian and Other Pacific Islander alone (% change since 2000)
Races - Two or more races(%)
Races - Two or more races(% change since 2000)
Races - Other race alone (%)
Races - Other race alone (% change since 2000)
Racial diversity
Place of birth - Born in state of residence (%)
Place of birth - Born in state of residence (%) - White
Place of birth - Born in state of residence (%) - Black or African American
Place of birth - Born in state of residence (%) - Asian
Place of birth - Born in state of residence (%) - Hispanic or Latino
Place of birth - Born in state of residence (%) - American Indian and Alaska Native
Place of birth - Born in state of residence (%) - Multirace
Place of birth - Born in state of residence (%) - Other Race
Place of birth - Born in other state (%)
Place of birth - Born in other state (%) - White
Place of birth - Born in other state (%) - Black or African American
Place of birth - Born in other state (%) - Asian
Place of birth - Born in other state (%) - Hispanic or Latino
Place of birth - Born in other state (%) - American Indian and Alaska Native
Place of birth - Born in other state (%) - Multirace
Place of birth - Born in other state (%) - Other Race
Place of birth - Native, outside of US (%)
Place of birth - Native, outside of US (%) - White
Place of birth - Native, outside of US (%) - Black or African American
Place of birth - Native, outside of US (%) - Asian
Place of birth - Native, outside of US (%) - Hispanic or Latino
Place of birth - Native, outside of US (%) - American Indian and Alaska Native
Place of birth - Native, outside of US (%) - Multirace
Place of birth - Native, outside of US (%) - Other Race
Place of birth - Foreign born (%)
Place of birth - Foreign born (%) - White
Place of birth - Foreign born (%) - Black or African American
Place of birth - Foreign born (%) - Asian
Place of birth - Foreign born (%) - Hispanic or Latino
Place of birth - Foreign born (%) - American Indian and Alaska Native
Place of birth - Foreign born (%) - Multirace
Place of birth - Foreign born (%) - Other Race
Residents speaking English at home (%)
Residents speaking English at home - Born in the United States (%)
Residents speaking English at home - Native, born elsewhere (%)
Residents speaking English at home - Foreign born (%)
Residents speaking Spanish at home (%)
Residents speaking Spanish at home - Born in the United States (%)
Residents speaking Spanish at home - Native, born elsewhere (%)
Residents speaking Spanish at home - Foreign born (%)
Residents speaking other language at home (%)
Residents speaking other language at home - Born in the United States (%)
Residents speaking other language at home - Native, born elsewhere (%)
Residents speaking other language at home - Foreign born (%)
Marital status - Never married (%)
Marital status - Now married (%)
Marital status - Separated (%)
Marital status - Widowed (%)
Marital status - Divorced (%)
Ancestries Reported - Arab (%)
Ancestries Reported - Czech (%)
Ancestries Reported - Danish (%)
Ancestries Reported - Dutch (%)
Ancestries Reported - English (%)
Ancestries Reported - French (%)
Ancestries Reported - French Canadian (%)
Ancestries Reported - German (%)
Ancestries Reported - Greek (%)
Ancestries Reported - Hungarian (%)
Ancestries Reported - Irish (%)
Ancestries Reported - Italian (%)
Ancestries Reported - Lithuanian (%)
Ancestries Reported - Norwegian (%)
Ancestries Reported - Polish (%)
Ancestries Reported - Portuguese (%)
Ancestries Reported - Russian (%)
Ancestries Reported - Scotch-Irish (%)
Ancestries Reported - Scottish (%)
Ancestries Reported - Slovak (%)
Ancestries Reported - Subsaharan African (%)
Ancestries Reported - Swedish (%)
Ancestries Reported - Swiss (%)
Ancestries Reported - Ukrainian (%)
Ancestries Reported - United States (%)
Ancestries Reported - Welsh (%)
Ancestries Reported - West Indian (%)
Ancestries Reported - Other (%)
Geographical mobility - Same house 1 year ago (%)
Geographical mobility - Same house 1 year ago (%) - White
Geographical mobility - Same house 1 year ago (%) - Black or African American
Geographical mobility - Same house 1 year ago (%) - Asian
Geographical mobility - Same house 1 year ago (%) - Hispanic or Latino
Geographical mobility - Same house 1 year ago (%) - American Indian and Alaska Native
Geographical mobility - Same house 1 year ago (%) - Multirace
Geographical mobility - Same house 1 year ago (%) - Other Race
Geographical mobility - Moved within same county (%)
Geographical mobility - Moved within same county (%) - White
Geographical mobility - Moved within same county (%) - Black or African American
Geographical mobility - Moved within same county (%) - Asian
Geographical mobility - Moved within same county (%) - Hispanic or Latino
Geographical mobility - Moved within same county (%) - American Indian and Alaska Native
Geographical mobility - Moved within same county (%) - Multirace
Geographical mobility - Moved within same county (%) - Other Race
Geographical mobility - Moved from different county within same state (%)
Geographical mobility - Moved from different county within same state (%) - White
Geographical mobility - Moved from different county within same state (%) - Black or African American
Geographical mobility - Moved from different county within same state (%) - Asian
Geographical mobility - Moved from different county within same state (%) - Hispanic or Latino
Geographical mobility - Moved from different county within same state (%) - American Indian and Alaska Native
Geographical mobility - Moved from different county within same state (%) - Multirace
Geographical mobility - Moved from different county within same state (%) - Other Race
Geographical mobility - Moved from different state (%)
Geographical mobility - Moved from different state (%) - White
Geographical mobility - Moved from different state (%) - Black or African American
Geographical mobility - Moved from different state (%) - Asian
Geographical mobility - Moved from different state (%) - Hispanic or Latino
Geographical mobility - Moved from different state (%) - American Indian and Alaska Native
Geographical mobility - Moved from different state (%) - Multirace
Geographical mobility - Moved from different state (%) - Other Race
Geographical mobility - Moved from abroad (%)
Geographical mobility - Moved from abroad (%) - White
Geographical mobility - Moved from abroad (%) - Black or African American
Geographical mobility - Moved from abroad (%) - Asian
Geographical mobility - Moved from abroad (%) - Hispanic or Latino
Geographical mobility - Moved from abroad (%) - American Indian and Alaska Native
Geographical mobility - Moved from abroad (%) - Multirace
Geographical mobility - Moved from abroad (%) - Other Race
Place of birth for the foreign-born population - Ireland (%)
Place of birth for the foreign-born population - Denmark (%)
Place of birth for the foreign-born population - Norway (%)
Place of birth for the foreign-born population - Sweden (%)
Place of birth for the foreign-born population - United Kingdom (%)
Place of birth for the foreign-born population - England (%)
Place of birth for the foreign-born population - Scotland (%)
Place of birth for the foreign-born population - Other Northern Europe (%)
Place of birth for the foreign-born population - Austria (%)
Place of birth for the foreign-born population - Belgium (%)
Place of birth for the foreign-born population - France (%)
Place of birth for the foreign-born population - Germany (%)
Place of birth for the foreign-born population - Netherlands (%)
Place of birth for the foreign-born population - Switzerland (%)
Place of birth for the foreign-born population - Other Western Europe (%)
Place of birth for the foreign-born population - Greece (%)
Place of birth for the foreign-born population - Italy (%)
Place of birth for the foreign-born population - Portugal (%)
Place of birth for the foreign-born population - Spain (%)
Place of birth for the foreign-born population - Other Southern Europe (%)
Place of birth for the foreign-born population - Albania (%)
Place of birth for the foreign-born population - Belarus (%)
Place of birth for the foreign-born population - Bosnia and Herzegovina (%)
Place of birth for the foreign-born population - Bulgaria (%)
Place of birth for the foreign-born population - Croatia (%)
Place of birth for the foreign-born population - Czechoslovakia (%)
Place of birth for the foreign-born population - Hungary (%)
Place of birth for the foreign-born population - Latvia (%)
Place of birth for the foreign-born population - Lithuania (%)
Place of birth for the foreign-born population - North Macedonia (Macedonia) (%)
Place of birth for the foreign-born population - Moldova (%)
Place of birth for the foreign-born population - Poland (%)
Place of birth for the foreign-born population - Romania (%)
Place of birth for the foreign-born population - Russia (%)
Place of birth for the foreign-born population - Serbia (%)
Place of birth for the foreign-born population - Ukraine (%)
Place of birth for the foreign-born population - Other Eastern Europe (%)
Place of birth for the foreign-born population - China (%)
Place of birth for the foreign-born population - Hong Kong (%)
Place of birth for the foreign-born population - Taiwan (%)
Place of birth for the foreign-born population - Japan (%)
Place of birth for the foreign-born population - Korea (%)
Place of birth for the foreign-born population - Other Eastern Asia (%)
Place of birth for the foreign-born population - Afghanistan (%)
Place of birth for the foreign-born population - Bangladesh (%)
Place of birth for the foreign-born population - India (%)
Place of birth for the foreign-born population - Iran (%)
Place of birth for the foreign-born population - Kazakhstan (%)
Place of birth for the foreign-born population - Nepal (%)
Place of birth for the foreign-born population - Pakistan (%)
Place of birth for the foreign-born population - Sri Lanka (%)
Place of birth for the foreign-born population - Uzbekistan (%)
Place of birth for the foreign-born population - Other South Central Asia (%)
Place of birth for the foreign-born population - Burma (%)
Place of birth for the foreign-born population - Cambodia (%)
Place of birth for the foreign-born population - Indonesia (%)
Place of birth for the foreign-born population - Laos (%)
Place of birth for the foreign-born population - Malaysia (%)
Place of birth for the foreign-born population - Philippines (%)
Place of birth for the foreign-born population - Singapore (%)
Place of birth for the foreign-born population - Thailand (%)
Place of birth for the foreign-born population - Vietnam (%)
Place of birth for the foreign-born population - Other South Eastern Asia (%)
Place of birth for the foreign-born population - Armenia (%)
Place of birth for the foreign-born population - Iraq (%)
Place of birth for the foreign-born population - Israel (%)
Place of birth for the foreign-born population - Jordan (%)
Place of birth for the foreign-born population - Kuwait (%)
Place of birth for the foreign-born population - Lebanon (%)
Place of birth for the foreign-born population - Saudi Arabia (%)
Place of birth for the foreign-born population - Syria (%)
Place of birth for the foreign-born population - Turkey (%)
Place of birth for the foreign-born population - Yemen (%)
Place of birth for the foreign-born population - Other Western Asia (%)
Place of birth for the foreign-born population - Eritrea (%)
Place of birth for the foreign-born population - Ethiopia (%)
Place of birth for the foreign-born population - Kenya (%)
Place of birth for the foreign-born population - Somalia (%)
Place of birth for the foreign-born population - Uganda (%)
Place of birth for the foreign-born population - Zimbabwe (%)
Place of birth for the foreign-born population - Other Eastern Africa (%)
Place of birth for the foreign-born population - Cameroon (%)
Place of birth for the foreign-born population - Congo (%)
Place of birth for the foreign-born population - Democratic Republic of Congo (Zaire) (%)
Place of birth for the foreign-born population - Other Middle Africa (%)
Place of birth for the foreign-born population - Egypt (%)
Place of birth for the foreign-born population - Morocco (%)
Place of birth for the foreign-born population - Sudan (%)
Place of birth for the foreign-born population - Other Northern Africa (%)
Place of birth for the foreign-born population - South Africa (%)
Place of birth for the foreign-born population - Other Southern Africa (%)
Place of birth for the foreign-born population - Cabo Verde (%)
Place of birth for the foreign-born population - Ghana (%)
Place of birth for the foreign-born population - Liberia (%)
Place of birth for the foreign-born population - Nigeria (%)
Place of birth for the foreign-born population - Senegal (%)
Place of birth for the foreign-born population - Sierra Leone (%)
Place of birth for the foreign-born population - Other Western Africa (%)
Place of birth for the foreign-born population - Australia (%)
Place of birth for the foreign-born population - New Zealand (%)
Place of birth for the foreign-born population - Fiji (%)
Place of birth for the foreign-born population - Micronesia (%)
Place of birth for the foreign-born population - Bahamas (%)
Place of birth for the foreign-born population - Barbados (%)
Place of birth for the foreign-born population - Cuba (%)
Place of birth for the foreign-born population - Dominica (%)
Place of birth for the foreign-born population - Dominican Republic (%)
Place of birth for the foreign-born population - Grenada (%)
Place of birth for the foreign-born population - Haiti (%)
Place of birth for the foreign-born population - Jamaica (%)
Place of birth for the foreign-born population - St. Vincent and the Grenadines (%)
Place of birth for the foreign-born population - Trinidad and Tobago (%)
Place of birth for the foreign-born population - West Indies (%)
Place of birth for the foreign-born population - Other Caribbean (%)
Place of birth for the foreign-born population - Belize (%)
Place of birth for the foreign-born population - Costa Rica (%)
Place of birth for the foreign-born population - El Salvador (%)
Place of birth for the foreign-born population - Guatemala (%)
Place of birth for the foreign-born population - Honduras (%)
Place of birth for the foreign-born population - Mexico (%)
Place of birth for the foreign-born population - Nicaragua (%)
Place of birth for the foreign-born population - Panama (%)
Place of birth for the foreign-born population - Other Central America (%)
Place of birth for the foreign-born population - Argentina (%)
Place of birth for the foreign-born population - Bolivia (%)
Place of birth for the foreign-born population - Brazil (%)
Place of birth for the foreign-born population - Chile (%)
Place of birth for the foreign-born population - Colombia (%)
Place of birth for the foreign-born population - Ecuador (%)
Place of birth for the foreign-born population - Guyana (%)
Place of birth for the foreign-born population - Peru (%)
Place of birth for the foreign-born population - Uruguay (%)
Place of birth for the foreign-born population - Venezuela (%)
Place of birth for the foreign-born population - Other South America (%)
Place of birth for the foreign-born population - Canada (%)
Place of birth for the foreign-born population - Other Northern America (%)
Place of birth for the foreign-born population - Other (%)
Latest news about races in Austin, TX collected exclusively by city-data.com from local newspapers, TV, and radio stations
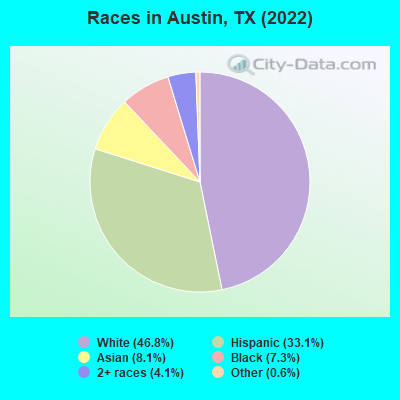
According to 2022 data, the most numerous races in Austin, TX are Hispanic (322,776 residents), White alone (455,984 residents), and Black alone (71,006 residents). 70.4% of Austin residents speak English at home. 18.4% of Austin, TX residents are foreign-born (9.0% born in Latin America, 6.3% born in Asia), which is 7.8% greater than the foreign-born rate of 17.0% across the entire state of Texas.
Race distribution in Austin
2000 2022
347,554 52.9% White alone 200,579 30.5% Hispanic 64,259 9.8% Black alone 30,580 4.7% Asian alone 10,158 1.5% Two or more races 1,854 0.3% American Indian alone 1,243 0.2% Other race alone 335 0.05% Native Hawaiian and Other
455,984 46.8% White alone 322,776 33.1% Hispanic 78,744 8.1% Asian alone 71,006 7.3% Black alone 39,775 4.1% Two or more races 5,678 0.6% Other race alone 843 0.09% American Indian alone 529 0.05% Native Hawaiian and Other
2000 2022
10,933,313 52.4% White alone 6,669,666 32.0% Hispanic 2,364,255 11.3% Black alone 554,445 2.7% Asian alone 230,567 1.1% Two or more races 68,859 0.3% American Indian alone 19,958 0.10% Other race alone 10,757 0.05% Native Hawaiian and Other
12,070,642 40.2% Hispanic 11,683,430 38.9% White alone 3,508,706 11.7% Black alone 1,608,173 5.4% Asian alone 956,560 3.2% Two or more races 125,763 0.4% Other race alone 47,023 0.2% American Indian alone 29,275 0.10% Native Hawaiian and Other
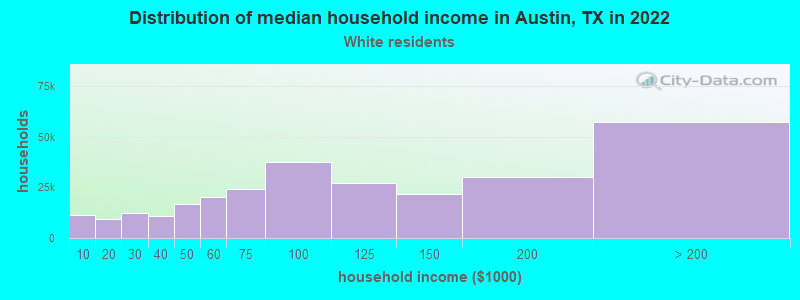
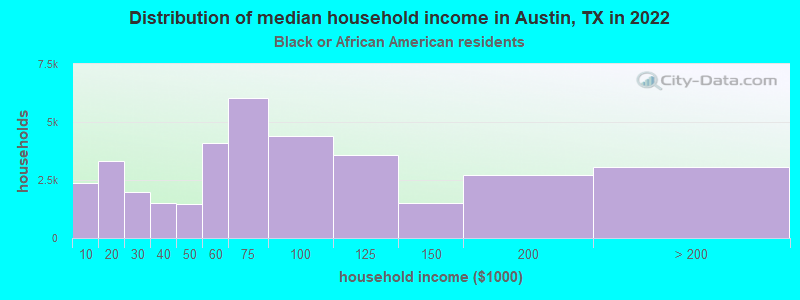
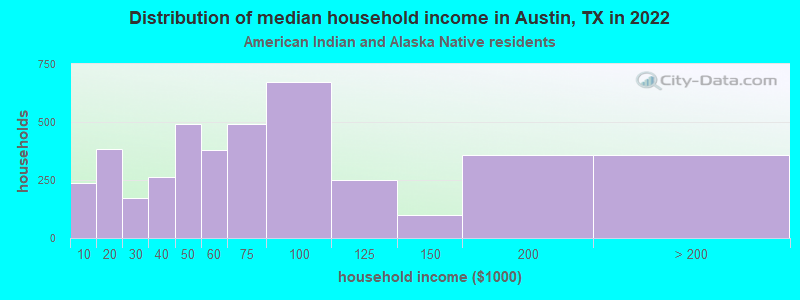
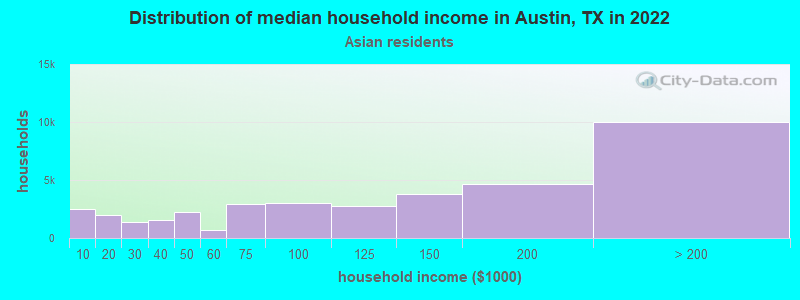
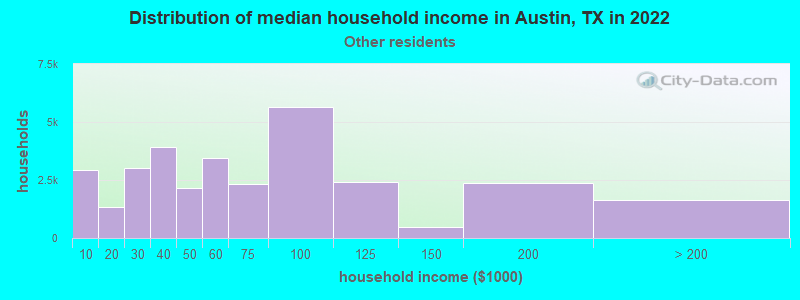
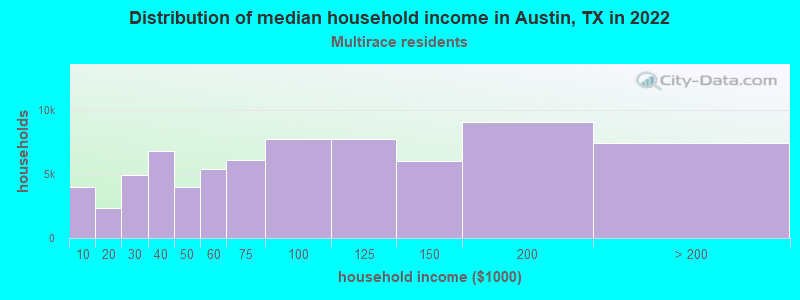
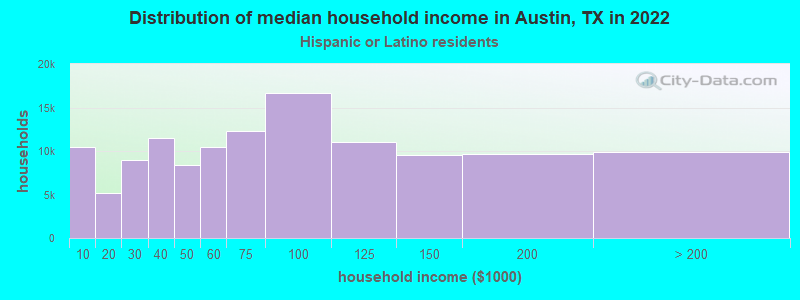
Income and house value in Austin Median household income in 2022 $101,445 White non-Hispanic householders$68,636 Black householders$70,619 American Indian and Alaska Native householders$119,661 Asian householders$57,160 Some other race householders$81,489 Two or more races householders$66,207 Hispanic or Latino race householdersMedian 2022 house value $713,269 White Non-Hispanic householders$405,969 Black or African American householders$499,239 American Indian or Alaska Native householders $804,084 Asian householders$389,278 Native Hawaiian and other Pacific Islander householders$400,569 Some other race householders$515,438 Two or more races householders$426,586 Hispanic or Latino householders
Median age by race in Austin
36.7 Median age for White residents37.1 36.4 35.7 Median age for Black or African American residents35.5 36.1 38.0 Median age for American Indian / Alaska Native residents36.7 40.1 32.8 Median age for Asian residents32.4 33.7 44.5 Median age for Native Hawaiian / Pacific Islander residents-666,666,666.0 44.8 30.4 Median age for Other race residents29.9 30.7 30.8 Median age for Two or more races residents31.3 30.2 37.7 Median age for White alone residents37.8 37.4 30.8 Median age for Hispanic or Latino residents31.4 30.4
Owner/renter occupied households by race in Austin
House owners and renters - White residents 133,842 48.0% Owner occupied145,040 52.0% Renter occupiedHouse owners and renters - Black or African American residents 11,188 31.0% Owner occupied24,914 69.0% Renter occupiedHouse owners and renters - American Indian / Alaska Native residents 739 28.6% Owner occupied1,849 71.4% Renter occupiedHouse owners and renters - Asian residents 16,128 43.0% Owner occupied21,364 57.0% Renter occupiedHouse owners and renters - Native Hawaiian / Pacific Islander residents 37 20.5% Owner occupied144 79.5% Renter occupiedHouse owners and renters - Other race residents 10,623 33.5% Owner occupied21,069 66.5% Renter occupiedHouse owners and renters - Two or more races residents 30,176 42.1% Owner occupied41,515 57.9% Renter occupiedHouse owners and renters - White alone residents 123,004 50.5% Owner occupied120,483 49.5% Renter occupiedHouse owners and renters - Hispanic or Latino residents 44,348 35.7% Owner occupied79,748 64.3% Renter occupied
Language usage in Austin
English speakers - Total 70.4% of residents of Austin speak English at home.
20.5% of residents speak Spanish at home 114,545 60.4% Speak English very well74,968 39.6% Speak English less than very well9.1% of residents speak other language at home 64,000 75.9% Speak English very well20,321 24.1% Speak English less than very well
English speakers - Born in the United States 90.6% of residents of Austin speak English at home.
6.0% of residents speak Spanish at home 15,699 85.4% Speak English very well2,676 14.6% Speak English less than very well3.4% of residents speak other language at home 9,791 95.0% Speak English very well514 5.0% Speak English less than very well
English speakers - Native, born elsewhere 66.8% of residents of Austin speak English at home.
21.2% of residents speak Spanish at home 3,082 66.1% Speak English very well1,579 33.9% Speak English less than very well12.1% of residents speak other language at home 2,246 84.6% Speak English very well409 15.4% Speak English less than very well
English speakers - Foreign-born 15.3% of residents of Austin speak English at home.
48.3% of residents speak Spanish at home 28,638 34.7% Speak English very well53,777 65.3% Speak English less than very well36.4% of residents speak other language at home 44,324 71.4% Speak English very well17,752 28.6% Speak English less than very well
White (Caucasian) - Speak only English Native:
92.8% (446,725)Foreign-born:
28.2% (8,615)
White (Caucasian) - Speak another language Native:
7.2% (34,410)Foreign-born:
71.8% (21,938)
Black or African American - Speak only English Native:
93.8% (57,371)Foreign-born:
25.7% (2,774)
Black or African American - Speak another language Native:
6.2% (3,778)Foreign-born:
74.3% (8,017)
American Indian / Alaska Native - Speak only English Native:
65.1% (2,783)Foreign-born:
9.5% (214)
American Indian / Alaska Native - Speak another language Native:
34.9% (1,491)Foreign-born:
90.5% (2,028)
Asian - Speak only English Native:
50.9% (14,735)Foreign-born:
17.3% (8,493)
Asian - Speak another language Native:
49.1% (14,229)Foreign-born:
82.7% (40,495)
Native Hawaiian / Pacific Islander - Speak only English Native:
78.0% (440)Foreign-born:
26.4% (13)
Native Hawaiian / Pacific Islander - Speak another language Native:
21.9% (123)Foreign-born:
57.3% (29)
Other race - Speak only English Native:
47.2% (24,014)Foreign-born:
6.6% (2,242)
Other race - Speak another language Native:
52.8% (26,845)Foreign-born:
93.4% (31,870)
Two or more races - Speak only English Native:
62.0% (79,268)Foreign-born:
8.4% (3,680)
Two or more races - Speak another language Native:
38.0% (48,590)Foreign-born:
91.6% (40,143)
White alone - Speak only English Native:
97.0% (405,686)Foreign-born:
40.3% (8,499)
White alone - Speak another language Native:
3.0% (12,619)Foreign-born:
59.7% (12,567)
Hispanic or Latino - Speak only English Native:
54.1% (116,500)Foreign-born:
5.8% (4,988)
Hispanic or Latino - Speak another language Native:
45.9% (98,959)Foreign-born:
94.2% (81,006)
Foreign-born residents in Austin 181,712 residents are foreign born (9.0% Latin America , 6.3% Asia ).
This city:
18.4%Texas:
17.1%
Marital status for residents in Austin Marital status - White (Caucasian) population 15 years and over
Males 46.9% Never married42.2% Now married0.6% Separated1.4% Widowed8.9% DivorcedFemales 39.9% Never married41.3% Now married1.0% Separated5.0% Widowed12.8% DivorcedWomen who gave birth in the past 12 months Now married:
81.6% (4,457)Unmarried:
18.4% (1,008)
Women who did not give birth in the past 12 months Now married:
35.7% (54,484)Unmarried:
64.3% (98,302)
Marital status - Black or African American population 15 years and over
Males 59.5% Never married30.7% Now married0.8% Separated1.2% Widowed7.8% DivorcedFemales 46.2% Never married26.2% Now married3.8% Separated6.7% Widowed17.1% DivorcedWomen who gave birth in the past 12 months Now married:
64.0% (293)Unmarried:
36.0% (165)
Women who did not give birth in the past 12 months Now married:
25.9% (5,638)Unmarried:
74.1% (16,163)
Marital status - American Indian / Alaska Native population 15 years and over
Males 56.2% Never married29.6% Now married2.3% Separated4.5% Widowed7.4% DivorcedFemales 39.6% Never married38.6% Now married3.3% Separated4.1% Widowed14.5% DivorcedWomen who gave birth in the past 12 months Now married:
96.7% (297)Unmarried:
3.3% (10)
Women who did not give birth in the past 12 months Now married:
36.4% (879)Unmarried:
63.6% (1,534)
Marital status - Asian population 15 years and over
Males 39.6% Never married55.2% Now married1.0% Separated1.2% Widowed3.0% DivorcedFemales 32.3% Never married58.9% Now married0.9% Separated3.3% Widowed4.5% DivorcedWomen who gave birth in the past 12 months Now married:
100.0% (1,261)Unmarried:
0.0% (0)
Women who did not give birth in the past 12 months Now married:
53.0% (13,381)Unmarried:
47.0% (11,846)
Marital status - Native Hawaiian / Pacific Islander population 15 years and over
Males 44.1% Never married41.4% Now married0.0% Separated0.0% Widowed14.5% DivorcedFemales 44.3% Never married27.0% Now married0.0% Separated0.0% Widowed28.7% DivorcedWomen who did not give birth in the past 12 months Now married:
15.0% (39)Unmarried:
85.0% (219)
Marital status - Other race population 15 years and over
Males 53.7% Never married38.5% Now married4.1% Separated0.3% Widowed3.3% DivorcedFemales 46.7% Never married40.7% Now married0.3% Separated3.6% Widowed8.8% DivorcedWomen who gave birth in the past 12 months Now married:
87.0% (721)Unmarried:
13.0% (108)
Women who did not give birth in the past 12 months Now married:
37.2% (9,716)Unmarried:
62.8% (16,420)
Marital status - Two or more races population 15 years and over
Males 50.9% Never married39.4% Now married1.5% Separated1.3% Widowed6.9% DivorcedFemales 43.0% Never married38.3% Now married2.4% Separated4.7% Widowed11.5% DivorcedWomen who gave birth in the past 12 months Now married:
48.4% (1,317)Unmarried:
51.6% (1,406)
Women who did not give birth in the past 12 months Now married:
37.8% (17,405)Unmarried:
62.2% (28,607)
Marital status - White alone, not Hispanic / Latino population 15 years and over
Males 45.5% Never married42.9% Now married0.6% Separated1.6% Widowed9.5% DivorcedFemales 38.0% Never married42.9% Now married0.7% Separated5.3% Widowed13.1% DivorcedWomen who gave birth in the past 12 months Now married:
89.3% (3,718)Unmarried:
10.7% (444)
Women who did not give birth in the past 12 months Now married:
37.7% (48,128)Unmarried:
62.3% (79,424)
Marital status - Hispanic or Latino population 15 years and over
Males 53.0% Never married38.7% Now married2.2% Separated0.8% Widowed5.3% DivorcedFemales 46.3% Never married37.9% Now married2.1% Separated4.0% Widowed9.7% DivorcedWomen who gave birth in the past 12 months Now married:
55.3% (2,675)Unmarried:
44.7% (2,166)
Women who did not give birth in the past 12 months Now married:
34.2% (30,726)Unmarried:
65.8% (59,045)
Ancestries in Austin
32,540 6.5% English27,086 5.4% German19,444 3.9% Irish18,195 3.6% American15,878 3.1% European7,569 1.5% Italian5,429 1.1% Scottish4,313 0.9% African4,015 0.8% Scotch-Irish3,589 0.7% French3,427 0.7% Polish3,171 0.6% Nigerian3,124 0.6% Afghan2,563 0.5% Norwegian2,342 0.5% Swedish2,308 0.5% British2,256 0.4% Russian2,010 0.4% Eastern European1,947 0.4% Czech1,435 0.3% Lebanese1,294 0.3% Iranian1,272 0.3% Northern European1,265 0.3% Dutch1,251 0.2% Greek1,215 0.2% Ukrainian1,205 0.2% Turkish1,140 0.2% Ethiopian1,088 0.2% Brazilian921 0.2% Jamaican873 0.2% French Canadian785 0.2% Welsh781 0.2% Portuguese771 0.2% Hungarian676 0.1% Syrian673 0.1% Scandinavian653 0.1% Romanian621 0.1% Iraqi611 0.1% Arab459 0.09% Swiss449 0.09% Danish443 0.09% Cajun404 0.08% Austrian371 0.07% Belgian360 0.07% Canadian339 0.07% Serbian292 0.06% Jordanian287 0.06% Czechoslovakian276 0.05% Finnish257 0.05% South African257 0.05% Ghanaian257 0.05% Slovene250 0.05% Lithuanian234 0.05% Egyptian215 0.04% Belizean211 0.04% Haitian190 0.04% Yugoslavian180 0.04% Australian178 0.04% Israeli160 0.03% Kenyan156 0.03% Armenian155 0.03% Croatian154 0.03% Slovak151 0.03% Sudanese150 0.03% Albanian134 0.03% Moroccan115 0.02% Palestinian94 0.02% Trinidadian and Tobagonian84 0.02% Alsatian79 0.02% Barbadian75 0.01% West Indian69 0.01% Ugandan67 0.01% Latvian58 0.01% Slavic46 0.01% New Zealander40 0.01% Dutch West Indian39 0.01% Pennsylvania German38 0.01% Macedonian36 0.01% Bulgarian27 0.01% Basque
Geographical mobility in Austin Same house 1 year ago 423,642 80.2% White (Caucasian)61,584 83.0% Black or African American5,409 82.2% American Indian / Alaska Native58,246 72.0% Asian393 64.5% Native Hawaiian / Pacific Islander64,898 72.9% Other race152,656 81.5% Two or more races364,698 80.5% White alone, not Hispanic / Latino250,903 78.8% Hispanic or LatinoMoved within same county 53,696 10.2% White / Caucasian6,002 8.1% Black or African American371 5.6% American Indian / Alaska Native10,288 12.7% Asian15 2.5% Native Hawaiian / Pacific Islander13,912 15.6% Other race18,853 10.1% Two or more races44,476 9.8% White alone, not Hispanic / Latino38,486 12.1% Hispanic or LatinoMoved within same state 24,538 4.6% White / Caucasian3,567 4.8% Black or African American394 6.0% American Indian / Alaska Native4,809 5.9% Asian115 18.9% Native Hawaiian / Pacific Islander3,514 3.9% Other race9,298 5.0% Two or more races20,899 4.6% White alone, not Hispanic / Latino15,550 4.9% Hispanic or LatinoMoved from different state 22,505 4.3% White / Caucasian1,806 2.4% Black or African American267 4.1% American Indian / Alaska Native5,089 6.3% Asian79 13.0% Native Hawaiian / Pacific Islander3,183 3.6% Other race5,409 2.9% Two or more races19,932 4.4% White alone, not Hispanic / Latino9,559 3.0% Hispanic or LatinoMoved from abroad 3,604 0.7% White1,194 1.6% Black or African American136 2.1% American Indian / Alaska Native2,471 3.1% Asian32 5.3% Native Hawaiian / Pacific Islander3,516 3.9% Other race1,040 0.6% Two or more races3,009 0.7% White alone, not Hispanic / Latino3,809 1.2% Hispanic or Latino
Children Nativity (place of birth) in Austin
Children under 6 years - Living with two parents Both parents native 28,744 98.6% Native412 1.4% Foreign-bornBoth parents foreign-born 6,793 76.5% Native2,084 23.5% Foreign-bornOne native, one foreign-born parent 6,421 100.0% NativeChildren under 6 years - Living with one parent Native parent 10,540 100.0% NativeForeign-born parent 1,542 83.4% Native308 16.6% Foreign-bornChildren 6 to 17 years - Living with two parents Both parents native 38,089 98.4% Native604 1.6% Foreign-bornBoth parents foreign-born 13,817 57.2% Native10,332 42.8% Foreign-bornOne native, one foreign-born parent 8,348 97.7% Native200 2.3% Foreign-bornChildren 6 to 17 years - Living with one parent Native parent 22,009 100.0% NativeForeign-born parent 7,257 60.8% Native4,687 39.2% Foreign-born
Place of birth for residents in Austin 92,447 Americas89,082 Latin America74,749 Central America62,268 Asia27,653 South Central Asia15,912 Eastern Asia15,097 Europe12,977 South Eastern Asia10,991 Africa10,503 China8,174 South America6,158 Caribbean5,670 Western Asia4,987 Eastern Europe4,464 Northern Europe4,312 Western Africa3,973 Western Europe3,365 Northern America2,959 Eastern Africa2,152 Northern Africa1,660 Southern Europe906 Oceania871 Australia and New Zealand Subregion494 Middle Africa474 Southern Africa56,242 Mexico20,528 India7,409 China6,836 Honduras6,235 Vietnam5,311 Guatemala4,766 Cuba4,345 Korea4,165 El Salvador3,365 Canada3,321 Philippines2,641 Venezuela2,378 United Kingdom2,323 Nigeria2,322 Taiwan1,873 Germany1,681 Afghanistan1,665 Colombia1,473 Brazil1,456 Pakistan1,429 Iraq1,412 Nepal1,260 Iran1,250 France1,166 Ethiopia1,102 England1,094 Russia1,032 Thailand992 Japan983 Spain971 Turkey891 Nicaragua875 Ukraine801 Peru773 Syria771 Hong Kong739 Lebanon678 Malaysia673 Australia641 Kenya625 Ghana582 Burma (Myanmar)567 Romania521 Chile461 Saudi Arabia455 Trinidad and Tobago454 Bangladesh453 Hungary447 Morocco445 Costa Rica435 Ecuador425 Poland416 Ireland406 Indonesia402 Dominican Republic361 Cambodia360 United Arab Emirates347 Togo341 Kazakhstan340 Italy335 Greece328 Argentina327 Jordan326 Israel321 Sri Lanka312 Panama311 Switzerland304 Sudan302 South Africa298 Singapore293 Serbia289 Belize281 Algeria275 Netherlands274 Uganda257 Czechoslovakia235 Ivory Coast230 Jamaica217 Egypt214 Scotland200 Eritrea200 Bosnia and Herzegovina197 New Zealand188 Lithuania186 Sweden172 Bolivia164 Democratic Republic of Congo (Zaire)162 Cameroon161 Kuwait161 Senegal158 Belgium140 Haiti125 Liberia117 Congo115 Tanzania111 Belarus96 Yemen94 Uruguay92 Croatia90 Austria89 Sierra Leone87 Norway78 Bulgaria77 Albania75 Moldova70 Bhutan66 Dominica60 Laos51 Uzbekistan42 Zimbabwe24 West Indies24 Barbados22 Denmark19 Bahamas18 North Macedonia (Macedonia)17 Marshall Islands17 Latvia13 St. Lucia8 Micronesia1 Azerbaijan
Grandparents responsible for own grandchildren in Austin
Grandparents (30 to 59 years) White / Caucasian 177 22.8% Responsible for grandchildren601 77.2% Not responsible for grandchildrenBlack or African American 362 51.9% Responsible for grandchildren336 48.1% Not responsible for grandchildrenAmerican Indian / Alaska Native 34 100.0% Not responsible for grandchildrenAsian 29 19.6% Responsible for grandchildren120 80.4% Not responsible for grandchildrenOther race 426 33.3% Responsible for grandchildren855 66.7% Not responsible for grandchildrenTwo or more races 253 32.9% Responsible for grandchildren518 67.1% Not responsible for grandchildrenWhite alone, not Hispanic / Latino 103 22.3% Responsible for grandchildren358 77.7% Not responsible for grandchildrenHispanic or Latino 200 11.9% Responsible for grandchildren1,482 88.1% Not responsible for grandchildrenGrandparents (60 years and over) White / Caucasian 502 18.0% Responsible for grandchildren2,286 82.0% Not responsible for grandchildrenBlack or African American 485 52.5% Responsible for grandchildren439 47.5% Not responsible for grandchildrenAmerican Indian / Alaska Native 9 100.0% Responsible for grandchildrenAsian 50 5.5% Responsible for grandchildren864 94.5% Not responsible for grandchildrenOther race 609 39.3% Responsible for grandchildren941 60.7% Not responsible for grandchildrenTwo or more races 244 26.1% Responsible for grandchildren690 73.9% Not responsible for grandchildrenWhite alone, not Hispanic / Latino 502 24.3% Responsible for grandchildren1,567 75.7% Not responsible for grandchildrenHispanic or Latino 1,707 39.1% Responsible for grandchildren2,662 60.9% Not responsible for grandchildren
Zip codes: 78610 , 78613 , 78617 , 78641 , 78652 , 78653 , 78660 , 78664 , 78681 , 78701 , 78702 , 78703 , 78704 , 78705 , 78712 , 78717 , 78719 , 78721 , 78722 , 78723 , 78724 , 78725 , 78726 , 78727 , 78728 , 78729 , 78730 , 78731 , 78732 , 78733 , 78734 , 78735 , 78736 , 78737 , 78738 , 78739 , 78741 , 78742 , 78744 , 78745 , 78746 , 78747 , 78748 , 78749 , 78750 , 78751 , 78752 , 78753 , 78754 , 78756 , 78757 , 78758 , 78759 .