Races in Aransas Pass, Texas (TX) Detailed Stats
Data:
Races - White alone (%)
Races - White alone (% change since 2000)
Races - Black alone (%)
Races - Black alone (% change since 2000)
Races - American Indian alone (%)
Races - American Indian alone (% change since 2000)
Races - Asian alone (%)
Races - Asian alone (% change since 2000)
Races - Hispanic (%)
Races - Hispanic (% change since 2000)
Races - Native Hawaiian and Other Pacific Islander alone (%)
Races - Native Hawaiian and Other Pacific Islander alone (% change since 2000)
Races - Two or more races(%)
Races - Two or more races(% change since 2000)
Races - Other race alone (%)
Races - Other race alone (% change since 2000)
Racial diversity
Place of birth - Born in state of residence (%)
Place of birth - Born in state of residence (%) - White
Place of birth - Born in state of residence (%) - Black or African American
Place of birth - Born in state of residence (%) - Asian
Place of birth - Born in state of residence (%) - Hispanic or Latino
Place of birth - Born in state of residence (%) - American Indian and Alaska Native
Place of birth - Born in state of residence (%) - Multirace
Place of birth - Born in state of residence (%) - Other Race
Place of birth - Born in other state (%)
Place of birth - Born in other state (%) - White
Place of birth - Born in other state (%) - Black or African American
Place of birth - Born in other state (%) - Asian
Place of birth - Born in other state (%) - Hispanic or Latino
Place of birth - Born in other state (%) - American Indian and Alaska Native
Place of birth - Born in other state (%) - Multirace
Place of birth - Born in other state (%) - Other Race
Place of birth - Native, outside of US (%)
Place of birth - Native, outside of US (%) - White
Place of birth - Native, outside of US (%) - Black or African American
Place of birth - Native, outside of US (%) - Asian
Place of birth - Native, outside of US (%) - Hispanic or Latino
Place of birth - Native, outside of US (%) - American Indian and Alaska Native
Place of birth - Native, outside of US (%) - Multirace
Place of birth - Native, outside of US (%) - Other Race
Place of birth - Foreign born (%)
Place of birth - Foreign born (%) - White
Place of birth - Foreign born (%) - Black or African American
Place of birth - Foreign born (%) - Asian
Place of birth - Foreign born (%) - Hispanic or Latino
Place of birth - Foreign born (%) - American Indian and Alaska Native
Place of birth - Foreign born (%) - Multirace
Place of birth - Foreign born (%) - Other Race
Residents speaking English at home (%)
Residents speaking English at home - Born in the United States (%)
Residents speaking English at home - Native, born elsewhere (%)
Residents speaking English at home - Foreign born (%)
Residents speaking Spanish at home (%)
Residents speaking Spanish at home - Born in the United States (%)
Residents speaking Spanish at home - Native, born elsewhere (%)
Residents speaking Spanish at home - Foreign born (%)
Residents speaking other language at home (%)
Residents speaking other language at home - Born in the United States (%)
Residents speaking other language at home - Native, born elsewhere (%)
Residents speaking other language at home - Foreign born (%)
Marital status - Never married (%)
Marital status - Now married (%)
Marital status - Separated (%)
Marital status - Widowed (%)
Marital status - Divorced (%)
Ancestries Reported - Arab (%)
Ancestries Reported - Czech (%)
Ancestries Reported - Danish (%)
Ancestries Reported - Dutch (%)
Ancestries Reported - English (%)
Ancestries Reported - French (%)
Ancestries Reported - French Canadian (%)
Ancestries Reported - German (%)
Ancestries Reported - Greek (%)
Ancestries Reported - Hungarian (%)
Ancestries Reported - Irish (%)
Ancestries Reported - Italian (%)
Ancestries Reported - Lithuanian (%)
Ancestries Reported - Norwegian (%)
Ancestries Reported - Polish (%)
Ancestries Reported - Portuguese (%)
Ancestries Reported - Russian (%)
Ancestries Reported - Scotch-Irish (%)
Ancestries Reported - Scottish (%)
Ancestries Reported - Slovak (%)
Ancestries Reported - Subsaharan African (%)
Ancestries Reported - Swedish (%)
Ancestries Reported - Swiss (%)
Ancestries Reported - Ukrainian (%)
Ancestries Reported - United States (%)
Ancestries Reported - Welsh (%)
Ancestries Reported - West Indian (%)
Ancestries Reported - Other (%)
Geographical mobility - Same house 1 year ago (%)
Geographical mobility - Same house 1 year ago (%) - White
Geographical mobility - Same house 1 year ago (%) - Black or African American
Geographical mobility - Same house 1 year ago (%) - Asian
Geographical mobility - Same house 1 year ago (%) - Hispanic or Latino
Geographical mobility - Same house 1 year ago (%) - American Indian and Alaska Native
Geographical mobility - Same house 1 year ago (%) - Multirace
Geographical mobility - Same house 1 year ago (%) - Other Race
Geographical mobility - Moved within same county (%)
Geographical mobility - Moved within same county (%) - White
Geographical mobility - Moved within same county (%) - Black or African American
Geographical mobility - Moved within same county (%) - Asian
Geographical mobility - Moved within same county (%) - Hispanic or Latino
Geographical mobility - Moved within same county (%) - American Indian and Alaska Native
Geographical mobility - Moved within same county (%) - Multirace
Geographical mobility - Moved within same county (%) - Other Race
Geographical mobility - Moved from different county within same state (%)
Geographical mobility - Moved from different county within same state (%) - White
Geographical mobility - Moved from different county within same state (%) - Black or African American
Geographical mobility - Moved from different county within same state (%) - Asian
Geographical mobility - Moved from different county within same state (%) - Hispanic or Latino
Geographical mobility - Moved from different county within same state (%) - American Indian and Alaska Native
Geographical mobility - Moved from different county within same state (%) - Multirace
Geographical mobility - Moved from different county within same state (%) - Other Race
Geographical mobility - Moved from different state (%)
Geographical mobility - Moved from different state (%) - White
Geographical mobility - Moved from different state (%) - Black or African American
Geographical mobility - Moved from different state (%) - Asian
Geographical mobility - Moved from different state (%) - Hispanic or Latino
Geographical mobility - Moved from different state (%) - American Indian and Alaska Native
Geographical mobility - Moved from different state (%) - Multirace
Geographical mobility - Moved from different state (%) - Other Race
Geographical mobility - Moved from abroad (%)
Geographical mobility - Moved from abroad (%) - White
Geographical mobility - Moved from abroad (%) - Black or African American
Geographical mobility - Moved from abroad (%) - Asian
Geographical mobility - Moved from abroad (%) - Hispanic or Latino
Geographical mobility - Moved from abroad (%) - American Indian and Alaska Native
Geographical mobility - Moved from abroad (%) - Multirace
Geographical mobility - Moved from abroad (%) - Other Race
Place of birth for the foreign-born population - Ireland (%)
Place of birth for the foreign-born population - Denmark (%)
Place of birth for the foreign-born population - Norway (%)
Place of birth for the foreign-born population - Sweden (%)
Place of birth for the foreign-born population - United Kingdom (%)
Place of birth for the foreign-born population - England (%)
Place of birth for the foreign-born population - Scotland (%)
Place of birth for the foreign-born population - Other Northern Europe (%)
Place of birth for the foreign-born population - Austria (%)
Place of birth for the foreign-born population - Belgium (%)
Place of birth for the foreign-born population - France (%)
Place of birth for the foreign-born population - Germany (%)
Place of birth for the foreign-born population - Netherlands (%)
Place of birth for the foreign-born population - Switzerland (%)
Place of birth for the foreign-born population - Other Western Europe (%)
Place of birth for the foreign-born population - Greece (%)
Place of birth for the foreign-born population - Italy (%)
Place of birth for the foreign-born population - Portugal (%)
Place of birth for the foreign-born population - Spain (%)
Place of birth for the foreign-born population - Other Southern Europe (%)
Place of birth for the foreign-born population - Albania (%)
Place of birth for the foreign-born population - Belarus (%)
Place of birth for the foreign-born population - Bosnia and Herzegovina (%)
Place of birth for the foreign-born population - Bulgaria (%)
Place of birth for the foreign-born population - Croatia (%)
Place of birth for the foreign-born population - Czechoslovakia (%)
Place of birth for the foreign-born population - Hungary (%)
Place of birth for the foreign-born population - Latvia (%)
Place of birth for the foreign-born population - Lithuania (%)
Place of birth for the foreign-born population - North Macedonia (Macedonia) (%)
Place of birth for the foreign-born population - Moldova (%)
Place of birth for the foreign-born population - Poland (%)
Place of birth for the foreign-born population - Romania (%)
Place of birth for the foreign-born population - Russia (%)
Place of birth for the foreign-born population - Serbia (%)
Place of birth for the foreign-born population - Ukraine (%)
Place of birth for the foreign-born population - Other Eastern Europe (%)
Place of birth for the foreign-born population - China (%)
Place of birth for the foreign-born population - Hong Kong (%)
Place of birth for the foreign-born population - Taiwan (%)
Place of birth for the foreign-born population - Japan (%)
Place of birth for the foreign-born population - Korea (%)
Place of birth for the foreign-born population - Other Eastern Asia (%)
Place of birth for the foreign-born population - Afghanistan (%)
Place of birth for the foreign-born population - Bangladesh (%)
Place of birth for the foreign-born population - India (%)
Place of birth for the foreign-born population - Iran (%)
Place of birth for the foreign-born population - Kazakhstan (%)
Place of birth for the foreign-born population - Nepal (%)
Place of birth for the foreign-born population - Pakistan (%)
Place of birth for the foreign-born population - Sri Lanka (%)
Place of birth for the foreign-born population - Uzbekistan (%)
Place of birth for the foreign-born population - Other South Central Asia (%)
Place of birth for the foreign-born population - Burma (%)
Place of birth for the foreign-born population - Cambodia (%)
Place of birth for the foreign-born population - Indonesia (%)
Place of birth for the foreign-born population - Laos (%)
Place of birth for the foreign-born population - Malaysia (%)
Place of birth for the foreign-born population - Philippines (%)
Place of birth for the foreign-born population - Singapore (%)
Place of birth for the foreign-born population - Thailand (%)
Place of birth for the foreign-born population - Vietnam (%)
Place of birth for the foreign-born population - Other South Eastern Asia (%)
Place of birth for the foreign-born population - Armenia (%)
Place of birth for the foreign-born population - Iraq (%)
Place of birth for the foreign-born population - Israel (%)
Place of birth for the foreign-born population - Jordan (%)
Place of birth for the foreign-born population - Kuwait (%)
Place of birth for the foreign-born population - Lebanon (%)
Place of birth for the foreign-born population - Saudi Arabia (%)
Place of birth for the foreign-born population - Syria (%)
Place of birth for the foreign-born population - Turkey (%)
Place of birth for the foreign-born population - Yemen (%)
Place of birth for the foreign-born population - Other Western Asia (%)
Place of birth for the foreign-born population - Eritrea (%)
Place of birth for the foreign-born population - Ethiopia (%)
Place of birth for the foreign-born population - Kenya (%)
Place of birth for the foreign-born population - Somalia (%)
Place of birth for the foreign-born population - Uganda (%)
Place of birth for the foreign-born population - Zimbabwe (%)
Place of birth for the foreign-born population - Other Eastern Africa (%)
Place of birth for the foreign-born population - Cameroon (%)
Place of birth for the foreign-born population - Congo (%)
Place of birth for the foreign-born population - Democratic Republic of Congo (Zaire) (%)
Place of birth for the foreign-born population - Other Middle Africa (%)
Place of birth for the foreign-born population - Egypt (%)
Place of birth for the foreign-born population - Morocco (%)
Place of birth for the foreign-born population - Sudan (%)
Place of birth for the foreign-born population - Other Northern Africa (%)
Place of birth for the foreign-born population - South Africa (%)
Place of birth for the foreign-born population - Other Southern Africa (%)
Place of birth for the foreign-born population - Cabo Verde (%)
Place of birth for the foreign-born population - Ghana (%)
Place of birth for the foreign-born population - Liberia (%)
Place of birth for the foreign-born population - Nigeria (%)
Place of birth for the foreign-born population - Senegal (%)
Place of birth for the foreign-born population - Sierra Leone (%)
Place of birth for the foreign-born population - Other Western Africa (%)
Place of birth for the foreign-born population - Australia (%)
Place of birth for the foreign-born population - New Zealand (%)
Place of birth for the foreign-born population - Fiji (%)
Place of birth for the foreign-born population - Micronesia (%)
Place of birth for the foreign-born population - Bahamas (%)
Place of birth for the foreign-born population - Barbados (%)
Place of birth for the foreign-born population - Cuba (%)
Place of birth for the foreign-born population - Dominica (%)
Place of birth for the foreign-born population - Dominican Republic (%)
Place of birth for the foreign-born population - Grenada (%)
Place of birth for the foreign-born population - Haiti (%)
Place of birth for the foreign-born population - Jamaica (%)
Place of birth for the foreign-born population - St. Vincent and the Grenadines (%)
Place of birth for the foreign-born population - Trinidad and Tobago (%)
Place of birth for the foreign-born population - West Indies (%)
Place of birth for the foreign-born population - Other Caribbean (%)
Place of birth for the foreign-born population - Belize (%)
Place of birth for the foreign-born population - Costa Rica (%)
Place of birth for the foreign-born population - El Salvador (%)
Place of birth for the foreign-born population - Guatemala (%)
Place of birth for the foreign-born population - Honduras (%)
Place of birth for the foreign-born population - Mexico (%)
Place of birth for the foreign-born population - Nicaragua (%)
Place of birth for the foreign-born population - Panama (%)
Place of birth for the foreign-born population - Other Central America (%)
Place of birth for the foreign-born population - Argentina (%)
Place of birth for the foreign-born population - Bolivia (%)
Place of birth for the foreign-born population - Brazil (%)
Place of birth for the foreign-born population - Chile (%)
Place of birth for the foreign-born population - Colombia (%)
Place of birth for the foreign-born population - Ecuador (%)
Place of birth for the foreign-born population - Guyana (%)
Place of birth for the foreign-born population - Peru (%)
Place of birth for the foreign-born population - Uruguay (%)
Place of birth for the foreign-born population - Venezuela (%)
Place of birth for the foreign-born population - Other South America (%)
Place of birth for the foreign-born population - Canada (%)
Place of birth for the foreign-born population - Other Northern America (%)
Place of birth for the foreign-born population - Other (%)
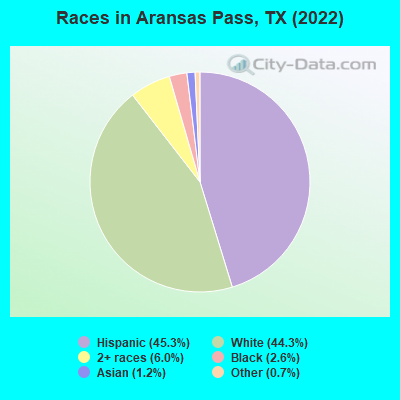
According to 2022 data, the most numerous races in Aransas Pass, TX are Hispanic (4,011 residents), White alone (3,919 residents), and Black alone (228 residents). 75.3% of Aransas Pass residents speak English at home. 8.8% of Aransas Pass, TX residents are foreign-born (6.2% born in Latin America, 2.1% born in Asia), which is 93.6% less than the foreign-born rate of 17.0% across the entire state of Texas.
Race distribution in Aransas Pass
2000 2022
10,933,313 52.4% White alone 6,669,666 32.0% Hispanic 2,364,255 11.3% Black alone 554,445 2.7% Asian alone 230,567 1.1% Two or more races 68,859 0.3% American Indian alone 19,958 0.10% Other race alone 10,757 0.05% Native Hawaiian and Other
12,070,642 40.2% Hispanic 11,683,430 38.9% White alone 3,508,706 11.7% Black alone 1,608,173 5.4% Asian alone 956,560 3.2% Two or more races 125,763 0.4% Other race alone 47,023 0.2% American Indian alone 29,275 0.10% Native Hawaiian and Other
Income and house value in Aransas Pass Median household income in 2022 $50,436 White non-Hispanic householders$14,167 Asian householders$100,707 Some other race householders$66,101 Two or more races householders$81,194 Hispanic or Latino race householdersMedian 2022 house value $265,738 White Non-Hispanic householders$143,766 Black or African American householders$165,562 Some other race householders$52,393 Two or more races householders$163,466 Hispanic or Latino householders
Median age by race in Aransas Pass
44.2 Median age for White residents45.3 41.4 42.3 Median age for Black or African American residents24.5 87.6 25.9 Median age for American Indian / Alaska Native residents-666,666,666.0 58.8 75.2 Median age for Asian residents67.9 72.1 -581,560,283.1 Median age for Native Hawaiian / Pacific Islander residents-612,729,233.5 -577,777,777.2 23.5 Median age for Other race residents22.0 42.4 45.8 Median age for Two or more races residents45.8 50.1 51.5 Median age for White alone residents49.5 53.2 35.7 Median age for Hispanic or Latino residents39.9 29.9
Owner/renter occupied households by race in Aransas Pass
House owners and renters - White residents 1,299 67.6% Owner occupied623 32.4% Renter occupiedHouse owners and renters - Black or African American residents 145 100.0% Owner occupiedHouse owners and renters - American Indian / Alaska Native residents 40 100.0% Owner occupiedHouse owners and renters - Asian residents 55 100.0% Owner occupiedHouse owners and renters - Other race residents 277 91.8% Owner occupied25 8.2% Renter occupiedHouse owners and renters - Two or more races residents 530 62.0% Owner occupied325 38.0% Renter occupiedHouse owners and renters - White alone residents 1,428 75.2% Owner occupied472 24.8% Renter occupiedHouse owners and renters - Hispanic or Latino residents 616 50.5% Owner occupied604 49.5% Renter occupied
Language usage in Aransas Pass
English speakers - Total 75.3% of residents of Aransas Pass speak English at home.
22.2% of residents speak Spanish at home 1,512 80.7% Speak English very well362 19.3% Speak English less than very well2.4% of residents speak other language at home 91 45.5% Speak English very well109 54.5% Speak English less than very well
English speakers - Born in the United States 93.3% of residents of Aransas Pass speak English at home.
5.9% of residents speak Spanish at home 77 63.6% Speak English very well44 36.4% Speak English less than very well0.4% of residents speak other language at home 9 100.0% Speak English very well
English speakers - Native, born elsewhere 78.3% of residents of Aransas Pass speak English at home.
19.7% of residents speak Spanish at home 39 100.0% Speak English less than very well
English speakers - Foreign-born 15.4% of residents of Aransas Pass speak English at home.
59.6% of residents speak Spanish at home 271 58.5% Speak English very well192 41.5% Speak English less than very well24.5% of residents speak other language at home 83 43.7% Speak English very well107 56.3% Speak English less than very well
White (Caucasian) - Speak only English Native:
100.0% (3,615)Foreign-born:
19.5% (25)
White (Caucasian) - Speak another language Native:
13.5% (489)Foreign-born:
78.4% (100)
Asian - Speak only English Native:
100.0% (16)Foreign-born:
7.2% (14)
Other race - Speak only English Native:
72.1% (665)Foreign-born:
32.8% (48)
Other race - Speak another language Native:
22.1% (203)Foreign-born:
12.1% (18)
Two or more races - Speak only English Native:
70.5% (1,385)Foreign-born:
12.8% (62)
Two or more races - Speak another language Native:
31.7% (623)Foreign-born:
69.5% (336)
White alone - Speak only English Native:
99.3% (3,606)Foreign-born:
75.2% (23)
White alone - Speak another language Native:
0.8% (30)Foreign-born:
25.0% (8)
Hispanic or Latino - Speak only English Native:
63.6% (2,005)Foreign-born:
6.5% (46)
Hispanic or Latino - Speak another language Native:
37.4% (1,180)Foreign-born:
73.3% (512)
Foreign-born residents in Aransas Pass 777 residents are foreign born (6.2% Latin America , 2.1% Asia ).
This city:
8.8%Texas:
17.1%
Marital status for residents in Aransas Pass Marital status - White (Caucasian) population 15 years and over
Males 21.2% Never married47.6% Now married8.2% Separated2.7% Widowed20.4% DivorcedFemales 28.3% Never married50.4% Now married2.2% Separated10.2% Widowed8.9% DivorcedWomen who gave birth in the past 12 months Now married:
74.2% (14)Unmarried:
25.8% (5)
Women who did not give birth in the past 12 months Now married:
40.5% (304)Unmarried:
59.5% (446)
Marital status - Black or African American population 15 years and over
Males 97.7% Never married2.3% Now married0.0% Separated0.0% Widowed0.0% DivorcedFemales 38.4% Never married35.8% Now married0.6% Separated23.3% Widowed1.9% DivorcedWomen who did not give birth in the past 12 months Now married:
48.7% (58)Unmarried:
51.3% (61)
Marital status - American Indian / Alaska Native population 15 years and over
Males 0.0% Never married2.9% Now married97.1% Separated0.0% Widowed0.0% DivorcedFemales 26.2% Never married11.9% Now married0.0% Separated0.0% Widowed61.9% DivorcedWomen who did not give birth in the past 12 months Now married:
0.0% (0)Unmarried:
100.0% (16)
Marital status - Asian population 15 years and over
Males 38.1% Never married4.8% Now married0.0% Separated0.0% Widowed57.1% DivorcedFemales 0.0% Never married57.2% Now married0.0% Separated0.0% Widowed42.8% DivorcedWomen who did not give birth in the past 12 months Now married:
74.1% (43)Unmarried:
25.9% (15)
Marital status - Other race population 15 years and over
Males 36.7% Never married43.4% Now married13.8% Separated0.0% Widowed6.1% DivorcedFemales 32.7% Never married53.3% Now married5.5% Separated8.5% Widowed0.0% DivorcedWomen who did not give birth in the past 12 months Now married:
57.8% (102)Unmarried:
42.2% (74)
Marital status - Two or more races population 15 years and over
Males 40.6% Never married51.6% Now married0.0% Separated0.0% Widowed7.8% DivorcedFemales 15.9% Never married40.4% Now married0.0% Separated12.3% Widowed31.4% DivorcedWomen who did not give birth in the past 12 months Now married:
51.9% (156)Unmarried:
48.1% (145)
Marital status - White alone, not Hispanic / Latino population 15 years and over
Males 12.5% Never married61.7% Now married1.6% Separated4.4% Widowed19.8% DivorcedFemales 16.1% Never married58.3% Now married1.3% Separated13.6% Widowed10.6% DivorcedWomen who gave birth in the past 12 months Now married:
100.0% (25)Unmarried:
0.0% (0)
Women who did not give birth in the past 12 months Now married:
47.7% (290)Unmarried:
52.3% (318)
Marital status - Hispanic or Latino population 15 years and over
Males 36.0% Never married32.0% Now married15.4% Separated0.0% Widowed16.6% DivorcedFemales 39.3% Never married36.5% Now married3.1% Separated6.3% Widowed14.8% DivorcedWomen who gave birth in the past 12 months Now married:
0.0% (0)Unmarried:
100.0% (8)
Women who did not give birth in the past 12 months Now married:
41.0% (354)Unmarried:
59.0% (509)
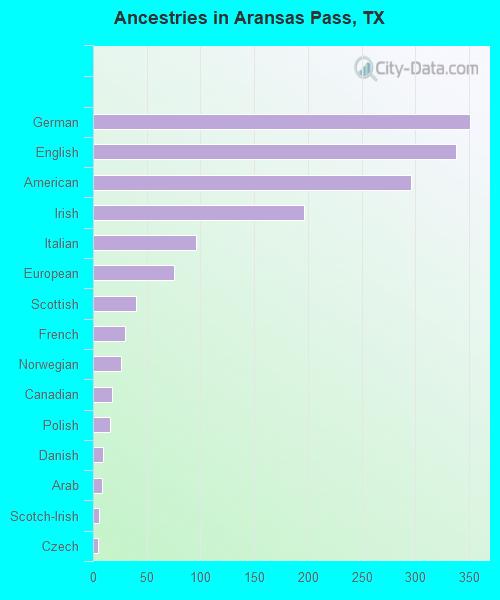
Ancestries in Aransas Pass
351 7.1% German338 6.8% English296 6.0% American196 4.0% Irish96 1.9% Italian75 1.5% European40 0.8% Scottish30 0.6% French26 0.5% Norwegian18 0.4% Canadian16 0.3% Polish9 0.2% Danish8 0.2% Arab6 0.1% Scotch-Irish5 0.1% Czech1 0.02% Croatian
Children Nativity (place of birth) in Aransas Pass
Children under 6 years - Living with two parents Both parents native 305 100.0% NativeOne native, one foreign-born parent 74 100.0% NativeChildren under 6 years - Living with one parent Native parent 211 100.0% NativeChildren 6 to 17 years - Living with two parents Both parents native 886 100.0% NativeOne native, one foreign-born parent 117 100.0% NativeChildren 6 to 17 years - Living with one parent Native parent 229 100.0% NativeForeign-born parent 48 50.5% Native48 49.5% Foreign-born
Grandparents responsible for own grandchildren in Aransas Pass
Grandparents (30 to 59 years) White / Caucasian 63 94.8% Responsible for grandchildren4 5.2% Not responsible for grandchildrenAsian 32 100.0% Responsible for grandchildrenWhite alone, not Hispanic / Latino 37 100.0% Responsible for grandchildrenHispanic or Latino 53 90.8% Responsible for grandchildren5 9.2% Not responsible for grandchildrenGrandparents (60 years and over) White / Caucasian 36 54.8% Responsible for grandchildren30 45.2% Not responsible for grandchildrenWhite alone, not Hispanic / Latino 37 63.5% Responsible for grandchildren21 36.5% Not responsible for grandchildrenHispanic or Latino 7 19.4% Responsible for grandchildren30 80.6% Not responsible for grandchildren