Honolulu, Hawaii (HI) Poverty Rate Data
Information about poor and low-income residents

Recent posts about poverty in Honolulu, Hawaii on our local forum with over 2,400,000 registered users:
 | Honolulu mayor signs expanded plastic bag ban bill for oahu (36 replies) |
| Salaries and Cost of Living for Honolulu (9 replies) |
| Strict Regulation, High Taxes: How Would A Casino Work In Hawaii? (21 replies) |
| Thrift Shops, Dollar Stores, Growing food & Getting By on Oahu (28 replies) |
| How much money do I need to match 74K? (36 replies) |
| Living Expenses in Honolulu? (12 replies) |
Latest news about poverty in Honolulu, HI collected exclusively by city-data.com from local newspapers, TV, and radio stations
11.5% of Honolulu, HI residents had an income below the poverty level in 2022, which was 11.9% greater than the poverty level of 10.2% across the entire state of Hawaii. Taking into account residents not living in families, 21.7% of high school graduates and 41.7% of non high school graduates live in poverty. The poverty rate was 14.7% among disabled males and 16.3% among disabled females. The renting rate among poor residents was 84.5%. For comparison, it was 48.8% among residents with income above the poverty level.
Poverty rates in Honolulu, HI
Residents with income below the poverty level in 2022:
Residents with income below 50% of the poverty level in 2022:
Poverty rate among disabled males:
Poverty rate among disabled females:
Renting rate in this place among poor and not poor residents:
| Honolulu: | 11.5% |
| Whole state: | 10.2% |
| Honolulu: | 5.8% |
| Whole state: | 5.4% |
Poverty rate among disabled males:
| Honolulu: | 14.7% |
| Hawaii: | 13.3% |
Disability rate in this place among poor males (it is 20.1% among male residents who are not classified as poor):
| Honolulu: | 27.4% |
| Hawaii: | 25.7% |
Poverty rate among disabled females:
| Honolulu: | 16.3% |
| Hawaii: | 15.3% |
Disability rate in this place among poor females (it is 18.5% among female residents who are not classified as poor):
| Honolulu: | 26.2% |
| Hawaii: | 24.3% |
Renting rate in this place among poor and not poor residents:
| Residents below poverty level: | 84.5% |
| Residents above poverty level: | 48.8% |
Poverty by age in Honolulu, HI
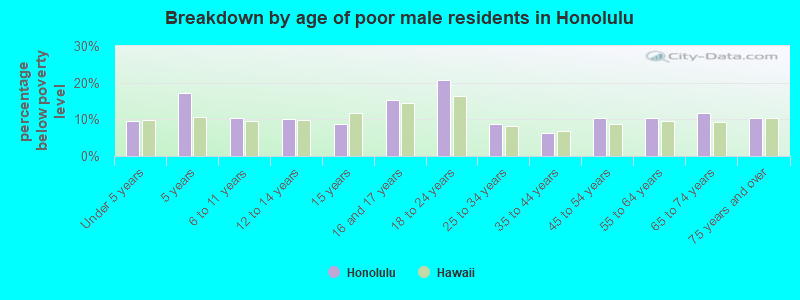
- Breakdown by age of poor male residents in Honolulu,HI (percentage below poverty level)
- 13.3%Under 5 years
- 11.2%5 years
- 15.5%6 to 11 years
- 16.2%12 to 14 years
- 12.9%15 years
- 12.3%16 and 17 years
- 17.9%18 to 24 years
- 7.9%25 to 34 years
- 9.2%35 to 44 years
- 10.7%45 to 54 years
- 12.7%55 to 64 years
- 9.6%65 to 74 years
- 6.4%75 years and over
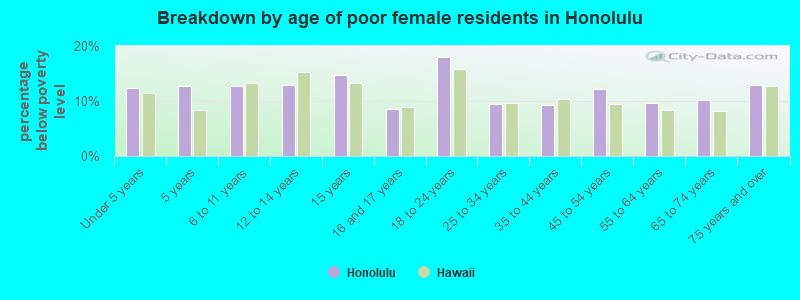
- Breakdown by age of poor female residents in Honolulu,HI (percentage below poverty level)
- 16.0%Under 5 years
- 12.2%5 years
- 12.8%6 to 11 years
- 11.6%12 to 14 years
- 12.0%15 years
- 15.4%16 and 17 years
- 21.7%18 to 24 years
- 13.0%25 to 34 years
- 11.8%35 to 44 years
- 9.1%45 to 54 years
- 13.0%55 to 64 years
- 11.0%65 to 74 years
- 9.9%75 years and over
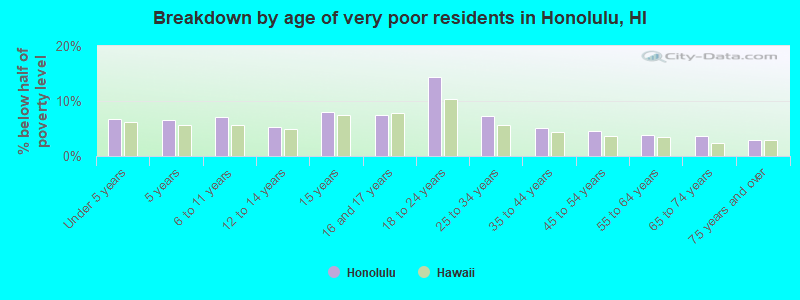
- Breakdown by age of very poor residents in Honolulu,HI (% below half of poverty level)
- 6.7%Under 5 years
- 6.6%5 years
- 7.0%6 to 11 years
- 5.3%12 to 14 years
- 8.0%15 years
- 7.4%16 and 17 years
- 14.4%18 to 24 years
- 7.3%25 to 34 years
- 5.1%35 to 44 years
- 4.5%45 to 54 years
- 3.8%55 to 64 years
- 3.6%65 to 74 years
- 2.9%75 years and over
Poverty by race and place of birth in Honolulu, HI

- Breakdown of poor residents within races in Honolulu, HI (%)
- 11.4%White
- 7.9%Black
- 14.8%American Indian
- 9.8%Asian
- 24.4%Native Hawaiian
- 11.7%Other race
- 11.6%2+ races
- 8.7%Hispanic

- Breakdown of poor residents within races in Honolulu, HI (absolute numbers)
- 7,320White
- 508Black
- 128American Indian
- 20,072Asian
- 7,513Native Hawaiian
- 614Other race
- 9,4712+ races
- 2,370Hispanic

- 10.0%Below poverty level
- 90.0%Above poverty level

- 15.4%Below poverty level
- 84.6%Above poverty level
Poverty in families in Honolulu, HI
Children below poverty level:
| Honolulu, Hawaii: | 13.8% |
| State: | 12.5% |
Poverty rate among high school graduates not in families:
| Honolulu: | 21.7% |
| Hawaii: | 21.2% |
Poverty rate among people who did not graduate high school not in families:
| Honolulu: | 41.7% |
| Hawaii: | 41.5% |

- 47.5%Married-couple family
- 11.3%Male, no wife present
- 41.2%Female, no husband present
Other data
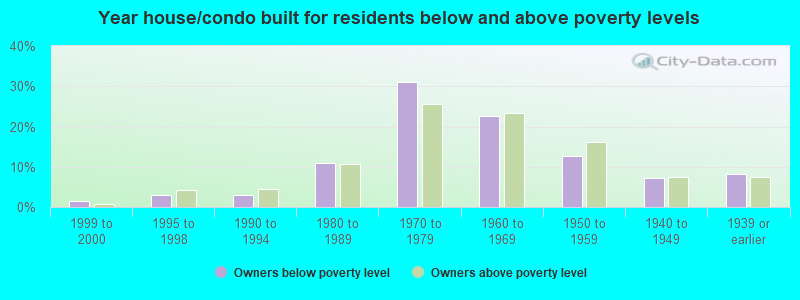
- Owners below poverty level
- 1.4%1999 to 2000
- 3.1%1995 to 1998
- 3.0%1990 to 1994
- 10.8%1980 to 1989
- 31.0%1970 to 1979
- 22.5%1960 to 1969
- 12.7%1950 to 1959
- 7.1%1940 to 1949
- 8.3%1939 or earlier
- Owners above poverty level
- 0.8%1999 to 2000
- 4.3%1995 to 1998
- 4.4%1990 to 1994
- 10.7%1980 to 1989
- 25.5%1970 to 1979
- 23.3%1960 to 1969
- 16.2%1950 to 1959
- 7.4%1940 to 1949
- 7.5%1939 or earlier