Spring Valley neighborhood in Greenwood, South Carolina (SC), 29646 detailed profile
Settings
X


Business Search - 14 Million verified businesses
Area: 0.177 square miles
Population: 39,789
Population density:
| Spring Valley: | 224,896 people per square mile |
| Greenwood: | 1,646 people per square mile |

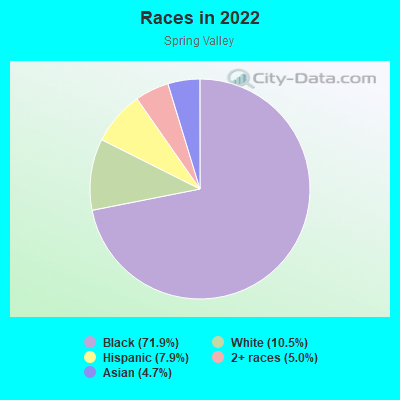
- 28,58871.9%Black
- 4,19510.5%White
- 3,1447.9%Hispanic or Latino
- 1,9865.0%Two or more races
- 1,8754.7%Asian
Median household income in 2022:
| Spring Valley: | $33,106 |
| Greenwood: | $38,884 |
Distribution of median household income
![Distribution of median household income]()
- 4,060Less than $10,000
- 1,541$10,000 to $19,999
- 5,364$20,000 to $29,999
- 2,812$30,000 to $39,999
- 1,401$40,000 to $49,999
- 289$50,000 to $59,999
- 625$60,000 to $74,999
- 2,776$75,000 to $99,999
- 729$100,000 to $124,999
- 1,631$125,000 to $149,999
- 314$150,000 to $199,999

Distribution of owner-occupied house/condo value
![Distribution of owner-occupied house/condo value]()
- 579Less than $50,000
- 174$50,000 to $99,999
- 677$100,000 to $149,999
- 684$150,000 to $199,999
- 203$200,000 to $249,999
- 479$250,000 to $299,999

Distribution of rent paid by renters
![Distribution of rent paid by renters]()
- 1,527$100 to $199
- 1,614$500 to $599
- 1,262$600 to $699
- 4,083$700 to $799
- 4,770$800 to $899
- 1,525$900 to $999
- 5,365$1,000 to $1,249
- 1,015$1,250 to $1,499
- 805$1,500 to $1,999
- 471$2,000 or more

Median rent in 2022:
| Spring Valley: | $921 |
| Greenwood: | $602 |
| Males: | 19,126 |
| Females: | 20,663 |
Males:
| This neighborhood: | 29.8 years |
| Whole city: | 31.9 years |
| This neighborhood: | 35.0 years |
| Whole city: | 34.7 years |
Average household size:
| Spring Valley: | 2.2 people |
| Greenwood: | 2.3 people |
Percentage of family households:
| Spring Valley: | 39.2% |
| Greenwood: | 39.1% |
| Here: | 27.5% |
| Greenwood: | 24.5% |
Percentage of married-couple families with children (among all households):
| Spring Valley: | 37.0% |
| Greenwood: | 11.1% |
Percentage of single-mother households (among all households):
| Spring Valley: | 12.2% |
| Greenwood: | 24.5% |
Percentage of never married males 15 years old and over:
Percentage of never married females 15 years old and over:
| Spring Valley: | 13.7% |
| Greenwood: | 22.5% |
Percentage of never married females 15 years old and over:
| Spring Valley: | 22.4% |
| city: | 27.4% |
Percentage of people that speak English not well or not at all:
| Spring Valley: | 1.2% |
| Greenwood: | 2.5% |
Percentage of people born in this state:
Percentage of people born in another U.S. state:
Percentage of native residents but born outside the U.S.:
Percentage of foreign born residents:
| Here: | 60.2% |
| Greenwood: | 74.0% |
Percentage of people born in another U.S. state:
| Spring Valley: | 28.6% |
| Greenwood: | 21.1% |
Percentage of native residents but born outside the U.S.:
| Here: | 0.7% |
| city: | 0.2% |
Percentage of foreign born residents:
| Here: | 10.5% |
| Greenwood: | 4.7% |
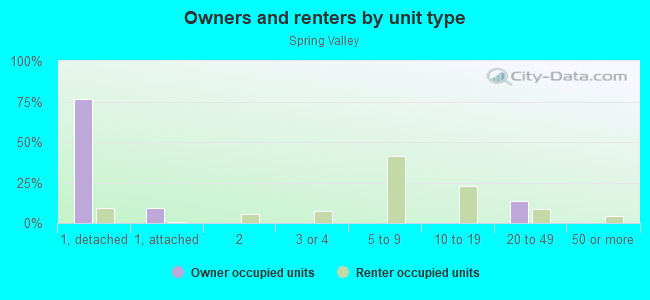
Owner-occupied
Renter-occupied

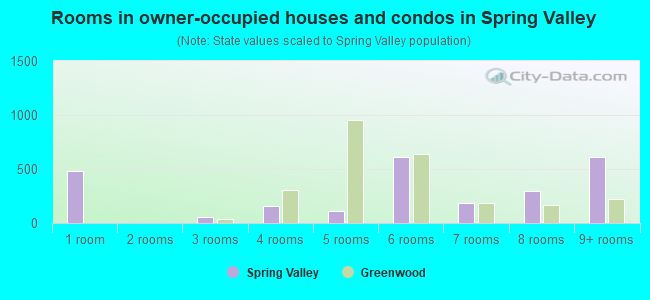
- Rooms in owner-occupied houses and condos in Spring Valley
- 4781 room
- 02 rooms
- 573 rooms
- 1564 rooms
- 1155 rooms
- 6106 rooms
- 1897 rooms
- 3008 rooms
- 6109+ rooms
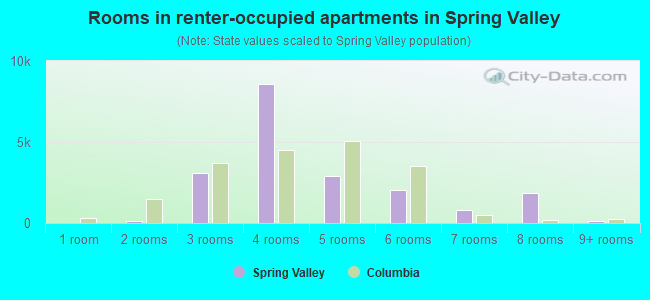
- Rooms in renter-occupied apartments in Spring Valley
- 01 room
- 1152 rooms
- 3,0683 rooms
- 8,5774 rooms
- 2,8975 rooms
- 2,0616 rooms
- 8087 rooms
- 1,8758 rooms
- 1159+ rooms
Owner-occupied
Renter-occupied
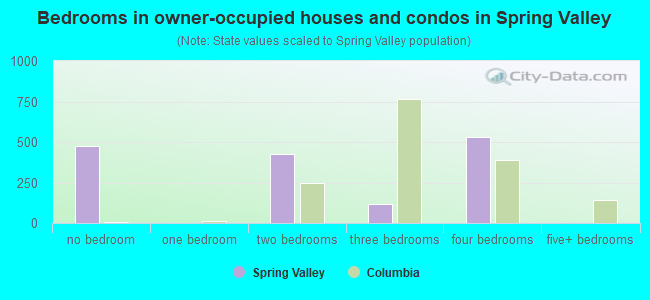
- Bedrooms in owner-occupied houses and condos in Spring Valley
- 478no bedroom
- 01 bedroom
- 4282 bedrooms
- 1153 bedrooms
- 5304 bedrooms
- 05+ bedrooms
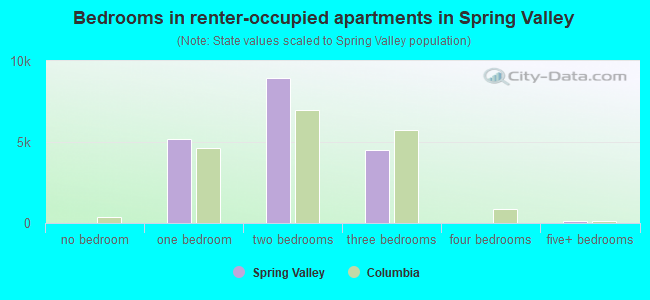
- Bedrooms in renter-occupied apartments in Spring Valley
- 0no bedroom
- 5,1661 bedroom
- 8,9682 bedrooms
- 4,4963 bedrooms
- 04 bedrooms
- 1155+ bedrooms
Average number of cars or other vehicles available in houses/condos:
Average number of cars or other vehicles available in apartments:
| This neighborhood: | 3.6 |
| Greenwood: | 1.7 |
Average number of cars or other vehicles available in apartments:
| Here: | 0.5 |
| city: | 1.0 |
Percentage of units with a mortgage:
| Spring Valley: | 50.2% |
| Greenwood: | 49.9% |
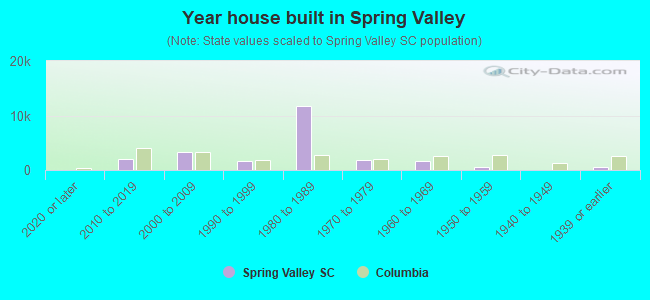
- Year house built in Spring Valley
- 02020 or later
- 2,1092010 to 2019
- 3,3732000 to 2009
- 1,7001990 to 1999
- 11,6811980 to 1989
- 1,8241970 to 1979
- 1,6481960 to 1969
- 6411950 to 1959
- 01940 to 1949
- 6101939 or earlier
City-data.com crime index for city in 2020 (higher means more crime):
| City: | 609.2 |
| U.S. average: | 219.5 |
Travel time to work (commute)
![Travel time to work (commute)]()
- 379Less than 5 minutes
- 1,7005 to 9 minutes
- 2,62810 to 14 minutes
- 2,87715 to 19 minutes
- 1,90920 to 24 minutes
- 64725 to 29 minutes
- 1,95530 to 34 minutes
- 29440 to 44 minutes
- 26345 to 59 minutes
- 96160 to 89 minutes
- 10490 or more minutes

Means of transportation to work
![Means of transportation to work]()
- 89.2%15,385Drove a car alone
- 3.4%587Carpooled
- 8.9%1,526Other means
- 4.8%833Worked at home

Time leaving home to go to work
![Time leaving home to go to work]()
- 1,19012:00 a.m. to 4:59 a.m.
- 8565:00 a.m. to 5:29 a.m.
- 1835:30 a.m. to 5:59 a.m.
- 6606:00 a.m. to 6:29 a.m.
- 7916:30 a.m. to 6:59 a.m.
- 2,3677:00 a.m. to 7:29 a.m.
- 1,3927:30 a.m. to 7:59 a.m.
- 1,8838:00 a.m. to 8:29 a.m.
- 5958:30 a.m. to 8:59 a.m.
- 6149:00 a.m. to 9:59 a.m.
- 44410:00 a.m. to 10:59 a.m.
- 1,14411:00 a.m. to 11:59 a.m.
- 63412:00 p.m. to 3:59 p.m.
- 9094:00 p.m. to 11:59 p.m.

Occupations of males:
- Percentage of males in management occupations (except farmers):
Here: 1.6% city: 7.5%
- Percentage of males in computer and mathematical occupations:
Here: 5.7% city: 0.7%
- Percentage of males in life, physical, and social science occupations:
Here: 4.5% city: 0.6%
- Percentage of males in education, training, and library occupations:
Here: 28.3% city: 3.2%
- Percentage of males in arts, design, entertainment, sports, and media occupations:
Here: 2.1% city: 0.1%
- Percentage of males in healthcare practitioners and technical occupations:
Here: 9.7% city: 2.4%
- Percentage of males in service occupations:
Here: 1.8% city: 8.7%
- Percentage of males in sales and office occupations:
Here: 5.4% city: 15.7%
- Percentage of males in construction, extraction, and maintenance occupations:
Here: 36.6% city: 7.0%
- Percentage of males in production occupations:
Here: 3.7% city: 19.6%
- Percentage of males in material moving occupations:
Here: 5.9% city: 12.5%
Occupations of females:
- Percentage of females in management occupations (except farmers):
Here: 3.3% city: 6.5%
- Percentage of females in business and financial operations occupations:
Here: 11.3% city: 4.2%
- Percentage of females in legal occupations:
Here: 1.2% city: 0.2%
- Percentage of females in education, training, and library occupations:
Here: 10.3% city: 8.1%
- Percentage of females in service occupations:
Here: 28.3% city: 24.1%
- Percentage of females in sales and office occupations:
Here: 18.3% city: 24.9%
- Percentage of females in production occupations:
Here: 1.8% city: 17.8%
- Percentage of females in material moving occupations:
Here: 24.9% city: 0.3%
Education in this neighborhood (subdivision or community):
- Percentage of people 3 years and older in K-12 schools:
Spring Valley: 26.2% Greenwood: 17.0%
- Percentage of people 3 years and older in undergraduate colleges:
Spring Valley: 5.5% Greenwood: 12.6%
- Percentage of people 3 years and older in grad. or professional schools:
Spring Valley: 0.3% Greenwood: 0.6%
- Percentage of students K-12 enrolled in private schools:
Spring Valley: 3.0% Greenwood: 3.4%
Percentage of population below poverty level:
| Spring Valley: | 13.3% |
| Greenwood: | 24.7% |
Median year renter moved in (as recorded in 2022):
| Spring Valley: | 2043 |
| Greenwood: | 2014 |
Percentage of married-couple families with both working:
| Spring Valley: | 132.7% |
| Greenwood: | 57.6% |
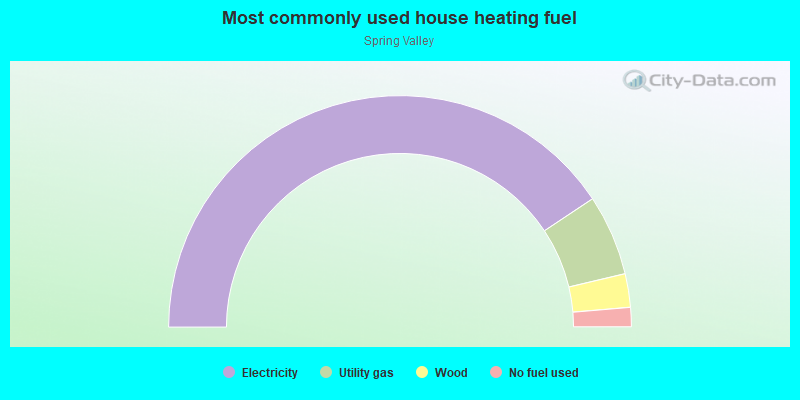
- 81.3%Electricity
- 11.3%Utility gas
- 4.7%Wood
- 2.7%No fuel used
Roads and streets:
Cherokee Dr
Length: 0.77 miles
Directions: E-W, SE-NW, SW-NE
Address range: 118 to 174
Directions: E-W, SE-NW, SW-NE
Address range: 118 to 174
Valley Rd
Length: 0.72 miles
Directions: N-S, SE-NW, SW-NE
Address range: 114 to 166
Directions: N-S, SE-NW, SW-NE
Address range: 114 to 166