Market District neighborhood in Austin, Texas (TX), 78701, 78703 detailed profile
Settings
X


Business Search - 14 Million verified businesses
Area: 0.163 square miles
Population: 311
Population density:
| Market District: | 1,907 people per square mile |
| Austin: | 3,878 people per square mile |

- 16150.5%White
- 9529.8%Hispanic or Latino
- 3912.2%Asian
- 92.8%Two or more races
- 72.2%Black
- 61.9%Some other race
- 20.6%American Indian

Median household income in 2022:
| Market District: | $37,589 |
| Austin: | $89,415 |
Distribution of median household income
![Distribution of median household income]()
- 17Less than $10,000
- 18$10,000 to $19,999
- 45$20,000 to $29,999
- 30$30,000 to $39,999
- 20$40,000 to $49,999
- 7$50,000 to $59,999
- 67$60,000 to $74,999
- 9$75,000 to $99,999
- 16$100,000 to $124,999
- 15$125,000 to $149,999
- 70$150,000 to $199,999
- 24$200,000 or more

Distribution of owner-occupied house/condo value
![Distribution of owner-occupied house/condo value]()
- 6Less than $50,000
- 8$200,000 to $249,999
- 4$300,000 to $399,999
- 8$400,000 to $499,999
- 20$500,000 to $749,999
- 63$750,000 to $999,999
- 70$1,000,000 or more

Distribution of rent paid by renters
![Distribution of rent paid by renters]()
- 11Less than $100
- 25$700 to $799
- 38$800 to $899
- 21$900 to $999
- 19$1,250 to $1,499
- 54$1,500 to $1,999
- 356$2,000 or more

Median rent in 2022:
| Market District: | $870 |
| Austin: | $1,437 |
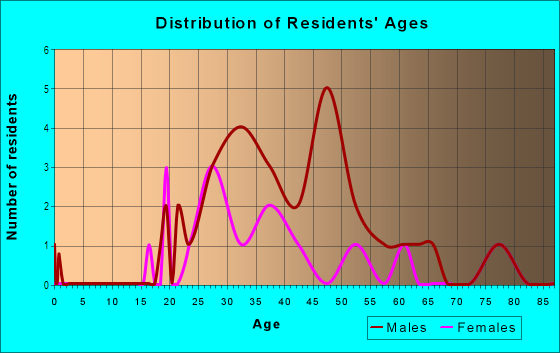
| Males: | 157 |
| Females: | 154 |
Males:
| This neighborhood: | 27.3 years |
| Whole city: | 34.5 years |
| This neighborhood: | 35.9 years |
| Whole city: | 34.4 years |
Average household size:
| Market District: | 1.6 people |
| Austin: | 28.0 people |
Percentage of family households:
| Market District: | 40.2% |
| Austin: | 36.6% |
| Here: | 15.7% |
| Austin: | 35.3% |
Percentage of married-couple families with children (among all households):
| Market District: | 15.7% |
| Austin: | 36.3% |
Percentage of single-mother households (among all households):
| Market District: | 46.3% |
| Austin: | 7.9% |
Percentage of never married males 15 years old and over:
Percentage of never married females 15 years old and over:
| Market District: | 23.6% |
| Austin: | 25.0% |
Percentage of never married females 15 years old and over:
| Market District: | 10.8% |
| city: | 19.9% |
Percentage of people that speak English not well or not at all:
| Market District: | 0.0% |
| Austin: | 5.2% |
Percentage of people born in this state:
Percentage of people born in another U.S. state:
Percentage of native residents but born outside the U.S.:
Percentage of foreign born residents:
| Here: | 37.6% |
| Austin: | 48.2% |
Percentage of people born in another U.S. state:
| Market District: | 51.3% |
| Austin: | 31.8% |
Percentage of native residents but born outside the U.S.:
| Here: | 3.1% |
| city: | 2.3% |
Percentage of foreign born residents:
| Here: | 8.0% |
| Austin: | 17.8% |

Owner-occupied
Renter-occupied


- Rooms in owner-occupied houses and condos in Market District
- 01 room
- 42 rooms
- 703 rooms
- 84 rooms
- 485 rooms
- 56 rooms
- 47 rooms
- 158 rooms
- 59+ rooms

- Rooms in renter-occupied apartments in Market District
- 211 room
- 412 rooms
- 163 rooms
- 244 rooms
- 205 rooms
- 106 rooms
- 27 rooms
- 08 rooms
- 69+ rooms
Owner-occupied
Renter-occupied

- Bedrooms in owner-occupied houses and condos in Market District
- 0no bedroom
- 571 bedroom
- 262 bedrooms
- 333 bedrooms
- 234 bedrooms
- 05+ bedrooms

- Bedrooms in renter-occupied apartments in Market District
- 2no bedroom
- 621 bedroom
- 162 bedrooms
- 203 bedrooms
- 74 bedrooms
- 65+ bedrooms
Average number of cars or other vehicles available in houses/condos:
Average number of cars or other vehicles available in apartments:
| This neighborhood: | 1.6 |
| Austin: | 1.9 |
Average number of cars or other vehicles available in apartments:
| Here: | 0.9 |
| city: | 1.3 |
Percentage of units with a mortgage:
| Market District: | 83.6% |
| Austin: | 68.5% |

- Year house built in Market District
- 32020 or later
- 3582010 to 2019
- 1962000 to 2009
- 421990 to 1999
- 511980 to 1989
- 591970 to 1979
- 91960 to 1969
- 71950 to 1959
- 111940 to 1949
- 711939 or earlier

City-data.com crime index for city in 2020 (higher means more crime):
| City: | 316.8 |
| U.S. average: | 219.5 |
Travel time to work (commute)
![Travel time to work (commute)]()
- 755 to 9 minutes
- 11210 to 14 minutes
- 10815 to 19 minutes
- 5820 to 24 minutes
- 6425 to 29 minutes
- 7630 to 34 minutes
- 635 to 39 minutes
- 740 to 44 minutes
- 245 to 59 minutes
- 5560 to 89 minutes

Means of transportation to work
![Means of transportation to work]()
- 50.7%82Drove a car alone
- 3.7%6Bus
- 0.6%1Subway or elevated rail
- 3.1%5Taxi
- 25.3%41Bicycle
- 46.3%75Walked
- 44.5%72Worked at home

Time leaving home to go to work
![Time leaving home to go to work]()
- 95:30 a.m. to 5:59 a.m.
- 186:00 a.m. to 6:29 a.m.
- 306:30 a.m. to 6:59 a.m.
- 607:00 a.m. to 7:29 a.m.
- 657:30 a.m. to 7:59 a.m.
- 1388:00 a.m. to 8:29 a.m.
- 728:30 a.m. to 8:59 a.m.
- 1369:00 a.m. to 9:59 a.m.
- 2210:00 a.m. to 10:59 a.m.
- 111:00 a.m. to 11:59 a.m.
- 112:00 p.m. to 3:59 p.m.
- 84:00 p.m. to 11:59 p.m.

Occupations of males:
- Percentage of males in management occupations (except farmers):
Here: 215.7% city: 15.3%
- Percentage of males in business and financial operations occupations:
Here: 70.8% city: 7.0%
- Percentage of males in computer and mathematical occupations:
Here: 63.8% city: 12.0%
- Percentage of males in architecture and engineering occupations:
Here: 35.3% city: 5.1%
- Percentage of males in life, physical, and social science occupations:
Here: 19.9% city: 1.3%
- Percentage of males in community and social services occupations:
Here: 8.6% city: 1.0%
- Percentage of males in legal occupations:
Here: 55.4% city: 1.9%
- Percentage of males in education, training, and library occupations:
Here: 73.6% city: 4.1%
- Percentage of males in arts, design, entertainment, sports, and media occupations:
Here: 5.8% city: 4.1%
- Percentage of males in healthcare practitioners and technical occupations:
Here: 16.9% city: 2.3%
- Percentage of males in service occupations:
Here: 14.6% city: 11.2%
- Percentage of males in sales and office occupations:
Here: 62.5% city: 14.9%
- Percentage of males in production occupations:
Here: 6.5% city: 3.4%
Occupations of females:
- Percentage of females in management occupations (except farmers):
Here: 117.9% city: 13.5%
- Percentage of females in business and financial operations occupations:
Here: 6.4% city: 11.0%
- Percentage of females in computer and mathematical occupations:
Here: 31.0% city: 4.0%
- Percentage of females in architecture and engineering occupations:
Here: 6.5% city: 1.6%
- Percentage of females in life, physical, and social science occupations:
Here: 7.8% city: 1.7%
- Percentage of females in legal occupations:
Here: 11.2% city: 2.4%
- Percentage of females in education, training, and library occupations:
Here: 18.3% city: 9.0%
- Percentage of females in arts, design, entertainment, sports, and media occupations:
Here: 32.5% city: 4.5%
- Percentage of females in healthcare practitioners and technical occupations:
Here: 3.7% city: 7.8%
- Percentage of females in service occupations:
Here: 19.7% city: 15.8%
- Percentage of females in sales and office occupations:
Here: 26.4% city: 22.9%
- Percentage of females in production occupations:
Here: 4.9% city: 1.5%
Education in this neighborhood (subdivision or community):
- Percentage of people 3 years and older in K-12 schools:
Market District: 30.7% Austin: 12.4%
- Percentage of people 3 years and older in undergraduate colleges:
Market District: 2.0% Austin: 6.1%
- Percentage of people 3 years and older in grad. or professional schools:
Market District: 20.1% Austin: 2.5%
- Percentage of students K-12 enrolled in private schools:
Market District: 25.8% Austin: 11.8%
Percentage of population below poverty level:
| Market District: | 4.1% |
| Austin: | 11.1% |
Median year owner moved in (as recorded in 2022):
Median year renter moved in (as recorded in 2022):
| Market District: | 2004 |
| Austin: | 2013 |
Median year renter moved in (as recorded in 2022):
| Market District: | 2016 |
| Austin: | 2021 |
Percentage of married-couple families with both working:
| Market District: | 100.0% |
| Austin: | 68.5% |

- 48.2%Electricity
- 39.7%Utility gas
- 8.8%Bottled, tank, or LP gas
- 3.3%No fuel used
Roads and streets:
Nueces St
Length: 0.34 miles
Direction: N-S
Address range: 306 to 799
Direction: N-S
Address range: 306 to 799
W 6th St
Length: 0.33 miles
Direction: E-W
Address range: 600 to 909
Direction: E-W
Address range: 600 to 909
West Ave
Length: 0.33 miles
Direction: N-S
Address range: 400 to 799
Direction: N-S
Address range: 400 to 799
W 5th St
Length: 0.31 miles
Direction: E-W
Address range: 600 to 899
Direction: E-W
Address range: 600 to 899
W 8th St
Length: 0.31 miles
Direction: E-W
Address range: 400 to 799
Direction: E-W
Address range: 400 to 799
W 7th St
Length: 0.31 miles
Direction: E-W
Address range: 400 to 799
Direction: E-W
Address range: 400 to 799
Rio Grande St
Length: 0.27 miles
Direction: N-S
Address range: 400 to 799
Direction: N-S
Address range: 400 to 799
Henderson St
Length: 0.19 miles
Direction: SW-NE
Address range: 600 to 799
Direction: SW-NE
Address range: 600 to 799
Bowie St
Length: 0.19 miles
Direction: SW-NE
Address range: 300 to 599
Direction: SW-NE
Address range: 300 to 599
W 3rd St
Length: 0.16 miles
Direction: E-W
Direction: E-W
Wood St
Length: 0.10 miles
Direction: SW-NE
Address range: 600 to 799
Direction: SW-NE
Address range: 600 to 799
W 4th St
Length: 0.07 miles
Direction: E-W
Address range: 600 to 699
Direction: E-W
Address range: 600 to 699
San Antonio St
Length: 0.07 miles
Direction: N-S
Address range: 700 to 799
Direction: N-S
Address range: 700 to 799
Guadalupe St
Length: 0.07 miles
Direction: N-S
Address range: 700 to 799
Direction: N-S
Address range: 700 to 799
Other features:
Shoal Crk
Length: 0.49 miles
Directions: E-W, N-S, SE-NW, SW-NE
Directions: E-W, N-S, SE-NW, SW-NE