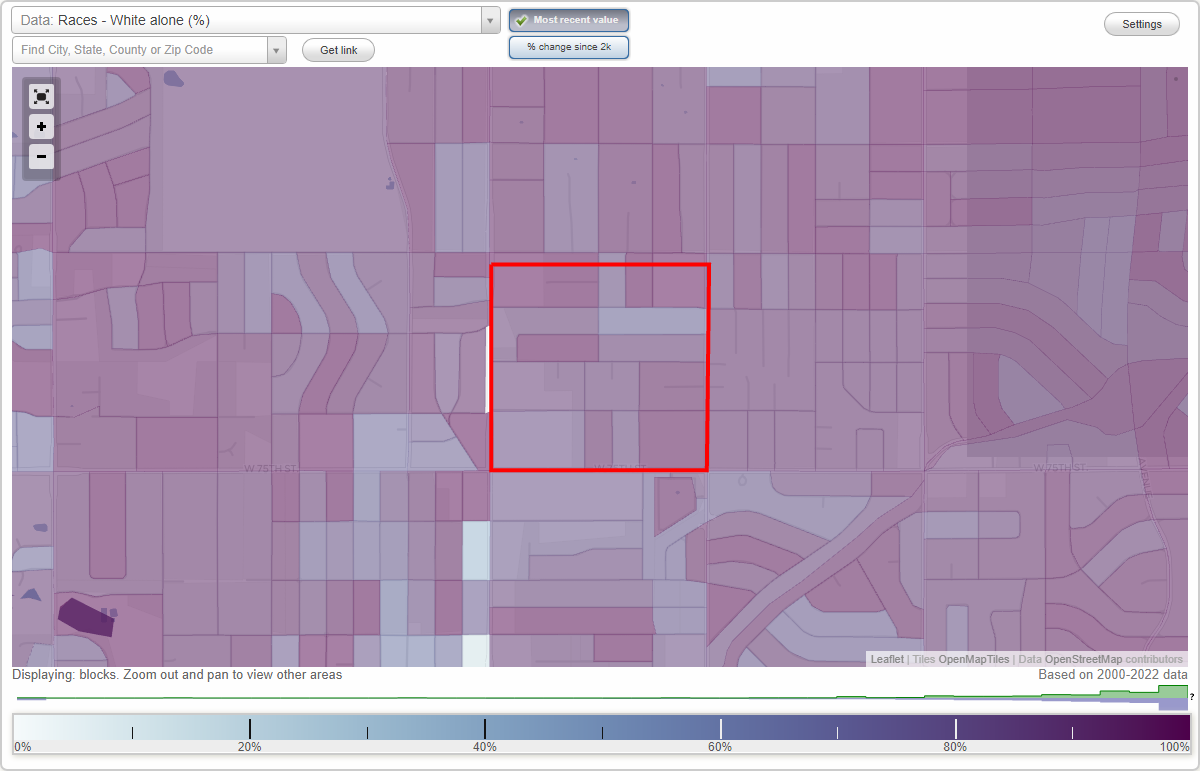
Maple Crest neighborhood in Overland Park, Kansas (KS), 66204 detailed profile
Settings
X

Business Search - 14 Million verified businesses
Area: 0.237 square miles
Population: 1,266
Population density:
| Maple Crest: | 5,346 people per square mile |
| Overland Park: | 3,485 people per square mile |

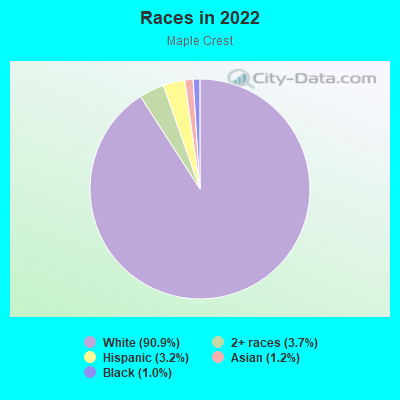
- 1,17690.9%White
- 483.7%Two or more races
- 413.2%Hispanic or Latino
- 161.2%Asian
- 131.0%Black
Median household income in 2022:
| Maple Crest: | $74,688 |
| Overland Park: | $96,694 |
Distribution of median household income
![Distribution of median household income]()
- 3Less than $10,000
- 24$10,000 to $19,999
- 4$20,000 to $29,999
- 9$30,000 to $39,999
- 74$40,000 to $49,999
- 154$50,000 to $59,999
- 136$60,000 to $74,999
- 237$75,000 to $99,999
- 33$100,000 to $124,999
- 85$125,000 to $149,999
- 34$150,000 to $199,999
- 17$200,000 or more

Distribution of owner-occupied house/condo value
![Distribution of owner-occupied house/condo value]()
- 1Less than $50,000
- 1$50,000 to $99,999
- 97$100,000 to $149,999
- 246$150,000 to $199,999
- 68$200,000 to $249,999
- 228$250,000 to $299,999
- 107$300,000 to $399,999
- 43$400,000 to $499,999
- 21$500,000 to $749,999
- 1$750,000 to $999,999
- 7$1,000,000 or more

Distribution of rent paid by renters
![Distribution of rent paid by renters]()
- 10$300 to $399
- 27$1,000 to $1,249
- 66$1,250 to $1,499
- 23$1,500 to $1,999
- 3$2,000 or more

Median rent in 2022:
| Maple Crest: | $1,350 |
| Overland Park: | $1,194 |
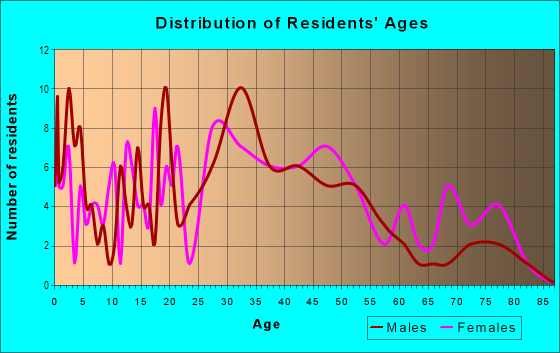
| Males: | 450 |
| Females: | 816 |
Males:
| This neighborhood: | 34.4 years |
| Whole city: | 37.7 years |
| This neighborhood: | 51.0 years |
| Whole city: | 38.8 years |
Average household size:
| Maple Crest: | 1.7 people |
| Overland Park: | 2.3 people |
Percentage of family households:
| Maple Crest: | 32.1% |
| Overland Park: | 42.1% |
| Here: | 33.8% |
| Overland Park: | 48.0% |
Percentage of married-couple families with children (among all households):
| Maple Crest: | 51.9% |
| Overland Park: | 37.4% |
Percentage of single-mother households (among all households):
| Maple Crest: | 7.7% |
| Overland Park: | 4.2% |
Percentage of never married males 15 years old and over:
Percentage of never married females 15 years old and over:
| Maple Crest: | 10.3% |
| Overland Park: | 17.2% |
Percentage of never married females 15 years old and over:
| Maple Crest: | 16.6% |
| city: | 15.1% |
Percentage of people that speak English not well or not at all:
| Maple Crest: | 0.0% |
| Overland Park: | 1.4% |
Percentage of people born in this state:
Percentage of people born in another U.S. state:
Percentage of native residents but born outside the U.S.:
Percentage of foreign born residents:
| Here: | 48.7% |
| Overland Park: | 37.4% |
Percentage of people born in another U.S. state:
| Maple Crest: | 46.1% |
| Overland Park: | 50.4% |
Percentage of native residents but born outside the U.S.:
| Here: | 1.8% |
| city: | 0.9% |
Percentage of foreign born residents:
| Here: | 3.3% |
| Overland Park: | 11.3% |
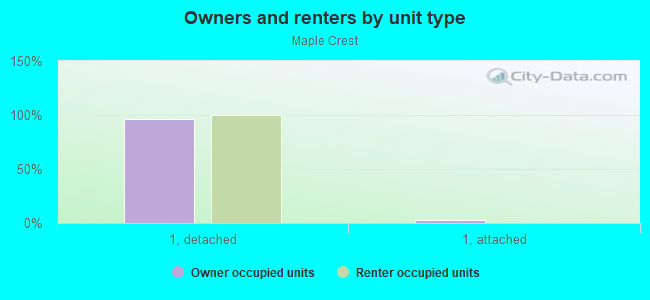
Owner-occupied
Renter-occupied

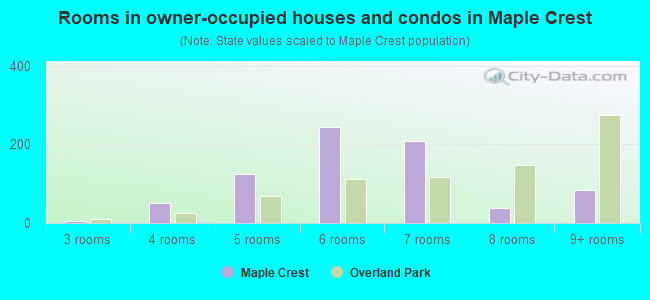
- Rooms in owner-occupied houses and condos in Maple Crest
- 01 room
- 02 rooms
- 53 rooms
- 504 rooms
- 1255 rooms
- 2456 rooms
- 2087 rooms
- 388 rooms
- 859+ rooms
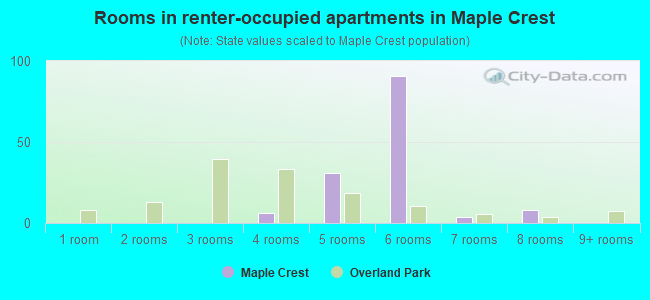
- Rooms in renter-occupied apartments in Maple Crest
- 01 room
- 02 rooms
- 03 rooms
- 64 rooms
- 315 rooms
- 916 rooms
- 47 rooms
- 88 rooms
- 09+ rooms
Owner-occupied
Renter-occupied
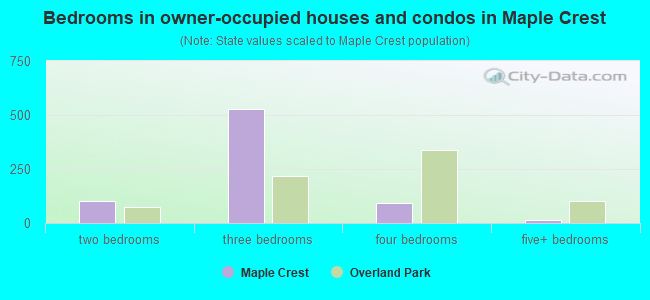
- Bedrooms in owner-occupied houses and condos in Maple Crest
- 0no bedroom
- 01 bedroom
- 1012 bedrooms
- 5293 bedrooms
- 924 bedrooms
- 145+ bedrooms
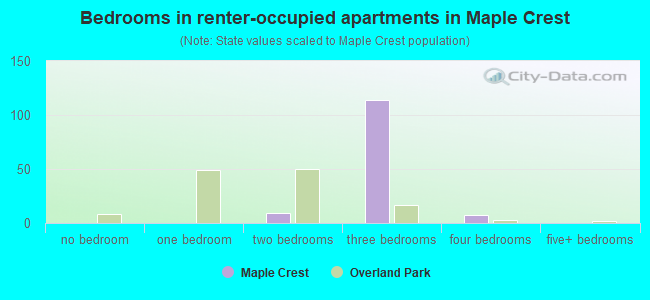
- Bedrooms in renter-occupied apartments in Maple Crest
- 0no bedroom
- 01 bedroom
- 92 bedrooms
- 1143 bedrooms
- 74 bedrooms
- 05+ bedrooms
Average number of cars or other vehicles available in houses/condos:
Average number of cars or other vehicles available in apartments:
| This neighborhood: | 1.5 |
| Overland Park: | 2.0 |
Average number of cars or other vehicles available in apartments:
| Here: | 1.7 |
| city: | 1.3 |
Percentage of units with a mortgage:
| Maple Crest: | 78.3% |
| Overland Park: | 67.7% |
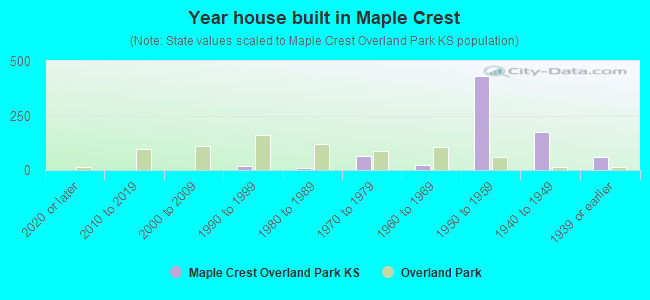
- Year house built in Maple Crest
- 02020 or later
- 02010 to 2019
- 02000 to 2009
- 171990 to 1999
- 91980 to 1989
- 651970 to 1979
- 221960 to 1969
- 4331950 to 1959
- 1741940 to 1949
- 581939 or earlier
City-data.com crime index for city in 2020 (higher means more crime):
| City: | 154.8 |
| U.S. average: | 219.5 |
Travel time to work (commute)
![Travel time to work (commute)]()
- 19Less than 5 minutes
- 695 to 9 minutes
- 5610 to 14 minutes
- 15815 to 19 minutes
- 15020 to 24 minutes
- 3325 to 29 minutes
- 3330 to 34 minutes

Means of transportation to work
![Means of transportation to work]()
- 67.5%523Drove a car alone
- 4.5%35Carpooled
- 27.7%215Worked at home

Time leaving home to go to work
![Time leaving home to go to work]()
- 412:00 a.m. to 4:59 a.m.
- 125:00 a.m. to 5:29 a.m.
- 265:30 a.m. to 5:59 a.m.
- 96:00 a.m. to 6:29 a.m.
- 586:30 a.m. to 6:59 a.m.
- 867:00 a.m. to 7:29 a.m.
- 977:30 a.m. to 7:59 a.m.
- 838:00 a.m. to 8:29 a.m.
- 538:30 a.m. to 8:59 a.m.
- 309:00 a.m. to 9:59 a.m.
- 1311:00 a.m. to 11:59 a.m.
- 3612:00 p.m. to 3:59 p.m.
- 114:00 p.m. to 11:59 p.m.

Occupations of males:
- Percentage of males in management occupations (except farmers):
Here: 24.7% city: 17.2%
- Percentage of males in business and financial operations occupations:
Here: 6.3% city: 9.9%
- Percentage of males in computer and mathematical occupations:
Here: 8.9% city: 11.2%
- Percentage of males in architecture and engineering occupations:
Here: 250.4% city: 5.0%
- Percentage of males in life, physical, and social science occupations:
Here: 942.6% city: 1.6%
- Percentage of males in community and social services occupations:
Here: 427.1% city: 0.9%
- Percentage of males in legal occupations:
Here: 14.7% city: 2.2%
- Percentage of males in education, training, and library occupations:
Here: 279.8% city: 2.4%
- Percentage of males in arts, design, entertainment, sports, and media occupations:
Here: 338.8% city: 2.6%
- Percentage of males in healthcare practitioners and technical occupations:
Here: 11.4% city: 4.1%
- Percentage of males in service occupations:
Here: 3.2% city: 9.7%
- Percentage of males in sales and office occupations:
Here: 17.7% city: 19.9%
- Percentage of males in farming, fishing, and forestry occupations:
Here: 7.0% city: 0.1%
- Percentage of males in construction, extraction, and maintenance occupations:
Here: 265.1% city: 2.8%
- Percentage of males in production occupations:
Here: 14.6% city: 2.3%
- Percentage of males in transportation occupations:
Here: 6.3% city: 3.0%
Occupations of females:
- Percentage of females in management occupations (except farmers):
Here: 1213.8% city: 10.8%
- Percentage of females in business and financial operations occupations:
Here: 26.6% city: 10.2%
- Percentage of females in architecture and engineering occupations:
Here: 92.1% city: 1.3%
- Percentage of females in life, physical, and social science occupations:
Here: 2.9% city: 1.2%
- Percentage of females in community and social services occupations:
Here: 209.3% city: 2.4%
- Percentage of females in legal occupations:
Here: 586.0% city: 1.6%
- Percentage of females in education, training, and library occupations:
Here: 15.8% city: 10.8%
- Percentage of females in arts, design, entertainment, sports, and media occupations:
Here: 13.7% city: 2.8%
- Percentage of females in healthcare practitioners and technical occupations:
Here: 6.5% city: 12.1%
- Percentage of females in service occupations:
Here: 4.0% city: 13.8%
- Percentage of females in sales and office occupations:
Here: 30.6% city: 25.2%
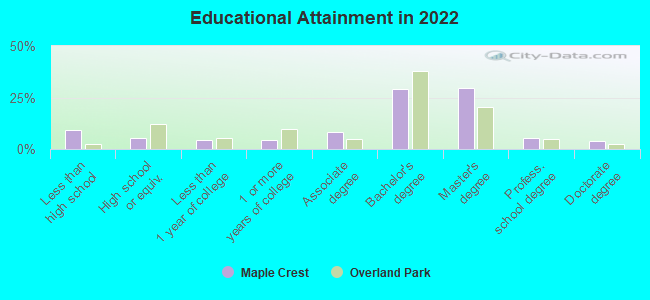
Education in this neighborhood (subdivision or community):
- Percentage of people 3 years and older in K-12 schools:
Maple Crest: 16.2% Overland Park: 15.4%
- Percentage of people 3 years and older in undergraduate colleges:
Maple Crest: 3.5% Overland Park: 3.4%
- Percentage of people 3 years and older in grad. or professional schools:
Maple Crest: 1.7% Overland Park: 2.3%
- Percentage of students K-12 enrolled in private schools:
Maple Crest: 11.3% Overland Park: 14.1%
Percentage of population below poverty level:
| Maple Crest: | 1.1% |
| Overland Park: | 5.0% |
Median year owner moved in (as recorded in 2022):
Median year renter moved in (as recorded in 2022):
| Maple Crest: | 1996 |
| Overland Park: | 2013 |
Median year renter moved in (as recorded in 2022):
| Maple Crest: | 2017 |
| Overland Park: | 2021 |
Percentage of married-couple families with both working:
| Maple Crest: | 100.0% |
| Overland Park: | 75.4% |
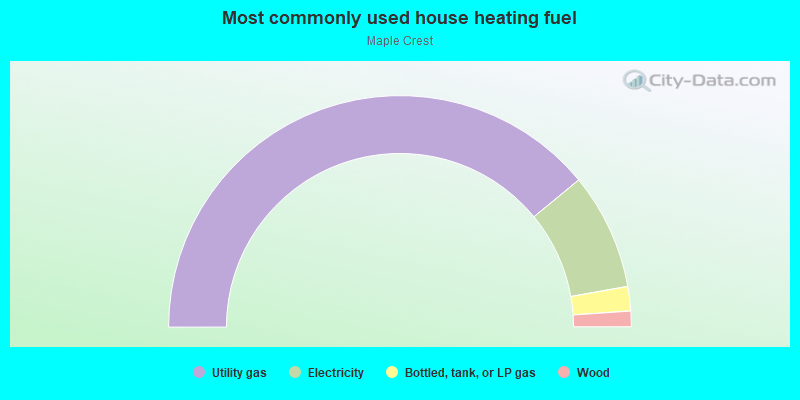
- 78.1%Utility gas
- 16.3%Electricity
- 3.4%Bottled, tank, or LP gas
- 2.2%Wood
Roads and streets:
W 73rd St
Length: 0.56 miles
Direction: E-W
Address range: 6300 to 6999
Direction: E-W
Address range: 6300 to 6999
W 72nd Ter
Length: 0.56 miles
Directions: E-W, SW-NE
Address range: 6300 to 6999
Directions: E-W, SW-NE
Address range: 6300 to 6999
Lamar Ave
Length: 0.37 miles
Direction: N-S
Address range: 7200 to 7499
Direction: N-S
Address range: 7200 to 7499
W 74th St
Length: 0.36 miles
Direction: E-W
Address range: 6300 to 6701
Direction: E-W
Address range: 6300 to 6701
W 72nd St
Length: 0.32 miles
Direction: E-W
Address range: 6300 to 6699
Direction: E-W
Address range: 6300 to 6699
Walmer St
Length: 0.25 miles
Direction: N-S
Address range: 7300 to 7499
Direction: N-S
Address range: 7300 to 7499
Glenwood Ln
Length: 0.25 miles
Direction: N-S
Address range: 7300 to 7499
Direction: N-S
Address range: 7300 to 7499
Glenwood St
Length: 0.18 miles
Direction: N-S
Address range: 7120 to 7299
Direction: N-S
Address range: 7120 to 7299
W 71st Ter
Length: 0.15 miles
Direction: E-W
Address range: 6700 to 6899
Direction: E-W
Address range: 6700 to 6899
Riggs St
Length: 0.14 miles
Direction: N-S
Address range: 7400 to 7499
Direction: N-S
Address range: 7400 to 7499
W 73rd Ter
Length: 0.12 miles
Direction: E-W
Address range: 6300 to 6499
Direction: E-W
Address range: 6300 to 6499
Travis Ln
Length: 0.06 miles
Directions: N-S, SW-NE
Address range: 7200 to 7299
Directions: N-S, SW-NE
Address range: 7200 to 7299
Riggs St (73 St)
Length: 0.04 miles
Direction: N-S
Address range: 7300 to 7399
Direction: N-S
Address range: 7300 to 7399
73rd St
Length: 0.04 miles
Direction: N-S
Address range: 7300 to 7399
Direction: N-S
Address range: 7300 to 7399