Grove Park neighborhood in Columbia, South Carolina (SC), 29204 detailed profile
Settings
X


Business Search - 14 Million verified businesses
Area: 0.102 square miles
Population: 422
Population density:
| Grove Park: | 4,155 people per square mile |
| Columbia: | 1,113 people per square mile |

- 21551.2%White
- 16238.6%Black
- 184.3%Hispanic or Latino
- 174.0%Two or more races
- 81.9%Asian

Median household income in 2022:
| Grove Park: | $49,834 |
| Columbia: | $56,175 |
Distribution of median household income
![Distribution of median household income]()
- 13Less than $10,000
- 12$10,000 to $19,999
- 19$20,000 to $29,999
- 32$30,000 to $39,999
- 27$40,000 to $49,999
- 16$50,000 to $59,999
- 25$60,000 to $74,999
- 18$75,000 to $99,999
- 24$100,000 to $124,999
- 6$125,000 to $149,999
- 9$150,000 to $199,999
- 9$200,000 or more

Distribution of owner-occupied house/condo value
![Distribution of owner-occupied house/condo value]()
- 21Less than $50,000
- 50$50,000 to $99,999
- 31$100,000 to $149,999
- 35$150,000 to $199,999
- 23$200,000 to $249,999
- 17$250,000 to $299,999
- 4$300,000 to $399,999
- 7$400,000 to $499,999
- 4$500,000 to $749,999
- 4$1,000,000 or more

Distribution of rent paid by renters
![Distribution of rent paid by renters]()
- 16Less than $100
- 8$100 to $199
- 3$200 to $299
- 3$300 to $399
- 13$400 to $499
- 18$500 to $599
- 16$600 to $699
- 24$700 to $799
- 11$800 to $899
- 7$900 to $999
- 8$1,000 to $1,249
- 11$1,250 to $1,499
- 11$1,500 to $1,999
- 29$2,000 or more

Median rent in 2022:
| Grove Park: | $820 |
| Columbia: | $975 |
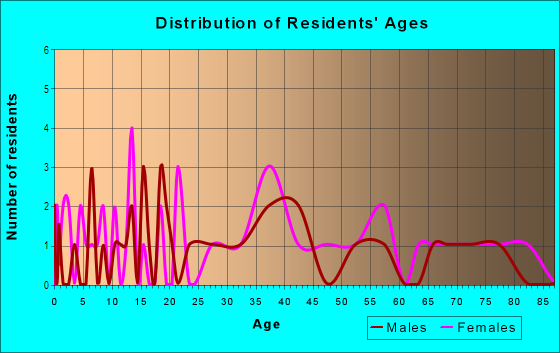
| Males: | 191 |
| Females: | 231 |
Males:
| This neighborhood: | 39.8 years |
| Whole city: | 27.5 years |
| This neighborhood: | 48.1 years |
| Whole city: | 29.3 years |
Average household size:
| Grove Park: | 2.1 people |
| Columbia: | 2.1 people |
Percentage of family households:
| Grove Park: | 37.8% |
| Columbia: | 35.2% |
| Here: | 34.6% |
| Columbia: | 27.5% |
Percentage of married-couple families with children (among all households):
| Grove Park: | 20.5% |
| Columbia: | 23.7% |
Percentage of single-mother households (among all households):
| Grove Park: | 27.0% |
| Columbia: | 12.1% |
Percentage of never married males 15 years old and over:
Percentage of never married females 15 years old and over:
| Grove Park: | 17.8% |
| Columbia: | 31.8% |
Percentage of never married females 15 years old and over:
| Grove Park: | 19.9% |
| city: | 26.3% |
Percentage of people that speak English not well or not at all:
| Grove Park: | 0.0% |
| Columbia: | 0.6% |
Percentage of people born in this state:
Percentage of people born in another U.S. state:
Percentage of native residents but born outside the U.S.:
Percentage of foreign born residents:
| Here: | 56.0% |
| Columbia: | 53.1% |
Percentage of people born in another U.S. state:
| Grove Park: | 36.2% |
| Columbia: | 40.1% |
Percentage of native residents but born outside the U.S.:
| Here: | 2.4% |
| city: | 2.2% |
Percentage of foreign born residents:
| Here: | 5.4% |
| Columbia: | 4.6% |

Owner-occupied
Renter-occupied


- Rooms in owner-occupied houses and condos in Grove Park
- 01 room
- 02 rooms
- 13 rooms
- 154 rooms
- 265 rooms
- 416 rooms
- 257 rooms
- 178 rooms
- 99+ rooms

- Rooms in renter-occupied apartments in Grove Park
- 21 room
- 82 rooms
- 133 rooms
- 244 rooms
- 195 rooms
- 126 rooms
- 57 rooms
- 68 rooms
- 79+ rooms
Owner-occupied
Renter-occupied

- Bedrooms in owner-occupied houses and condos in Grove Park
- 0no bedroom
- 21 bedroom
- 442 bedrooms
- 653 bedrooms
- 194 bedrooms
- 95+ bedrooms

- Bedrooms in renter-occupied apartments in Grove Park
- 2no bedroom
- 81 bedroom
- 442 bedrooms
- 173 bedrooms
- 104 bedrooms
- 05+ bedrooms
Average number of cars or other vehicles available in houses/condos:
Average number of cars or other vehicles available in apartments:
| This neighborhood: | 1.7 |
| Columbia: | 1.8 |
Average number of cars or other vehicles available in apartments:
| Here: | 1.3 |
| city: | 1.3 |
Percentage of units with a mortgage:
| Grove Park: | 65.4% |
| Columbia: | 67.5% |
Average estimated value of detached houses in 2022 (72.3% of all units):
| Grove Park: | $142,151 |
| Columbia: | $305,357 |

- Year house built in Grove Park
- 02020 or later
- 22010 to 2019
- 42000 to 2009
- 151990 to 1999
- 91980 to 1989
- 311970 to 1979
- 521960 to 1969
- 771950 to 1959
- 261940 to 1949
- 61939 or earlier

City-data.com crime index for city in 2020 (higher means more crime):
| City: | 446.0 |
| U.S. average: | 219.5 |
Travel time to work (commute)
![Travel time to work (commute)]()
- 3Less than 5 minutes
- 115 to 9 minutes
- 2410 to 14 minutes
- 3115 to 19 minutes
- 2220 to 24 minutes
- 625 to 29 minutes
- 730 to 34 minutes
- 135 to 39 minutes
- 1245 to 59 minutes
- 160 to 89 minutes
- 590 or more minutes

Means of transportation to work
![Means of transportation to work]()
- 83.6%170Drove a car alone
- 7.4%15Carpooled
- 3.9%8Bus
- 2.5%5Taxi
- 1.5%3Walked
- 1.0%2Other means
- 4.9%10Worked at home

Time leaving home to go to work
![Time leaving home to go to work]()
- 312:00 a.m. to 4:59 a.m.
- 25:00 a.m. to 5:29 a.m.
- 25:30 a.m. to 5:59 a.m.
- 66:00 a.m. to 6:29 a.m.
- 116:30 a.m. to 6:59 a.m.
- 117:00 a.m. to 7:29 a.m.
- 207:30 a.m. to 7:59 a.m.
- 188:00 a.m. to 8:29 a.m.
- 158:30 a.m. to 8:59 a.m.
- 99:00 a.m. to 9:59 a.m.
- 110:00 a.m. to 10:59 a.m.
- 211:00 a.m. to 11:59 a.m.
- 412:00 p.m. to 3:59 p.m.
- 94:00 p.m. to 11:59 p.m.

Occupations of males:
- Percentage of males in management occupations (except farmers):
Here: 14.8% city: 12.3%
- Percentage of males in business and financial operations occupations:
Here: 12.2% city: 4.6%
- Percentage of males in computer and mathematical occupations:
Here: 3.9% city: 3.7%
- Percentage of males in architecture and engineering occupations:
Here: 1.4% city: 2.3%
- Percentage of males in life, physical, and social science occupations:
Here: 4.5% city: 1.7%
- Percentage of males in community and social services occupations:
Here: 2.7% city: 1.3%
- Percentage of males in education, training, and library occupations:
Here: 11.4% city: 6.7%
- Percentage of males in arts, design, entertainment, sports, and media occupations:
Here: 2.7% city: 2.0%
- Percentage of males in service occupations:
Here: 9.0% city: 18.4%
- Percentage of males in sales and office occupations:
Here: 12.0% city: 16.6%
- Percentage of males in construction, extraction, and maintenance occupations:
Here: 8.4% city: 4.8%
- Percentage of males in production occupations:
Here: 3.2% city: 3.9%
- Percentage of males in transportation occupations:
Here: 10.1% city: 4.1%
- Percentage of males in material moving occupations:
Here: 2.9% city: 5.8%
Occupations of females:
- Percentage of females in management occupations (except farmers):
Here: 17.8% city: 8.8%
- Percentage of females in business and financial operations occupations:
Here: 6.4% city: 6.4%
- Percentage of females in life, physical, and social science occupations:
Here: 1.9% city: 1.4%
- Percentage of females in education, training, and library occupations:
Here: 4.4% city: 11.5%
- Percentage of females in arts, design, entertainment, sports, and media occupations:
Here: 1.2% city: 2.6%
- Percentage of females in healthcare practitioners and technical occupations:
Here: 6.9% city: 8.7%
- Percentage of females in service occupations:
Here: 20.3% city: 20.2%
- Percentage of females in sales and office occupations:
Here: 37.5% city: 26.9%
Percentage of people 16-64 in Armed Forces:
| Grove Park: | 0.4% |
| Columbia: | 7.2% |
Education in this neighborhood (subdivision or community):
- Percentage of people 3 years and older in K-12 schools:
Grove Park: 15.3% Columbia: 12.2%
- Percentage of people 3 years and older in undergraduate colleges:
Grove Park: 8.8% Columbia: 16.2%
- Percentage of people 3 years and older in grad. or professional schools:
Grove Park: 3.4% Columbia: 3.5%
- Percentage of students K-12 enrolled in private schools:
Grove Park: 36.5% Columbia: 24.2%
Percentage of population below poverty level:
| Grove Park: | 14.3% |
| Columbia: | 20.7% |
Median year owner moved in (as recorded in 2022):
Median year renter moved in (as recorded in 2022):
| Grove Park: | 2006 |
| Columbia: | 2013 |
Median year renter moved in (as recorded in 2022):
| Grove Park: | 2017 |
| Columbia: | 2022 |
Percentage of married-couple families with both working:
| Grove Park: | 87.5% |
| Columbia: | 72.3% |

- 56.1%Electricity
- 38.8%Utility gas
- 3.7%No fuel used
- 1.5%Bottled, tank, or LP gas
Highways in this neighborhood:
N Belt Line Blvd (State Hwy 16)
Length: 0.24 miles
Direction: SE-NW
Address range: 2700 to 2899
Direction: SE-NW
Address range: 2700 to 2899
Roads and streets:
Quitman St
Length: 0.36 miles
Directions: N-S, SW-NE
Address range: 2700 to 3143
Directions: N-S, SW-NE
Address range: 2700 to 3143
Oakview Rd
Length: 0.29 miles
Directions: E-W, SE-NW, SW-NE
Address range: 2925 to 3199
Directions: E-W, SE-NW, SW-NE
Address range: 2925 to 3199
Craig Rd
Length: 0.26 miles
Directions: N-S, SW-NE
Address range: 2700 to 2999
Directions: N-S, SW-NE
Address range: 2700 to 2999
Pruitt Dr
Length: 0.18 miles
Directions: E-W, SW-NE
Address range: 2800 to 2899
Directions: E-W, SW-NE
Address range: 2800 to 2899
Stepp Dr
Length: 0.18 miles
Directions: E-W, SE-NW
Address range: 2800 to 2899
Directions: E-W, SE-NW
Address range: 2800 to 2899
Covenant Rd
Length: 0.17 miles
Direction: E-W
Address range: 3060 to 3199
Direction: E-W
Address range: 3060 to 3199
Mills Dr
Length: 0.13 miles
Direction: SW-NE
Address range: 2700 to 2799
Direction: SW-NE
Address range: 2700 to 2799
Spann St
Length: 0.13 miles
Directions: E-W, SW-NE
Address range: 2800 to 2899
Directions: E-W, SW-NE
Address range: 2800 to 2899